Time series
The LUCAS has been carried out every 3 years between 2006 and 2018.
A total of 1 351 293 points at 651 780 unique locations for 106 variables, along with 5.4 million photos, were collected during the LUCAS in 2006, 2009, 2012, 2015, and 2018.
The core information collected remained stable. However, minor variations had been introduced in different survey years, limiting the direct comparability of the information gathered.
The data from the different surveys have been merged into a directory of harmonised variables to enable time series analysis. This directory is the most comprehensive, in-situ dataset on land cover and use in the EU. It facilitates easier exploitation and better temporal analysis of the existing data and photos. It is also valuable for geospatial and statistical analysis of land use and land cover change.
For a detailed description of the harmonisation process, please read the article ‘Harmonised LUCAS in-situ land cover and use database for field surveys from 2006 to 2018 in the European Union’.
Documentation of points visited
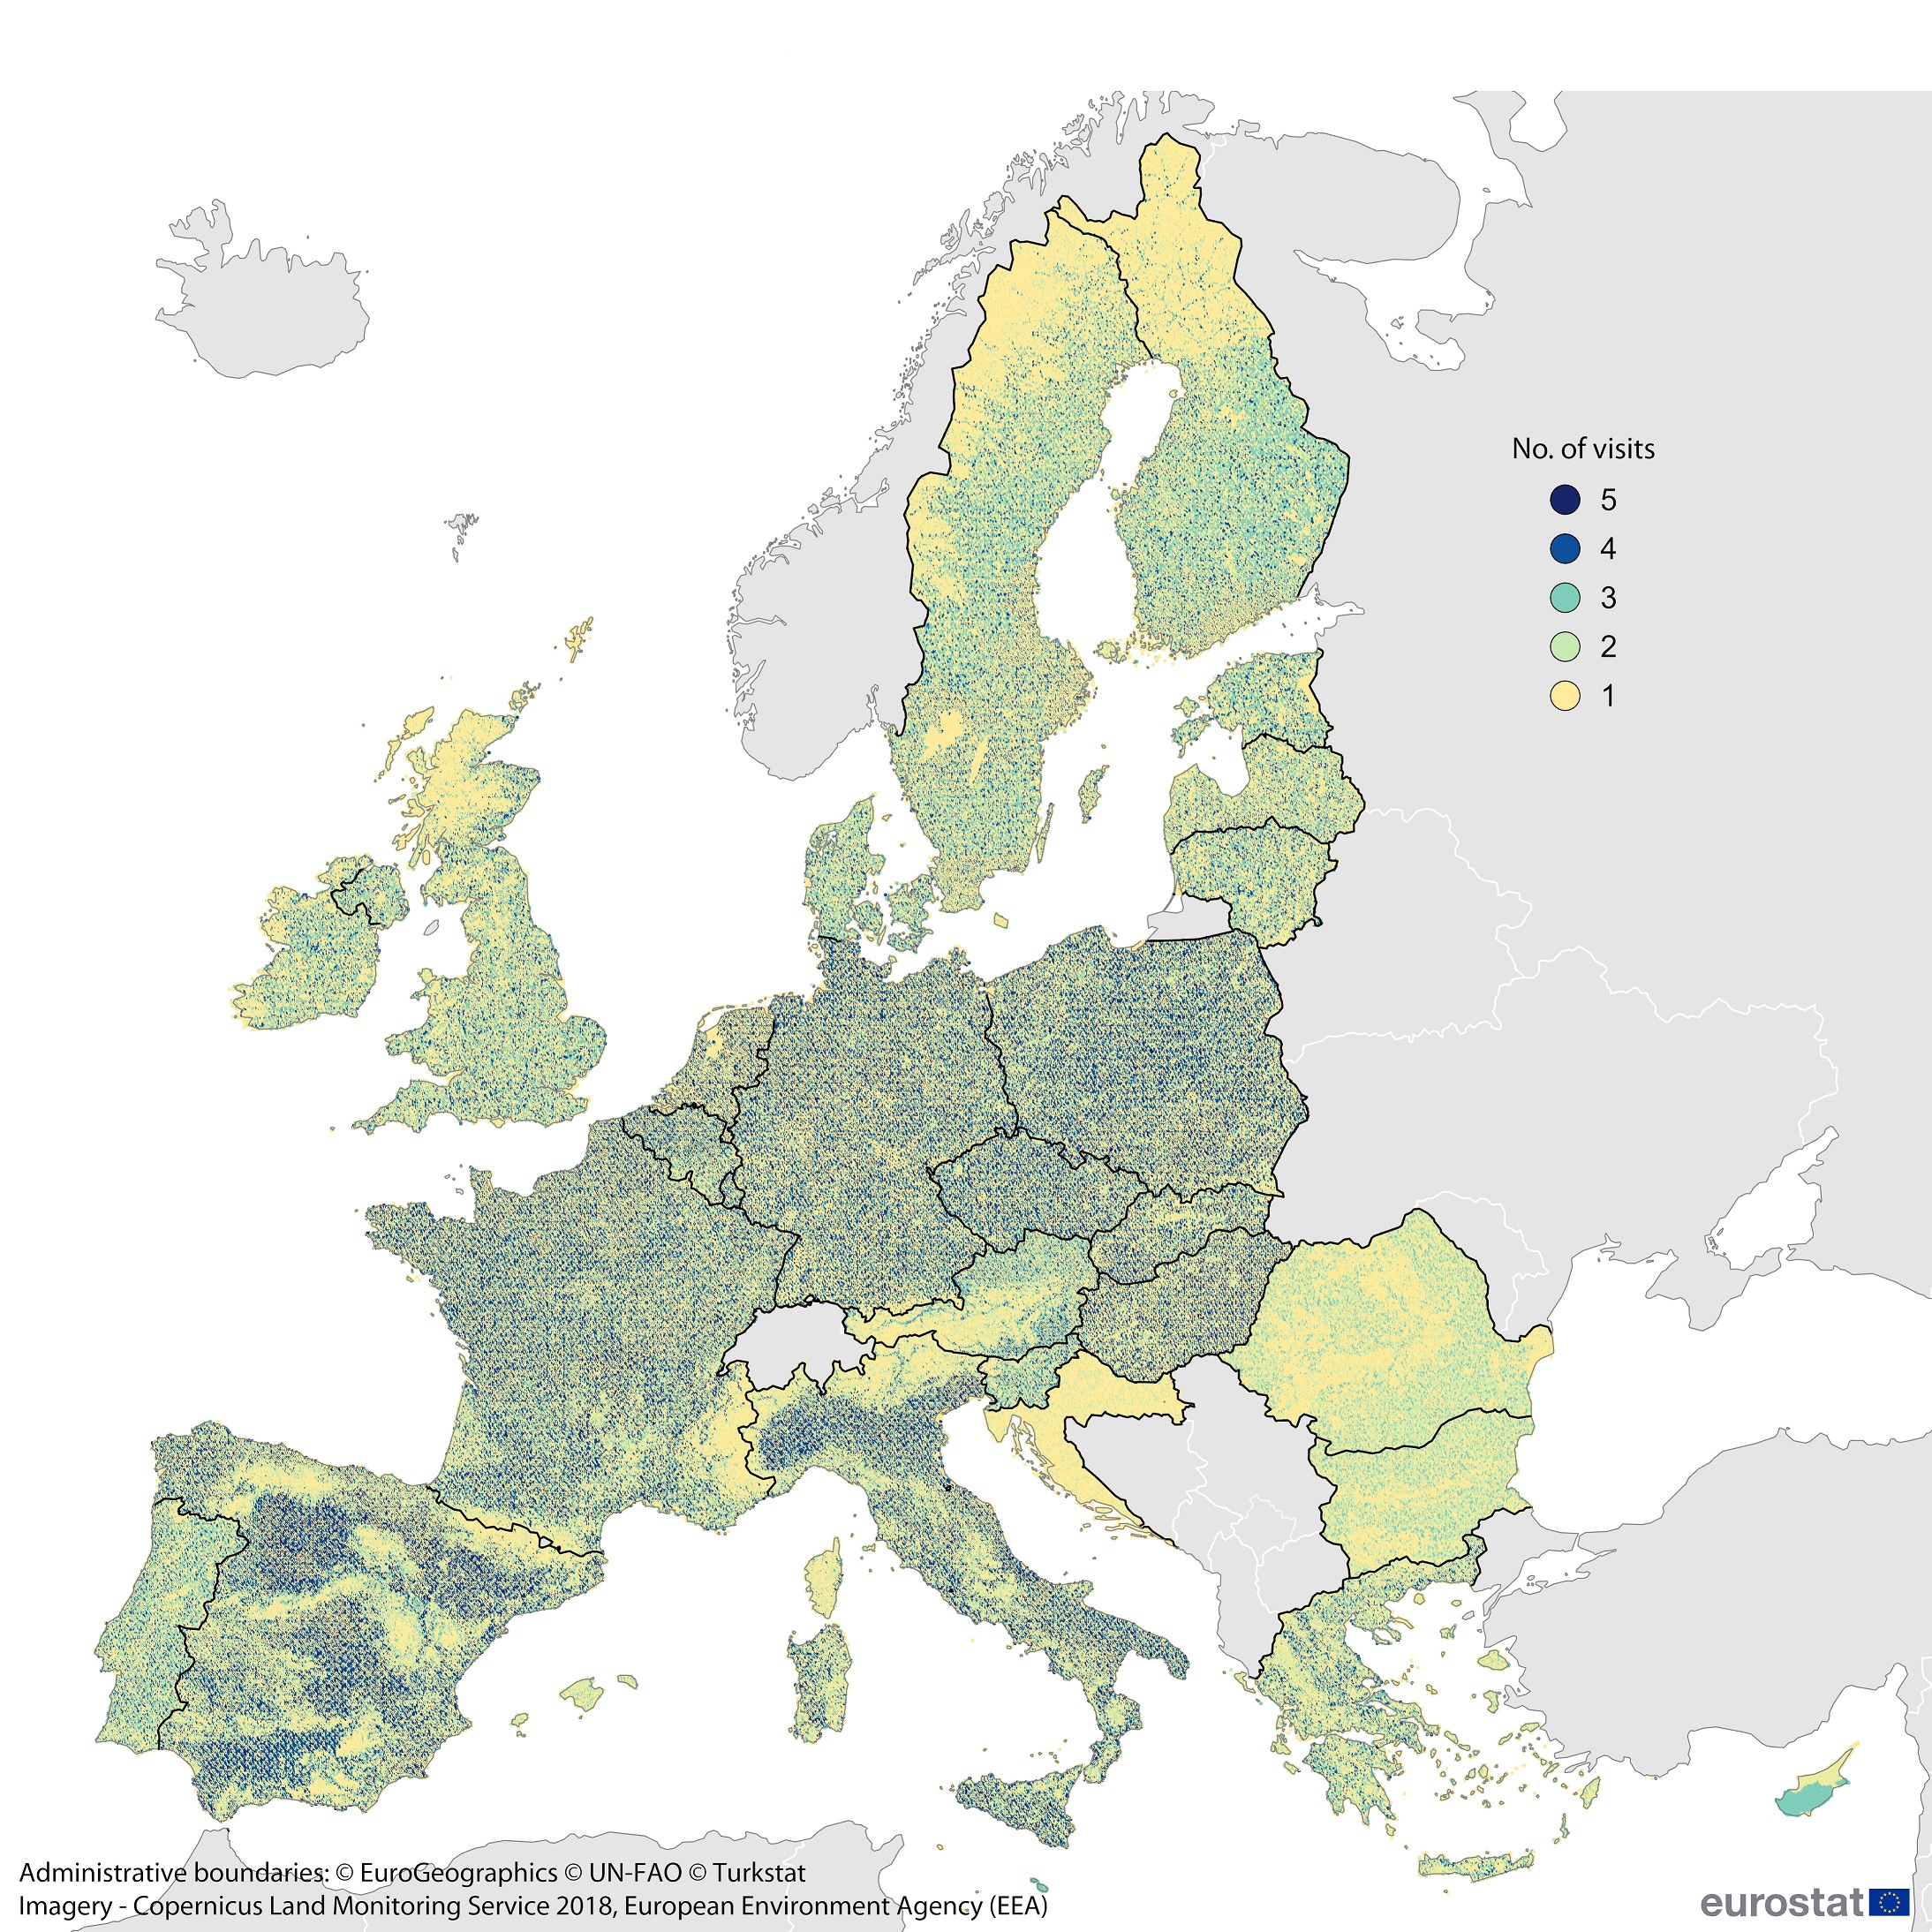
The following map shows the LUCAS points selected during the different survey campaigns. The number of times these points were visited ranges between 1 to 5 times, with 651 780 of the points surveyed at least once.
Number of times a point was visited in a LUCAS
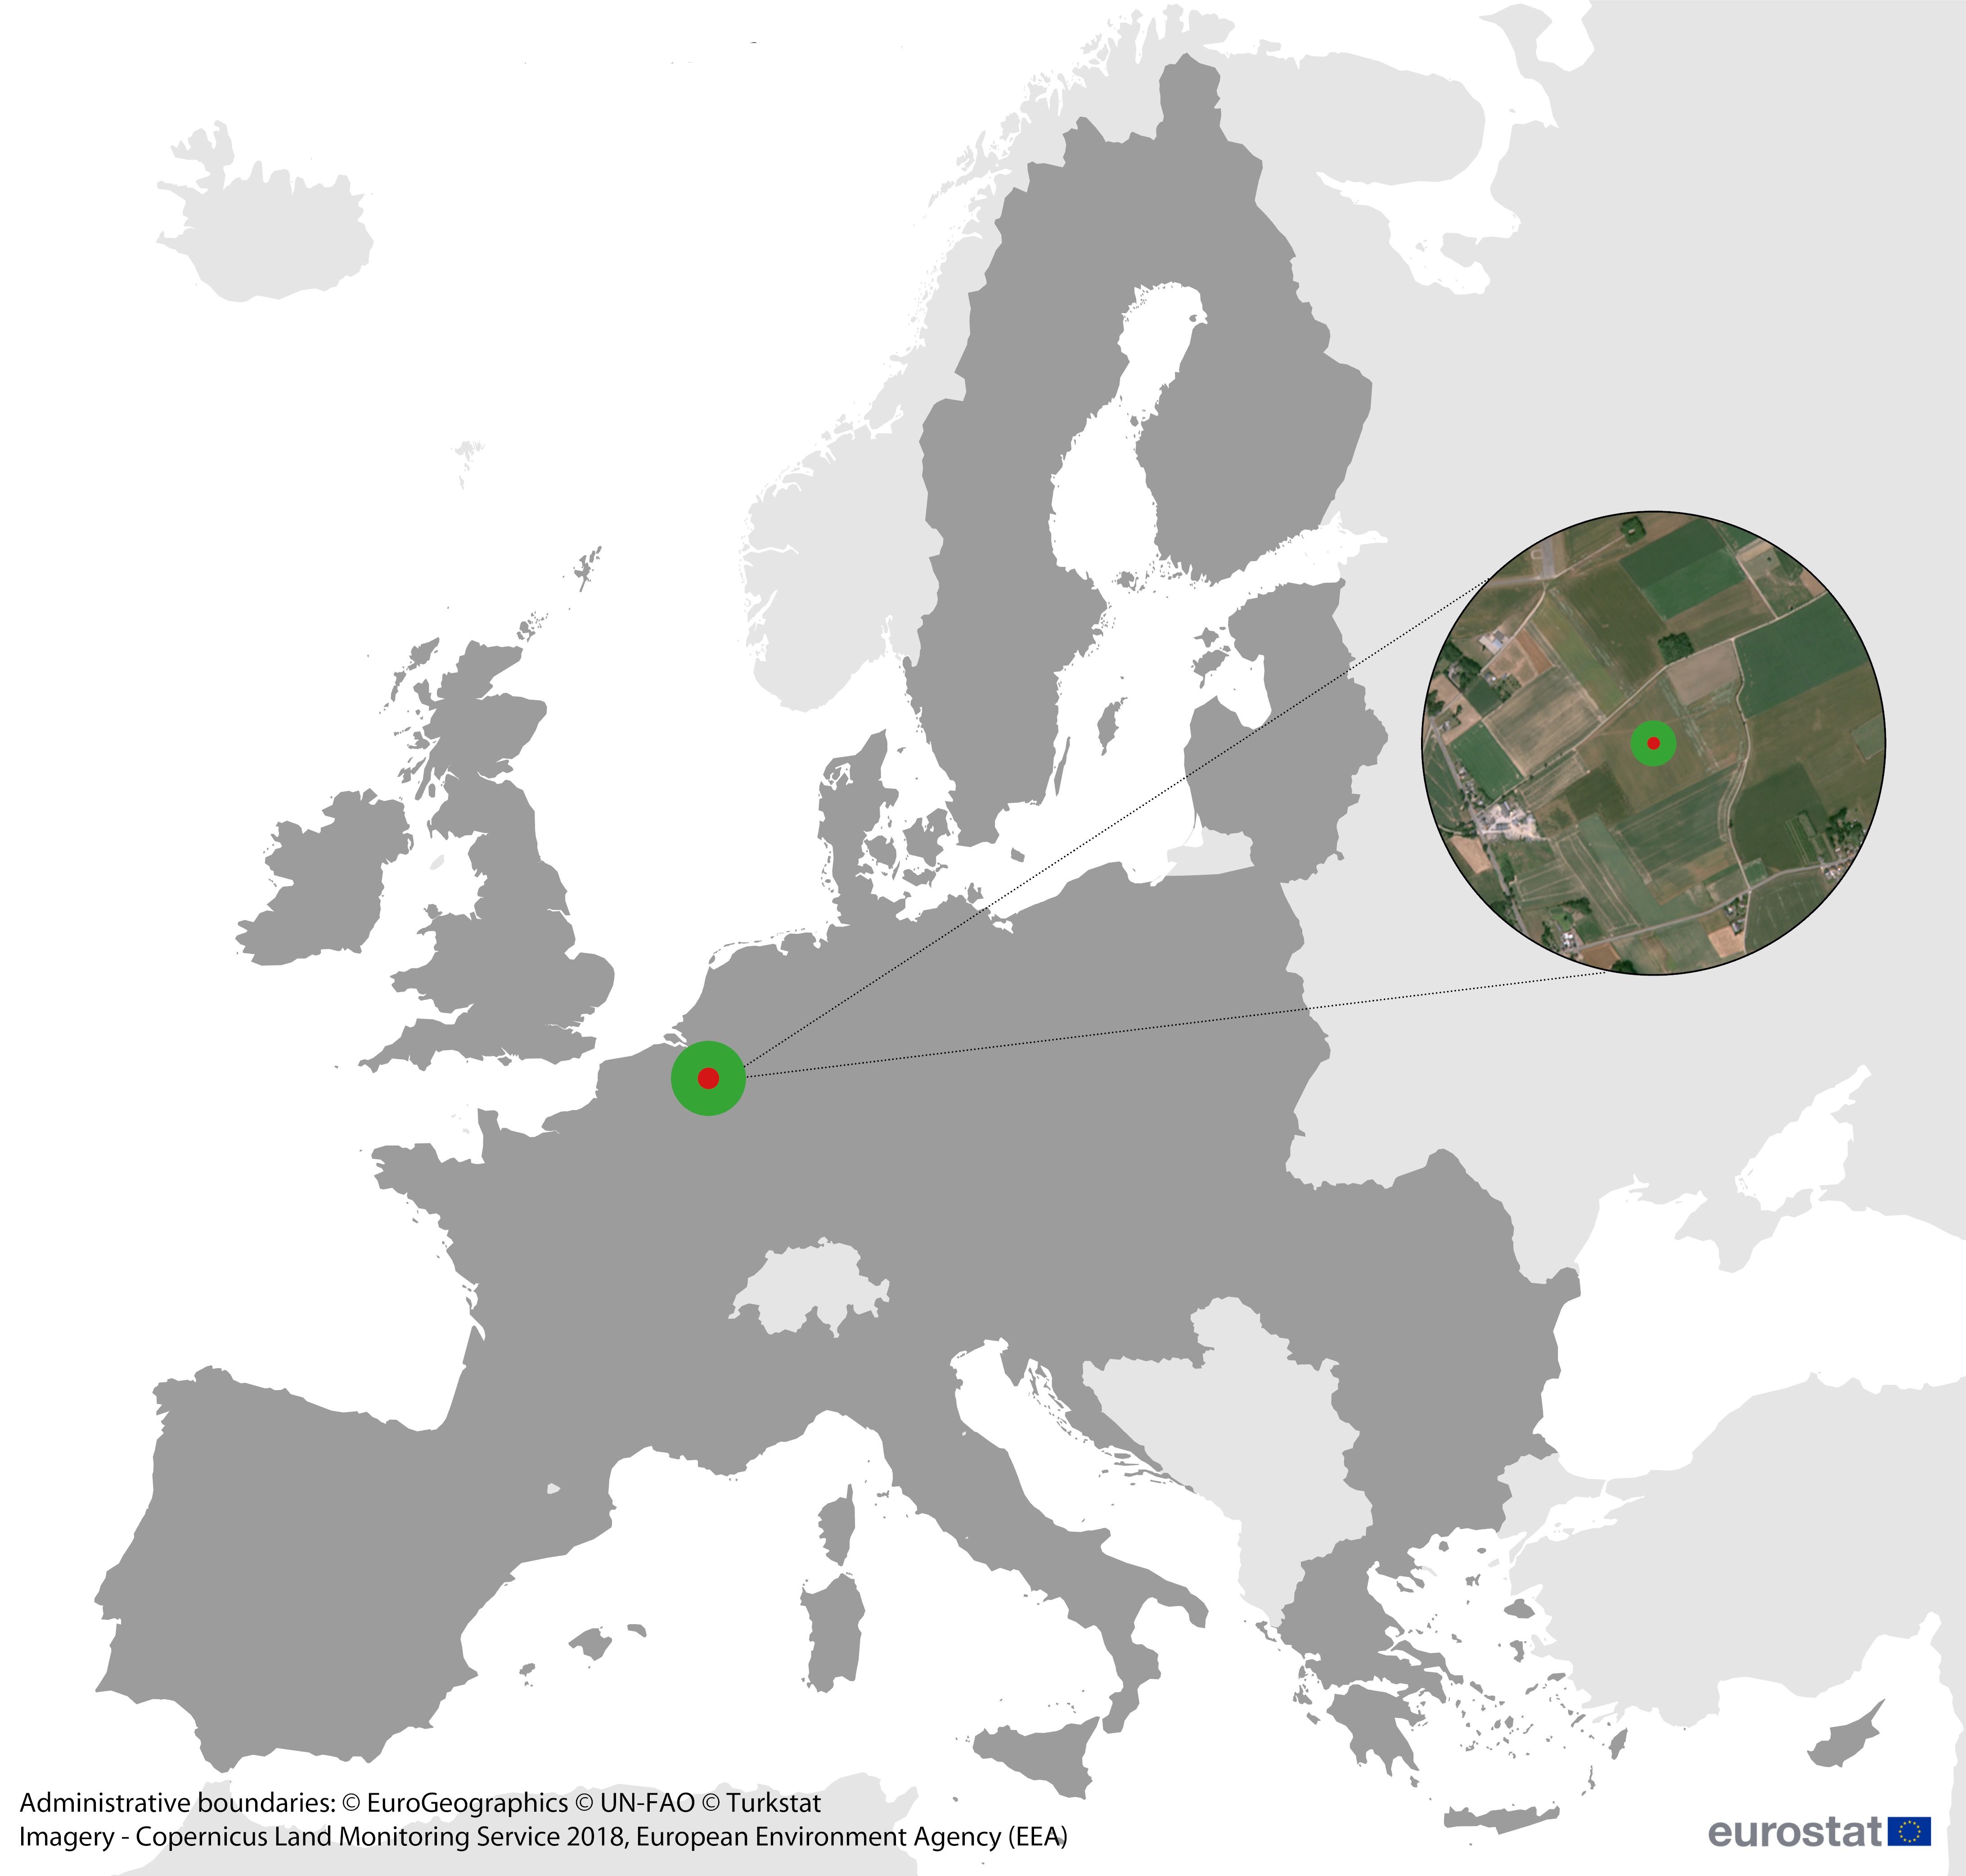
Zoom of location of a LUCAS point
Point North, East, South, and West
The example below of 1 LUCAS point, which was visited and documented in 2006, 2009, 2012, 2015, and 2018 survey, shows how its land cover changed over the years.
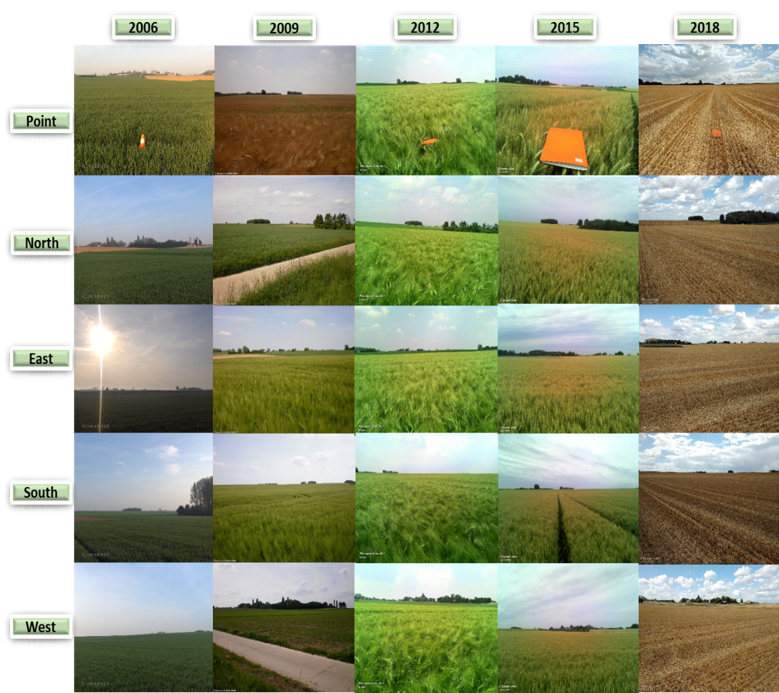
Data for LUCAS point visited 5 times
| Year | Land cover |
|---|---|
| 2006 | Common wheat |
| 2009 | Barley |
| 2012 | Barley |
| 2015 | Common wheat |
| 2018 | Common wheat |