Information on data
A scoreboard of statistical indicators has been implemented for the surveillance of macroeconomic imbalances. It includes 14 headline indicators for the identification and monitoring of the most relevant dimensions of macroeconomic imbalances and losses of competitiveness (external imbalances and competitiveness, internal imbalances, and employment) with a particular focus on the smooth functioning of the euro area. The MIP scoreboard is complemented by auxiliary indicators that allow a better understanding of the risks and help to identify relevant policy measures.
The selection of indicators is subject to periodic review to ensure that the scoreboard is adapted to the changing nature of macroeconomic imbalances and to the availability of new relevant statistics.
Starting from 2023, the MIP procedure is focused more on emerging risks and the evolution of imbalances. Moreover, greater attention is given to developments in the whole European Union and euro area. Therefore, EU and euro area aggregates have been added.
External imbalances and competitiveness
The table below lists the indicators used for this area, the unit they are expressed in, and the related threshold.
| Indicator | Unit | Threshold |
|---|---|---|
| Current account balance | 3-year average | - 4/6% |
| Net international investment position | % of GDP | - 35% |
| Real effective exchange rate | 3-year % change | ± 5% for Euro area (EA) countries ± 11% for non-EA countries |
| Export market shares | 5-year % change | - 6% |
| Nominal unit labour cost index | 3-year % change | 9% for EA countries 12% for non-EA countries |
The current account provides information about the transactions of a country with the rest of the world. It covers all transactions (other than those in financial items) in goods, services, primary income, and secondary income which take place between resident and non-resident units. It is either expressed as percentage of gross domestic product (GDP) or in millions of national currency. The financial flows are marked as credit, debit or balance.
The MIP scoreboard indicator is the 3-year backward moving average of the current account (CA) balance expressed as percentage of GDP. It is calculated as:
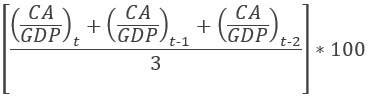
The thresholds for this indicator are +6% and -4%.
The international investment position (IIP) is a statistical statement that shows, at a point in time, the value and composition of:
- financial assets of residents of an economy that are claims on non-residents and gold bullion held as reserve assets;
- liabilities of residents of an economy to non-residents.
The difference between an economy's external financial assets and liabilities is the economy's net IIP, which may be positive or negative. The net IIP (NIIP) provides an aggregate view of the net financial position (assets minus liabilities) of a country vis-à-vis the rest of the world. It allows for a stock-flow analysis of the external position of a country.
The MIP scoreboard indicator is the NIIP expressed as percentage of GDP. It is calculated as:
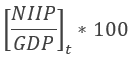
The threshold is -35%.
The real effective exchange rate (REER) is used to assess a country's price or cost competitiveness relative to its principal competitors in international markets. Changes in cost and price competitiveness depend not only on exchange rate movements but also on cost and price trends.
The MIP scoreboard indicator is the REER based on consumer price index deflators for 42 trading partners (REER_HICP_42), expressed as percentage change over a 3-year period. A positive value means a real appreciation. It is calculated as:

The thresholds are ± 5% for euro area countries and ± 11% for non-euro area countries.
Data come from the European Commission's Directorate-General for Economic and Financial Affairs.
The export market share (EXPc) presents the share of each EU country within the total exports of the world (or region). The indicator measures the degree of importance of a country within the total exports of the region. For the calculation at current prices, the market share refers to the world trade (world export market share, EXPworld).
The MIP scoreboard indicator is the is the export market share of goods and services expressed as a percentage change over a 5-year period. It is calculated as:

The lower threshold is -6%.
Data for world exports come from the International Monetary Fund.
The nominal unit labour cost (ULC) index is defined as the ratio of labour cost to labour productivity, where labour cost is the ratio of the compensation of employees (current prices) to the number of employees, and labour productivity is the ratio of gross domestic product (at market prices in millions, chain-linked volumes, reference year = 2015) to total employment.
The MIP scoreboard indicator is the nominal ULC expressed as percentage change over a 3-year period. It is calculated as:
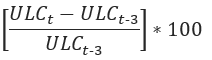
The threshold is 9% for euro area countries and 12% for non-euro area countries.
Internal imbalances
The table below lists the indicators used for this area, the unit they are expressed in, and the related threshold.
| Indicator | Unit | Threshold |
|---|---|---|
| House price index, deflated | 1-year % change | 6% |
| Private sector credit flow, consolidated | % of GDP | 14% |
| Private sector debt, consolidated | % of GDP | 133% |
| General government sector debt | % of GDP | 60% |
| Unemployment rate | 3-year average | 10% |
| Total financial sector liabilities, non-consolidated | 1-year % change | 16.5% |
The deflated house price index, also called real house price index, is the ratio between the house price index (HPI) and the national accounts deflator (DEFL) for private final consumption expenditure (by households and non-profit institutions serving households (NPISH)). This indicator therefore measures inflation in the housing market relative to inflation in the final consumption expenditure of households and NPISHs.
The MIP scoreboard indicator is the annual growth rate of the deflated house price index, reference year 2015 = 100. It is calculated as:

The threshold is 6%.
The private sector credit flow (PSCF) represents the net amount of liabilities that have been incurred by the sectors non-financial corporations, households and non-profit institutions serving households through the year. The instruments that are taken into account to compile private sector credit flow are debt securities and loans. Data are presented in consolidated terms, meaning that data do not take into account transactions within the same sector.
The MIP scoreboard indicator is the PSCF expressed as a percentage of gross domestic product (GDP). It is calculated as:
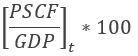
The threshold is 14%.
The private sector debt (PSD) is the stock of liabilities held by the sectors non-financial corporations, households and non-profit institutions serving households. The instruments taken into account to compile private sector debt are debt securities and loans. Data are presented in consolidated terms, meaning that they do not take into account transactions within the same sector.
The MIP scoreboard indicator is the stock of private sector debt expressed as a percentage of gross domestic product (GDP). It is calculated as:

The threshold is 133%.
General government gross debt (GGGD) is the total gross debt at nominal value outstanding at the end of the year and consolidated between and within the sectors of general government. The stock is equal to the sum of liabilities, at the end of year, of all units classified within the general government sector in the following categories: currency and deposits, debt securities, and loans.
The MIP scoreboard indicator is the GGGD expressed as a percentage of gross domestic product (GDP). It is calculated as:
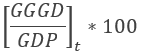
The threshold is 60%.
The unemployment rate (UR) is the number of unemployed persons as a percentage of the labour force (the total number of persons employed and unemployed) based on the International Labour Office definition. Persistently high rates of unemployment helps to understand the potential severity of macroeconomic imbalances. They point towards a potential misallocation of resources and general lack of adjustment capacity in the economy.
The MIP scoreboard indicator is the UR expressed as a 3-year backward moving average. This means that the data for year T is the arithmetic average of data for years T, T-1 and T-2. It is calculated as:
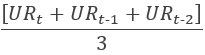
The threshold is 10%.
Total financial sector liabilities measure the evolution of the sum of all liabilities of the financial corporations sector (which includes currency and deposits, debt securities, loans, equity and investment fund shares/units, insurance, pensions and standardised guarantee schemes, financial derivatives and employee stock options and other accounts payable). Data are presented in non-consolidated terms, meaning that data take into account transactions within the same sector.
The MIP scoreboard indicator is the total financial sector liabilities expressed as an annual growth rate.
The threshold is 16.5%.
Employment indicators
The table below lists the indicators used for this area, the unit they are expressed in, and the related threshold.
| Indicator | Unit | Threshold |
|---|---|---|
| Activity rate, % of total population aged 15-64 | 3-year change in percentage points (p.p.) | -0.2 p.p. |
| Long-term unemployment rate, % of active population aged 15-74 | 3-year change in p.p. | 0.5 p.p. |
| Youth unemployment rate, % of active population aged 15-24 | 3-year change in p.p. | 2.0 p.p. |
The activity rate is the percentage of the economically active population aged 15-64 as a proportion of the total population of the same age range, according to the relevant definition of the International Labour Organization.
The MIP scoreboard indicator is the activity rate expressed as a 3-year change in percentage points.
The threshold is - 0.2 percentage points.
The long-term unemployment rate is the number of persons unemployed for 12 months or longer as a percentage of the labour force, meaning the economically active population, according to the relevant definition of the International Labour Organization.
The MIP scoreboard indicator is the long term unemployment rate expressed as a 3-year change in percentage points.
The threshold is 0.5 percentage points.
The youth unemployment rate is the unemployment rate of people aged 15-24 as a percentage of the labour force of the same age group, according to the relevant definition of the International Labour Organization.
The MIP scoreboard indicator is the youth unemployment rate expressed as 3-year change in percentage points.
The threshold is 2.0 percentage points.
Auxiliary indicators
- real GDP – 1 year % change
- gross fixed capital formation in % GDP
- gross domestic expenditure on R&D in % of GDP
- current plus capital account (net lending-borrowing) in % GDP
- net international investment position excluding non-defaultable instruments in % GDP
- direct investment liabilities (flows) in % of GDP
- direct investment liabilities (stocks) in % of GDP
- net trade balance of energy products in % of GDP
- real effective exchange rates – euro area trading partners – 3 year % change
- terms of trade (goods and services) – 5 year % change
- export performance against advanced economies – 5 year % change
- export market share, in volume – 1 year % change
- labour productivity – 1 year % change
- gross non-performing loans of domestic and foreign entities in % of gross loans
- unit labour cost performance relative to euro area - 10 year % change
- house price index (2015 = 100), nominal – 3 year % change
- residential construction as % GDP
- household debt, consolidated (including NPISH) in % of GDP
- consolidated banking leverage, domestic and foreign entities – total assets/total equity
- employment – 1 year % change
- activity rate – % of total population aged 15-64
- long-term unemployment rate – % of active population aged 15-74
- youth unemployment rate – % of active population aged 15-24
- young people neither in employment nor in education and training – % of total population aged 15-24
- people at risk of poverty or social exclusion – % of total population
- people at risk of poverty after social transfers – % of total population
- severely materially and socially deprived people – % of total population
- people living in households with very low work intensity – % of total population aged 0-64
For further information, please consult our frequently asked questions.
Further reading
- Directorate-General for Economy and Financial Affairs: Scoreboard for the surveillance of macroeconomic imbalances