SDG 8 - Decent work and economic growth
Promote sustained, inclusive and sustainable economic growth, full and productive employment and decent work for all
Data extracted in April 2023.
Planned article update: June 2024.
Highlights

This article is a part of a set of statistical articles, which are based on the Eurostat publication ’Sustainable development in the European Union — Monitoring report on progress towards the SDGs in an EU context — 2023 edition’. This report is the seventh edition of Eurostat’s series of monitoring reports on sustainable development, which provide a quantitative assessment of progress of the EU towards the SDGs in an EU context.
SDG 8 recognises the importance of sustained economic growth and high levels of economic productivity for the creation of well-paid quality jobs and calls for opportunities for full employment and decent work for all.
Full article
Decent work and economic growth in the EU: overview and key trends
Sustainable economic growth and decent work are vital for the development and prosperity of European countries and the wellbeing and personal fulfilment of individuals. Monitoring SDG 8 in an EU context involves looking into trends in the areas of sustainable economic growth, employment and decent work. As illustrated by the figure on the right, the EU has made strong progress towards SDG 8 over the assessed five-year period. The EU’s economy has grown, which in turn has led to an improvement in the EU’s overall employment situation. The EU is thus on track to meet its respective 2030 targets for the overall employment rate and for the share of young people neither in employment nor in education or training. Additionally, working conditions have also improved, with fewer fatal work accidents and fewer people being affected by in-work poverty.
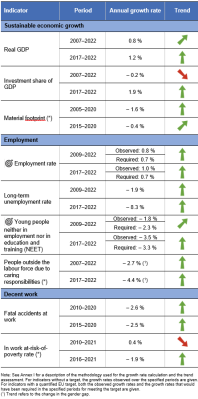
Table 1: Indicators measuring progress towards SDG 8, EU
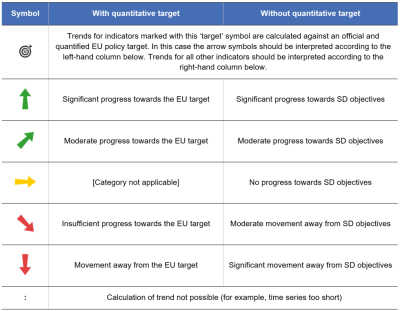
Table 2: Explanation of symbols for indicating progress towards SD objectives and targets


Economic growth
While economic growth is an important driver of prosperity and society’s wellbeing, it can also harm the environment it depends on. To ensure the wellbeing of future generations, the EU has adopted a new growth strategy, the European Green Deal, aimed at transforming the Union into a modern, resource-efficient, fair and competitive economy. The indicators selected to monitor this objective show that over the assessed five-year period, Europeans have generally enjoyed continuous economic growth while their material footprint has decreased — although the latter is likely to be a temporary effect of the COVID-19 pandemic.
Real GDP per capita in the EU grew by 3.3 % in 2022
Citizens’ living standards depend on the performance of the EU economy, which can be measured using several indicators. One of these is growth in gross domestic product (GDP). Although GDP is not a measure of welfare, it gives an indication of an economy’s potential to satisfy people’s needs and its capacity to create jobs. It can also be used to monitor economic development.
Real GDP per capita (GDP adjusted for inflation) in the EU saw strong and continuous growth of 2.0 % per year on average between 2014 and 2019. In 2020, the economy was hit by the COVID-19 pandemic, resulting in a 5.7 % contraction of real GDP compared with 2019. Nevertheless, the economy rebounded from the recession in the following years. In 2022, real GDP per capita grew by 3.3 % compared with the previous year and reached EUR 28 820 — this is a record high despite the economic reverberations of Russia’s ongoing war of aggression against Ukraine. This growth was mostly driven by a spending spree that came with an easing of COVID-19 containment measures [1]. In 2023 and 2024, GDP in the EU is projected to expand by 0.8 % and 1.6 %, respectively [2].
Investment is another indicator of economic growth as it enhances an economy’s productive capacity. In 2022, the total investment share of GDP in the EU reached 23.2 % — the highest level recorded since 2008. Businesses were the biggest investors in 2022, with an investment share in GDP of 14.0 %, followed by households with 6.0 % and governments with 3.2 %. The investment share of households has been slowly growing since 2016 but still remains below the levels before the 2008 financial crisis. This is most likely because [Glossary:Household_investment_rate|household investment] consists mainly of the purchase of dwellings. Government investment has followed a counter-cyclical pattern, increasing during both the financial crisis of 2008 and the COVID-19 crisis in 2020.
EU’s material footprint decreased in 2020 as a result of the pandemic
Economic growth helps to satisfy peoples’ material needs, which, in turn, can put pressure on the environment. The EU, therefore, aims to lower this pressure by reducing the Union‘s material footprint. The EU’s material footprint, also referred to as raw material consumption (RMC), shows the amount of material extracted from nature, both inside and outside the EU, to manufacture or provide the goods and services consumed by EU inhabitants. In other words, it refers to the resources needed to sustain the EU’s economic and social activities.
The EU’s material footprint had been growing between 2000 and 2007, before it was halted by the economic crisis of 2008. As the EU’s economy recovered, consumption had started to rise again, increasing by 4.3 % between 2014 and 2019. In 2020, EU inhabitants consumed 6.11 billion tonnes of raw material, which was 5.6 % less than the previous year and the lowest value observed since 2000. This fall is likely to be influenced by the economic slowdown due to the COVID-19 pandemic. Despite an overall decrease in RMC since 2000, the EU’s total material footprint is above the global average and exceeds sustainable levels of resource extraction. This means that Earth’s capacity to provide resources would be exceeded if all countries in the world were to consume resources at the same rate as the EU [3]. Discounting the temporary dip in 2020, RMC had been increasing over the past few years, which means the EU is not on track to significantly reduce its material footprint, as envisioned by the European Green Deal and the 8th Environmental Action Programme. For more information on the EU’s material footprint, see the article on SDG 12 ‘Responsible consumption and production’.
Employment
Decent employment for all — including women, people with disabilities, young people, older people, those with migrants backgrounds and other disadvantaged groups — is a cornerstone of socio-economic development. Apart from generating the resources needed for decent living standards and achieving life goals, work provides opportunities for meaningful engagement in society, which in turn promotes a sense of self-worth, purpose and social inclusion. Higher employment rates are a key condition for making societies more inclusive by reducing poverty and inequality in and between regions and social groups. The European Pillar of Social Rights Action Plan sets a target for at least 78 % of the population aged 20 to 64 to be in employment by 2030. It also envisions the complementary ambition of at least halving the gender employment gap and decreasing the rate of young people aged 15 to 29 who are neither in employment nor in education or training (NEETs) to 9 %.
The employment rate in the EU reached a historic high in 2022
Before the COVID-19 pandemic, the EU employment rate exhibited an upward trend, reaching 72.7 % in 2019. In 2020, the rate fell by one percentage point as a result of the socio-economic impacts of the pandemic, but has started increasing again. Despite the uncertain and challenging environment caused by Russia’s war of aggression against Ukraine, the employment rate in the EU reached a record high of 74.6 % in 2022. However, the slowing of economic activity is expected to weigh on the pace of the employment growth in 2023 and 2024 [4]. Nevertheless, if the employment growth observed since 2017 continues, the EU will be well placed to reach its target of 78 % by 2030.
An analysis by degree of urbanisation reveals that employment rates in cities, towns and suburbs and rural areas were all affected by the COVID-19 crisis, decreasing by between 0.8 and 1.0 percentage points from 2019 to 2020. By 2022, the employment rates had recovered, reaching 74.9 % in cities, 74.2 % in towns and suburbs and 74.8 % in rural areas. The employment gap between cities and rural areas has thus narrowed to 0.1 percentage points in 2022, after amounting to 0.3 to 0.5 percentage points between 2017 and 2021 [5].
Unemployment and long-term unemployment reached all-time low in 2022
The EU’s unemployment situation has been steadily improving since 2014, disregarding a temporarily COVID-19-related drop in 2020. Between 2014 and 2022, the EU’s unemployment rate for the age group 15 to 74 decreased by 4.8 percentage points, affecting 6.2 % of the population in the labour force in 2022 — the lowest value recorded since 2009 [6]. Over the past years, city dwellers have been more affected by unemployment than those living in rural areas. In 2022, the unemployment rate in cities was 6.8 % compared with 5.3 % for rural areas [7].
Long-term unemployment usually follows the trends in unemployment, but with a delay, meaning that the effects of the COVID-19 pandemic are only visible in 2021 data. Being unemployed for a year or more can have long-lasting negative implications for individuals and society by reducing employability prospects, contributing to human capital depreciation, endangering social cohesion and increasing the risk of poverty and social exclusion. Beyond material living standards, it can also lead to a deterioration of individual skills and health status, thus hindering future employability, productivity and earnings.
As a result of the COVID-19 pandemic, long-term unemployment in the EU increased by 0.3 percentage points from 2020 to 2021, affecting 2.8 % of the labour force in 2021. However, already in 2022 the rate returned to a decreasing path and reached the lowest value on record at 2.4 %. The proportion of long-term unemployment in total unemployment had been decreasing between 2015 and 2020, before this trend was halted due to the effects of the pandemic. In 2022, the share of long-term unemployment in total unemployment was 38.5 %, 4.6 percentage points above the level observed in 2020 [8].
The labour market situation of young people is improving
The economic growth observed over the past few years has also helped to improve the labour market situation of younger people, with the employment rate of 20- to 24-year-olds growing steadily between 2014 and 2019. Nevertheless, they were hit harder by the COVID-19 crisis than older age groups. This is because young people are more likely to be employed on temporary and other atypical contracts (such as part-time, on-call or zero-hour contracts). However, already by 2022, the youth employment rate (20-24-year-olds) had recovered and reached 53.3 %. While this is the highest level recorded, it is still lower than for other age groups [9]. This overall low employment rate of people aged 20 to 24 can be explained by the fact that many people at this age are in education and thus not part of the labour force. In addition, youth unemployment was significantly higher than for older age groups. Despite a strong 10.5 percentage point decrease in youth unemployment since 2013, 12.9 % of 20- to 24-year-olds were unemployed in 2022 [10].
Young people not engaged in employment nor in education and training (NEET) are among the most vulnerable groups in the labour market. Over the long term they may fail to gain new skills and suffer from erosion of competences, which in turn might lead to a higher risk of labour market and social exclusion. To improve the labour market situation of young people, the EU set a complementary target of decreasing the NEET rate to 9 % by 2030.
Between 2013 and 2019, the NEET rate for 15- to 29-year-olds in the EU improved from 16.4 % to 12.8 %. Despite a COVID-19 related increase in 2020, already by 2022 the NEET rate had dropped to 11.7 %, which was the lowest value recorded. If this positive trend continues, the EU is well placed to reach its NEET rate target of 9 % by 2030. Since 2009, the NEET rate in rural areas and towns and suburbs had been higher than in cities and reached 12.2 % in towns and suburbs and 12.6 % in rural areas in 2022, compared with a rate of 10.9 % in cities [11].
Women’s participation in the labour market is growing, but gender differences persist
The employment rate of women in the EU has been increasing since 2009. After a dip caused by the COVID-19 pandemic, it reached a new high of 69.3 % in 2022. The gender employment gap, however, continues to persist, despite narrowing by 2.7 percentage points since 2009. In 2022, it amounted to 10.7 percentage points, despite women becoming increasingly well-qualified and even outperforming men in terms of educational attainment (see the article on SDG 5 ‘Gender equality’).
Inflexible work-life-balance options and underdeveloped care services — both for childcare and long-term care of a family member — are major impediments to women remaining in or returning to work. Caring responsibilities, which include care for children, care for adults with disabilities, and other family or personal responsibilities, are more often performed by women, contributing to the gender employment gap. In the EU, 1.5 % of women aged 20 to 64 were outside the labour force because they were caring for children or incapacitated adults, compared with only 0.3 % of men in 2022. Caring responsibilities are also the main reason why women are opting for part-time employment [12]. As a result, women were overrepresented in part-time employment, with 27.8 % of employed women working part-time in 2022, compared with 7.6 % of employed men [13].
Interestingly, the share of women who indicated caring responsibilities as the main reason for part-time employment in 2022 varied widely across the EU Member States, from 2.5 % in Denmark to 45.4 % in the Netherlands [14]. Similarly, the share of women working part-time varied significantly. While only 1.7 % of women in Bulgaria and 2.7 % in Romania performed part-time work, this was the case for 60.6 % of women in the Netherlands and 51.0 % in Austria in 2022 [15].
Employment opportunities are lower for people with disabilities
People with disabilities are those who have a basic activity difficulty (such as seeing, hearing, walking or communicating) and/or a work limitation caused by a longstanding health condition and/or a basic activity difficulty [16]. Disabilities impact people’s lives in many areas, including participation in the labour market. In 2021, the employment rate of people with disabilities at the EU level was 23.1 percentage points lower compared with people without disabilities. For women with disabilities, this gap was 20.4 percentage points, while for men with disabilities it was 25.1 percentage points. The degree of disability is also an important factor affecting the employment rate. At the EU level, the employment rate for people with a severe disability was 42.8 percentage points lower than for people without a disability, while for people with a moderate disability the gap was 16.2 percentage points in 2021 [17].
Decent work
For a society’s sustainable economic development and wellbeing it is crucial that economic growth generates not just any kind of job but ‘decent’ jobs. This means that work should deliver fair income, workplace security and social protection for families, better prospects for personal development and social integration and equality of opportunity [18]
Over the past few years, work in the EU has become safer and more economically secure
A prerequisite for decent work is a safe and healthy working environment, without non-fatal and [Glossary:Fatal_accident_at_work|fatal accidents], where risks of work-related hazardous events or exposures are minimised. Over the past few decades, the EU and its Member States have put considerable effort into ensuring at least minimum standards in occupational health and safety at work. After almost a decade of steady decline, the rate of fatal incidents at work slightly increased in 2020, amounting to 1.8 fatalities per 100 000 employed persons, with the mining and quarrying and construction sectors particularly prone to fatal accidents [19]. One of the reasons behind this increase might be the inclusion of a new category to the definition of an accident at work — COVID-19 of occupational origin — which some countries have already added to their statistics [20]. Although the incidence rate increased in 2020, the absolute number of fatal accidents decreased by 1.5 % compared with the previous year. Thus, the increase in the incidence rate may also be attributed to the fact that during the pandemic in 2020, the number of employed people fell by more than the number of fatal accidents did [21].
While there has been a significant decrease since 2010, a noticeable gender difference persists: in 2020, the incidence rate for women was only 0.3 per 100 000 persons, compared with 3.1 for men. This gender gap is due to the fact that activities with the highest incidence rates are mostly male-dominated [22].
Besides safety at work, fair income and social protection are also important components of decent work. Poverty is often associated with the absence of a paid occupation but low wages can also push some workers below the poverty line. People working part-time or on temporary contracts, low-skilled workers and non-EU born workers are especially affected by in-work poverty. In the EU, the share of the so-called ‘working poor’ (aged 18 and over) decreased between 2016 and 2020, from 9.8 % to 8.8 %. In 2021, the in-work at-risk-of-poverty rate remained rather stable, at 8.9 % of employed people. For more information on in-work poverty, see the article on SDG 1 ‘No Poverty’.
While a fixed-term, part-time contract or platform work may provide greater flexibility for both employers and workers, it is not always a personal choice for an employee and can thus significantly influence their wellbeing. In 2022, 4.3 % of European employees aged 20 to 64 were involuntarily working on temporary contracts, corresponding to 33.0 % of all temporary employees. This share has decreased significantly over the past few years [23]. The indicator on labour transitions from temporary to permanent contracts also shows that the share of such transitions has increased since 2015, reaching 27.1 % in 2020 (based on a three-year average) [24]. Similar to involuntary temporary employment, the share of involuntary part-time employment in total employment in the EU also decreased, from 5.3 % in 2017 to 3.6 % in 2022 [25].
Presentation of the main indicators
Real GDP

Gross domestic product (GDP) is a measure of economic activity and is often used as a proxy for changes in a country’s material living standards. It refers to the value of total final output of goods and services produced by an economy within a certain time period. Real GDP per capita is calculated as the ratio of real GDP (GDP adjusted for inflation) to the average population of the same year and is based on rounded figures.
.png)
Source: Eurostat (sdg_08_10)
.png)
Source: Eurostat (sdg_08_10)

The investment share of GDP measures gross fixed capital formation (GFCF) for the total economy, government and business, as well as household sectors as a percentage of GDP.
.png)
Source: Eurostat (sdg_08_11)
.png)
Source: Eurostat (sdg_08_11)
Employment rate

The employment rate is defined as the percentage of employed persons in relation to the total population. The data analysed here focus on the population aged 20 to 64. Employed persons are defined as all persons who, during a reference week, worked at least one hour for pay or profit or were temporarily absent from such work. Data presented in this section stem from the EU Labour Force Survey (EU-LFS).
.png)
Source: Eurostat (sdg_08_30)
.png)
Source: Eurostat (sdg_08_30)

Source: Eurostat (lfst_r_lfe2emprt)
Long-term unemployment rate

Long-term unemployment is measured as a percentage of the population in the labour force (which includes both employed and unemployed people) aged 15 to 74 who have been unemployed for 12 months or more. Long-term unemployment increases the risk of a person completely stopping their search for employment and falling into poverty, and has negative implications for society as a whole. People in the EU who are long-term unemployed have about half the chance of finding employment as those who are short-term unemployed [26]. Data presented in this section stem from the EU Labour Force Survey (EU-LFS).
.png)
Source: Eurostat (sdg_08_40)
.png)
Source: Eurostat (sdg_08_40)
Young people neither in employment nor in education and training (NEET)
_evaluation_2023.PNG)
A considerable proportion of young people aged 15 to 29 in the EU are not employed. For some this is due to the pursuit of education and training. However, others have withdrawn from education and training as well. Those are captured by the statistics on young people who are neither in employment (meaning they are outside of the labour force or unemployed), education nor training (NEET rate). Data presented in this section stem from the EU Labour Force Survey (EU-LFS).
,_by_sex,_EU,_2009-2022_(%25_of_population_aged_15_to_29).png)
Source: Eurostat (sdg_08_20)
,_by_country,_2017_and_2022_(%25_of_population_aged_15_to_29).png)
Source: Eurostat (sdg_08_20)
Fatal accidents at work

Fatal accidents at work are those occurring during the course of employment and leading to the death of the victim within one year; commuting accidents occurring between the home and the workplace are excluded. The incidence rate refers to the number of accidents per 100 000 persons in employment. Data presented in this section are collected in the framework of the administrative data collection 'European Statistics on Accidents at Work (ESAW)' [27]. As an exception, fatal road traffic accidents at work are not included in the data from the Netherlands.
.png)
Source: Eurostat (sdg_08_60)
.png)
Source: Eurostat (sdg_08_60)
Direct access to
More detailed information on EU SDG indicators for monitoring of progress towards the UN Sustainable Development Goals (SDGs), such as indicator relevance, definitions, methodological notes, background and potential linkages, can be found in the introduction of the publication ’Sustainable development in the European Union — Monitoring report on progress towards the SDGs in an EU context — 2023 edition’.
Further reading on decent work and economic growth
- European Commission (2022), Employment and Social Developments in Europe 2022, Publications Office of the European Union, Luxembourg.
- European Commission (2023), European Economic Forecast, Winter 2023, Publications Office of the European Union, Luxembourg.
- European Commission, Women’s situation in the labour market.
- International Labour Organisation webpage on ‘decent work and the 2030 agenda for sustainable development’.
- International Labour Organisation (2023), World Employment and Social Outlook: Trends 2023, Geneva
- OECD (2022), OECD Employment Outlook 2022: Navigating the COVID-19 Crisis and Recovery, OECD Publishing, Paris.
- OECD Economic Outlook, Interim Report March 2022: Economic and Social Impacts and Policy Implications of the War in Ukraine, OECD Publishing, Paris.
- European Environment Agency (2021), Growth without economic growth.
Further data sources on decent work and economic growth
Notes
- ↑ European Commission (2022), European Economic Forecast, Autumn 2022, Publications Office of the European Union, Luxembourg, p. 1.
- ↑ European Commission (2023), European Economic Forecast, Winter 2023, Publications Office of the European Union, Luxembourg, p. 1.
- ↑ EEA (2022), Europe’s material footprint.
- ↑ European Commission (2023), European Economic Forecast, Winter 2023, Publications Office of the European Union, Luxembourg, p. 17.
- ↑ Source: Eurostat (online data code: (lfst_r_ergau)).
- ↑ Source: Eurostat (online data code: (une_rt_a)).
- ↑ Source: Eurostat (online data code: (lfst_r_urgau)).
- ↑ Source: Eurostat (online data code: (une_ltu_a)).
- ↑ Source: Eurostat (online data code: (lfsa_ergan)).
- ↑ Source: Eurostat (online data code: (lfsa_urgaed)).
- ↑ Source: Eurostat (online data code: (edat_lfse_29)).
- ↑ Source: Eurostat (online data code: (lfsa_epgar)).
- ↑ Source: Eurostat (online data code: (lfsa_epgaed)).
- ↑ Source: Eurostat (online data code: (lfsa_epgar)).
- ↑ Source: Eurostat (online data code: (lfsa_epgaed)).
- ↑ Eurostat, Prevalence of disability (source LFS).
- ↑ Source: Eurostat (online data code: (hlth_dlm200)).
- ↑ International Labour Organisation (2022), Decent work.
- ↑ Source: Eurostat (online data code: 02/default/table?lang=en (hsw_n2_ 02)).
- ↑ European Commission (2023), European Accidents at Work Statistics: COVID-19 Cases with Occupational Origin.
- ↑ Eurostat (2022), Statistics Explained: Accidents at work - statistics by economic activity.
- ↑ Eurostat (2022), Statistics Explained: Accidents at work - statistics by economic activity.
- ↑ Source: Eurostat (online data code: (lfsa_etgar)).
- ↑ Source: Eurostat (online data code: (ILC_LVHL36)).
- ↑ Source: Eurostat (online data code: (lfsa_epgar) and (lfsa_epgaed)).
- ↑ European Commission (2016), Employment and Social Developments in Europe 2015, Publications Office of the European Union, Luxembourg, p. 13.
- ↑ Eurostat (2013), European Statistics on Accidents at Work (ESAW) - Summary methodology, Publications Office of the European Union, Luxembourg.