SDG 12 - Responsible consumption and production
Ensure sustainable consumption and production patterns
Data extracted in April 2023.
Planned article update: June 2024.

This article is a part of a set of statistical articles, which are based on the Eurostat publication ’Sustainable development in the European Union — Monitoring report on progress towards the SDGs in an EU context — 2023 edition’. This report is the seventh edition of Eurostat’s series of monitoring reports on sustainable development, which provide a quantitative assessment of progress of the EU towards the SDGs in an EU context.
SDG 12 calls for a comprehensive set of actions from businesses, policy-makers and consumers to adapt to sustainable practices. It envisions sustainable production and consumption based on advanced technological capacity, resource efficiency and reduced global waste.
Full article
Responsible consumption and production in the EU: overview and key trends
Consumption and production patterns have wide environmental and social impacts. Monitoring SDG 12 in an EU context focuses on developments in the areas of decoupling environmental pressures from economic growth, the green economy, and waste generation and management. Overall, the EU’s progress towards this goal over the five-year period assessed has been mixed. While consumption of raw materials and energy productivity have shown positive developments, consumption of hazardous chemicals has increased. The picture is also mixed in the area of waste generation, where circular use of materials is not growing fast enough to meet the target, despite reduced waste generation. On a positive note, the value added from the environmental goods and services sector has been growing.
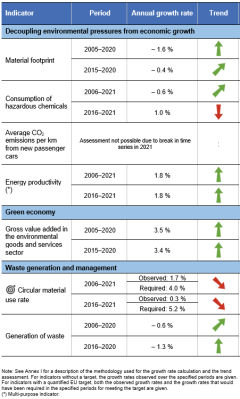
Table 1: Indicators measuring progress towards SDG 12, EU
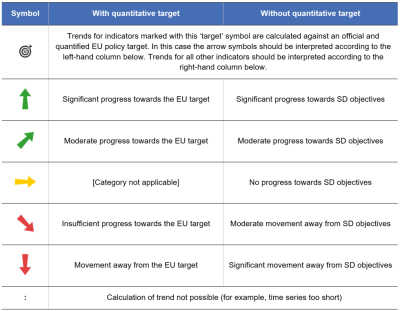
Table 2: Explanation of symbols for indicating progress towards SD objectives and targets


Decoupling environmental pressures from economic growth
Economic growth improves people’s wellbeing but has long been associated with growing resource and energy consumption. Continuous growth in the consumption of finite resources both harms the environment and significantly contributes to climate change. To tackle this challenge, the EU has launched a new growth strategy — the European Green Deal — which aims to transform the EU into a fair and prosperous climate-neutral society, with a modern, resource-efficient and competitive economy where economic growth is decoupled from resource use. It focuses on improving resource- and energy-use efficiency by restructuring economies so they produce more from the same resource and energy inputs.
The EU’s material footprint reached a new low in 2020 due to a 5.6 % decrease in the pandemic year
The material footprint, also referred to as raw material consumption (RMC), shows the amount of materials used along the supply chains of goods and services that are finally consumed in a country. The indicator thus measures the extracted materials (both domestic and abroad) needed to produce goods and services consumed by final users inside EU borders and estimates the volume of traded products — imports and exports — in raw material equivalents.
The EU’s material footprint had been growing between 2013 and 2019, before falling by 5.6 % in 2020 compared with the previous year. In absolute terms, final users in the EU consumed 6.11 billion tonnes of raw material (in raw material equivalents) in 2020, which translates into a per-capita material footprint of 13.7 tonnes. The most recent drop in the material footprint is likely to be the result of reduced economic activity during the pandemic and has led to the lowest RMC value recorded for past two decades. Nevertheless, the significant increase in the EU’s material consumption up to 2019 suggests further efforts might be required to meet the objectives of the European Green Deal, which calls for a reduction in environmental pressures alongside economic growth (also see the article on spillover effects).
The Consumption Footprint — a set of 16 indicators developed by the European Commission’s Joint Research Centre (JRC) to quantify the environmental impacts of the EU’s consumption — also reveals the need for further efforts to reduce consumption and achieve the EU’s policy goals. The results show the EU is responsible for a significant amount of environmental impacts outside its borders. The environmental impact of the EU’s consumption within the EU and abroad also increased by around 4 % between 2010 and 2021, due to growth in the amount of consumed goods. The largest increases occurred in the consumption of food (18 %), appliances (5 %) and household goods (5 %) [1].
More than half of fossil energy carriers and metal ores used in the EU are imported
Data on material import dependency reveal the extent to which an economy relies on imports to meet its material needs. Material import dependency is calculated as the ratio of imports to direct material input (DMI), which is the sum of imports and domestic extraction. In 2021, imports accounted for 22.9 % of the EU’s DMI. Import dependency was highest for fossil energy carriers, at 70.7 % in 2021, followed by metal ores at 51.7 %. The EU’s import dependency on fossil energy carriers has increased by about 10 percentage points over the past decade (up from around 60 %), while dependency on metal ore imports has remained stable. In contrast, the EU is almost completely self-sufficient for non-metallic minerals, with an import dependency of only 3.3 % in 2021 [2].
The EU’s self-sufficiency is especially relevant for critical raw materials (CRMs), which refer to raw materials that are of high importance to the EU economy combined with a high risk associated with their supply. To address the challenge of ensuring reliable and unhindered access to certain raw materials, the European Commission presents a list of critical raw materials that is reviewed every three years. The CRM list from 2023 contains 34 materials; data on the EU’s self-sufficiency are available for eight of them. They show that the EU’s self-sufficiency was highest for copper (62.3 % in 2018), lithium (30.1 %), fluorspar (29.0 %) and aluminium (9.8 %). However, the EU economy was (almost) completely dependent on imports for borate (0.0 % self-sufficiency), cobalt (2.6 %), natural graphite (0.3 %) and tantalum (0.0 %) [3]. To ensure access to a secure and sustainable supply of the critical raw materials needed for the EU to meet its 2030 climate and digital objectives, the Commission has proposed a Critical Raw Materials (CRM) Act. This would set benchmarks for domestic capacities, such as for extraction or recycling, to be met by 2030.
Resource and energy productivity have increased in the EU over the five-year period assessed
Resource productivity [4] monitors how much output an economy produces per unit of used materials and can provide insights into whether decoupling between the use of natural resources and economic growth is taking place. It is measured as the ratio of gross domestic product (GDP) to domestic material consumption (DMC). Between 2016 and 2021, the EU economy (in terms of GDP) grew by 6.3 %, while DMC grew at a slower pace, by 4.5 % over the same period. This resulted in a 1.4 % increase in the EU’s resource productivity, from EUR 2.06 per kg of DMC in 2016 to EUR 2.09 per kg in 2021 [5].
Similar to resource productivity, energy productivity [6] measures economic output (in terms of GDP) per unit of energy used. Observed trends for energy productivity are stronger than for resource productivity, due to larger decreases in energy consumption than in material use. Between 2016 and 2021, the EU increased its energy productivity by 9.1 %, from EUR 7.8 per kg of oil equivalent (kgoe) to 8.5 EUR per kgoe. Over the same period, economic growth of 6.3 % in the EU was accompanied by a reduction in gross available energy (GAE) of 2.6 % [7]. However, energy productivity decreased by 0.7 % in 2021 compared with the previous year, due to an increase in GAE.
Consumption of hazardous chemicals has been increasing
Most everyday products used by businesses and consumers are produced with the help of chemicals. This makes them a significant contributor to the EU economy, with chemical sales worth EUR 594 billion in 2021 [8]. The consumption of chemicals provides benefits to society but can also entail environmental and health risks. The level of risk depends on both the hazard presented by the chemicals and exposure to them. Tracking the consumption volumes of industrial (manufactured) chemicals that are hazardous to human and environmental health is, therefore, used as a proxy for human exposure [9].
In 2021, 226.0 million tonnes of hazardous chemicals were consumed in the EU. This is 8.3 % less than the amount consumed in 2006. However, the short term shows a more negative trend, with consumption increasing by 5.0 % between 2016 and 2021.
Average CO2 emissions from new car fleets have fallen over the past decade
Passenger cars are responsible for a considerable share of the EU’s total greenhouse gas (GHG) emissions. To reduce those emissions, the EU has set targets for the fleet-wide average emissions of new passenger cars. For each manufacturer’s new car fleet, a binding specific emission target is set according to the average mass of its new vehicles, in such a way that the overall target for the EU’s average fleet emissions will be met.
Between 2007 and 2020, data on the average CO2 emissions per km from new passenger cars were collected based on the New European Driving Cycle (NEDC) procedure. In 2021, the data collection was for the first time based on the World Harmonised Light-vehicle Test Procedure (WLTP) procedure. Compared to the former NEDC procedure, this leads to higher emission values that are more representative of vehicles’ emissions when they are used on the road. To ensure manufacturers’ targets are equally stringent, they have been converted to represent WLTP rather than NEDC conditions.
Data collected according to NEDC show that average CO2 emissions per km from new passenger cars registered in the EU fell almost continuously between 2007 and 2020, reaching 107.9 g/km. This is a 9.4 % reduction over the five-year period since 2015. The most recent data collected according to WLTP show average CO2 emissions per km from new passenger cars were 116.3 g/km in 2021.
Replacing conventional cars with zero emission vehicles will be a crucial step towards achieving the EU’s greenhouse gas emission reduction targets, as set out in the European Climate Law and the EU’s 2030 Climate Target Plan, and towards climate neutrality by 2050. According to data from the European Alternative Fuels Observatory and statistics from Member States, the share of zero-emission vehicles (including both battery electric vehicles and hydrogen vehicles) in newly registered passenger cars in the EU rose from 0.5 % in 2016 to 9.4 % in 2021. Preliminary data for 2022 show further growth to about 12 %. However, the share differs considerably between European countries. Within the EU, the Netherlands reported the highest share with 19.8 % in 2021, followed by Sweden with 19.0 % and Austria with 13.9 %. In contrast, zero-emission vehicles accounted for less than 1 % of newly registered passenger cars in Bulgaria and Cyprus [10].
Green economy
Another way to help decouple environmental impacts from economic growth is to increase the share of the green economy. The environmental goods and services sector (EGSS) is the part of the economy that produces the goods and services used in environmental protection and resource management activities. Such goods and services can include, for example, products to prevent, measure, control, limit, minimise or correct environmental damage and resource depletion. Increasing the market share of green technologies in the EU can also have important socio-economic benefits in terms of value added and employment [11].
The increase in the value added of the environmental goods and services sector has outpaced overall economic growth
The gross value added in the EGSS in the EU has grown by 68.6 % over the 15-year period assessed, from EUR 178.0 billion in 2005 to EUR 300.1 billion in 2020. Growth in the renewable energy and energy efficiency sectors, along with increased spending on green infrastructure, are among the main drivers of this development [12]. In relation to the whole economy, the EGSS grew — in gross value added terms — from 1.7 % of GDP in 2005 to 2.5 % in 2020. This indicates the sector grew disproportionally faster than other economic sectors. Notably, the sector's gross value added continued to grow in 2020, by 1.9 %, when the EU’s GDP fell by 5.6 % as a result of the COVID-19 pandemic. Employment (in full-time equivalent) in the sector has also increased, by 47.5 %, since 2005. In 2020, the sector provided around 5 million full-time equivalent jobs throughout the EU [13].
Waste generation and management
Production and consumption patterns characterised by products being made, used and disposed of at an ever-faster rate are not sustainable. Therefore, the EU aims to move towards a circular economy where materials and resources are kept in the economy for as long as possible (through repair, recycling and reuse) and waste is minimised or even prevented. Because waste contains resources, recycling can put these materials back into the economy and ensure they are used again to preserve the value embedded within them.
Waste generation has fallen, but the EU is not on-track to meet its circular material use goal
In 2020, 2.2 billion tonnes of waste were generated in the EU by all economic activities and households, corresponding to 4 813 kilograms (kg) of waste per inhabitant. Almost two-thirds (64.0 % or 3.1 tonnes per inhabitant) of this waste was major mineral waste, including dredging spoils and contaminated soils that are mainly created in the mining and construction sectors. Of the total waste, 4.4 % was hazardous to health or the environment, corresponding to 214 kg per resident in 2020. Overall, the amount of waste generated in the EU fell by 4.7 % between 2016 and 2020, likely as a result of the pandemic-related economic slowdown in 2020.
Total waste excluding major mineral waste constituted one-third (36 %) or 775 million tonnes of total waste generated in the EU in 2020. From this amount, 212 million tonnes were recorded for waste and water services, followed by households (196 million tonnes) and manufacturing activities (167 million tonnes). In 2020, food waste accounted for 59 million tonnes in the EU. More than half (53.5 %) of food waste was generated by household activities, followed by manufacture of food products and beverages (20.2 %) and primary production of food (10.4 %) [14].
When not managed sustainably, all of this waste has a huge impact on the environment, causing pollution and greenhouse gas emissions, and significant losses of materials [15]. Recycling waste and feeding it back into the economy as secondary raw materials is crucial for reducing the EU’s demand for primary raw materials and relies heavily on improved waste management systems [16]. Between 2006 and 2021, the EU circular material use (CMU) rate — the share of used materials derived from collected waste — increased from 9.1 % to 11.7 %. Since 2019, however, the CMU rate has fallen by 0.3 percentage points, meaning the EU will need to make stronger progress in the next few years to meet its goal of 23.4 % of the materials it uses coming from collected waste by 2030.
Data for the recycling of waste excluding major mineral wastes show that 58 % of EU waste was recycled in 2020 [17]. The difference between this relatively high end-of-life recycling rate and the CMU rate (11.7 % in 2021) may seem surprising. However, the comparatively low degree of circularity in the EU can be attributed to two structural barriers. First, a large fraction of the materials extracted, in particular minerals, is used to build and maintain buildings, infrastructure and other long-life goods and is not readily available for recycling. The second barrier is the large amount of materials used to generate energy. For these materials, in particular for fossil fuels, closing the loop is hardly possible and the high share of these materials keeps the degree of circularity low [18].
Presentation of the main indicators
Material footprint

The material footprint, also referred to as raw material consumption (RMC), represents the global demand for the extraction of materials (minerals, metal ore, biomass, fossil energy materials) induced by consumption of goods and services within a geographical reference area. Data for material footprints stem from material flow accounts, which model the flows of natural resources from the environment into the economy. They include domestic extraction of materials measured in tonnes of gross material (for example, gross ore or gross harvest) as well as imports and exports measured by estimates of the raw material equivalents of the products traded (domestic and abroad extraction required to produce the traded products). RMC thus measures the amount of extraction needed to produce the goods demanded by final users in the geographical reference area, irrespective of where in the world the material extraction took place.
.png)
Source: Eurostat (online data codes: (sdg_12_21) and (env_ac_rme))
.png)
Source: Eurostat (sdg_12_21)
Consumption of hazardous chemicals

This indicator measures the consumption of toxic chemicals, expressed in million tonnes. The consumption of chemicals is calculated as the sum of the production volumes and the net import volumes of the chemicals according to the equation: consumption = production + imports – exports. The two sub-categories of hazardous chemicals — hazardous to human health and hazardous to the environment — overlap by definition and as a result their sum is not equal to the total consumption of hazardous chemicals.
.png)
Source: Eurostat (sdg_12_10)
Average CO2 emissions per km from new passenger cars

This indicator is defined as the average carbon dioxide (CO2) emissions per km from new passenger cars registered in a given year. The reported emissions are based on type-approval and can deviate from the actual CO2 emissions of new cars. Data presented in this section are provided by the European Commission, Directorate-General for Climate Action and the European Environment Agency (EEA). Data up to (and including) 2020 were collected according to the New European Driving Cycle (NEDC) procedure, while the data collection from 2021 onwards is based on the World Harmonised Light-vehicle Test Procedure (WLTP) procedure.
.png)
Source: EEA, European Commission services, Eurostat (sdg_12_30)
.png)
Source: EEA, European Commission services, Eurostat (sdg_12_30)
.png)
Source: Eurostat, EAFO (online data code: (road_eqr_zevpc))
Gross value added in the environmental goods and services sector

The environmental goods and services sector (EGSS) is defined as that part of a country’s economy that is engaged in producing the goods and services used in environmental protection and resource management activities either domestically or abroad. Gross value added in EGSS represents the contribution of the environmental goods and services sector to (GDP) and is defined as the difference between the value of the sector’s output and intermediate consumption.
.png)
Source: Eurostat (online data codes (sdg_12_61)
.png)
Source: Eurostat (sdg_12_61)
Circular material use rate

The circular material use rate (CMU) measures the share of material recovered and fed back into the economy in overall material use. The CMU is defined as the ratio of the circular use of materials to the overall material use. The overall material use is measured by summing up the aggregate domestic material consumption (DMC) and the circular use of materials. DMC is defined in economy-wide material flow accounts. The circular use of materials is approximated by the amount of waste recycled in domestic recovery plants minus imported waste destined for recovery plus exported waste destined for recovery abroad. A higher CMU rate value means more secondary materials are being substituted for primary raw materials, thus reducing the environmental impacts of extracting primary material.
.png)
Source: Eurostat (sdg_12_41)
.png)
Source: Eurostat (sdg_12_41)
Generation of waste

This indicator is defined as all waste generated in a country. It covers waste generated by industrial production (including the waste management sector itself) and by households.
.png)
Source: Eurostat (sdg_12_51)
.png)
Source: Eurostat (sdg_12_51)
Direct access to
More detailed information on EU SDG indicators for monitoring of progress towards the UN Sustainable Development Goals (SDGs), such as indicator relevance, definitions, methodological notes, background and potential linkages, can be found in the introduction of the publication ’Sustainable development in the European Union — Monitoring report on progress towards the SDGs in an EU context — 2023 edition’.
Further reading on responsible consumption and production
- EEA (2020), Bio-waste in Europe — turning challenges into opportunities, European Environment Agency, Copenhagen.
- EEA (2019), The European environment — state and outlook 2020. Chapter 9 – Waste and resources in a circular economy, European Environment Agency, Copenhagen.
- EEA (2019), Resource efficiency and the circular economy in Europe 2019 — even more from less, European Environment Agency, Copenhagen.
- EEA (2019), Paving the way for a circular economy: insights on status and potentials, EEA Report No 11/2019, European Environment Agency, Copenhagen.
- EEA (2019), Preventing Plastic Waste in Europe, EEA Report No 2/2019, European Environment Agency, Copenhagen.
- EEA (2023), Pathways to circular plastics in Europe: Good examples from countries, business and citizens.
- Circle Economy (2022), The Circularity Gap Report 2022, Circle Economy, Amsterdam.
- Sala, S., Crenna, E., Secchi, M., Sanyé-Mengual, E. (2020), Environmental sustainability of European production and consumption assessed against planetary boundaries, Journal of Environmental Management, 269, 110686.
- UNEP (2020), Resource Efficiency and Climate Change. Material Efficiency Strategies for a Low-Carbon Future, A report of the International Resource Panel, United Nations Environment Programme, Nairobi, Kenya.
- United Nations Environment Programme (2019), Global Chemicals Outlook II. From Legacies to Innovative Solutions: Implementing the 2030 Agenda for Sustainable Development.
- UNEP (2019), Global Resources Outlook: Natural Resources for the Future We Want, A Report of the International Resource Panel, United Nations Environment Programme, Nairobi, Kenya.
Further data sources on responsible consumption and production
- European Automobile Manufacturers Association, Interactive map: Affordability of electric cars, correlation between market uptake and GDP in the EU.
- European Commission, Raw Materials Information System (RMIS).
- Eurostat, Monitoring Framework for the Circular Economy.
- UNEP, Natural Resources: Resource Efficiency Indicators.
- UNEP/IRP, Global Material Flows Database.
Notes
- ↑ Sanye Mengual, E. and Sala, S. (2023), Consumption Footprint and Domestic Footprint: Assessing the environmental impacts of EU consumption and production, Luxembourg.
- ↑ Source: Eurostat (env_ac_mid)
- ↑ Source: Eurostat (online data code: (CEI_GSR020)). Copper does not meet the CRM threshold but is included on the CRM list as strategic raw material in line with the Critical Raw Materials Act.
- ↑ Resource productivity is defined as GDP per unit of domestic material consumption (DMC), measured in EUR per kilogram. Part of these materials is directly consumed by households, which means they are not used as an input to production activities. Thus, resource productivity is not directly comparable to concepts such as labour or capital productivity.
- ↑ Source: Eurostat (online data codes: (sdg_12_20) and (nama_10_gdp)).
- ↑ Energy productivity is defined as GDP per unit of gross inland energy consumption, measured in EUR per kg of oil equivalent. Part of the energy considered is consumed by households, which means it is not used as an input to production activities. Thus, energy productivity is not directly comparable to concepts such as labour or capital productivity. Note that the indicator's inverse is energy intensity.
- ↑ Source: Eurostat (online data codes: (nama_10_gdp) and (nrg_bal_s)).
- ↑ The European Chemical Industry Council (2023), CEFIC Facts and Figures 2023.
- ↑ European Environment Agency (2019), Consumption of hazardous chemicals.
- ↑ Source: Eurostat and European Alternative Fuels Observatory (online data code: (road_eqr_zevpc)).
- ↑ European Environment Agency (2019), Environmental Goods and Services Sector: employment and value added.
- ↑ Ibid.
- ↑ Source: Eurostat (env_ac_egss1).
- ↑ Source: Eurostat (online data codes (env_wasgen) and (env_wasfw)).
- ↑ European Commission (2010), Being wise with waste: the EU’s approach to waste management, Publication Office of the European Union, Luxembourg.
- ↑ European Commission (2021), Green growth: Raw materials.
- ↑ Source: Eurostat (env_wasoper)
- ↑ Haas, W., Krausmann, F., Wiedenhofer, D., Heinz, M. (2015), How Circular is the Global Economy?: An Assessment of Material Flows, Waste Production, and Recycling in the European Union and the World in 2005, Journal of Industrial Ecology, October 2015, Vol.19(5), 765-777.