SDG 1 - No poverty
End poverty in all its forms everywhere
Data extracted in April 2023.
Planned article update: June 2024.
Highlights

This article is a part of a set of statistical articles, which are based on the Eurostat publication ’Sustainable development in the European Union — Monitoring report on progress towards the SDGs in an EU context — 2023 edition’. This report is the seventh edition of Eurostat’s series of monitoring reports on sustainable development, which provide a quantitative assessment of progress of the EU towards the SDGs in an EU context.
SDG 1 calls for the eradication of poverty in all its manifestations. It envisions shared prosperity, a basic standard of living and social protection benefits for people everywhere, including the poorest and most vulnerable.
Full article
No poverty in the EU: overview and key trends
Poverty harms people’s lives and hampers social cohesion and economic growth. Monitoring SDG 1 in an EU context involves tracking aspects related to multidimensional poverty and basic needs. Over the assessed five-year period, the EU has made quite strong progress in all aspects of poverty monitored here. The share of the population affected by different forms of poverty, such as monetary poverty or material and social deprivation, has decreased. However, while the number of people at risk of poverty or social exclusion has fallen, stronger progress will be necessary to meet the 2030 target to lift at least 15 million people out of poverty or social exclusion, along with the complementary ambition that at least 5 million of these should be children. With regard to basic needs, significant progress has been made for all indicators, with fewer people now overburdened by housing costs, reporting an unmet need for medical care or living in an overcrowded household.
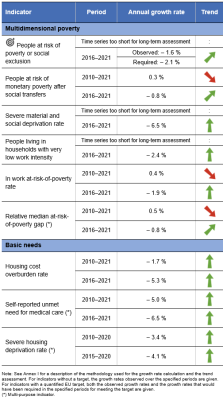
Table 1: Indicators measuring progress towards SDG 1, EU
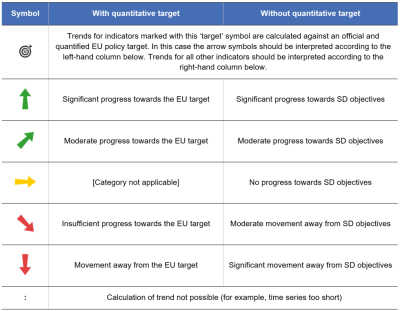
Table 2: Explanation of symbols for indicating progress towards SD objectives and targets


Multidimensional poverty
SDG 1 does not only call for the eradication of extreme poverty but also for poverty in all its dimensions to be halved by 2030. This global goal has a universal approach to reducing poverty. The EU also employs a multidimensional measure of poverty and in its European Pillar of Social Rights Action Plan has set the target to reduce the number of people at risk of poverty or social exclusion by at least 15 million by 2030 compared with the situation in 2019. A complementary ambition states that of these 15 million people, at least 5 million should be children.
The EU’s at-risk-of-poverty-or-social-exclusion (AROPE) indicator is based on three components: monetary poverty, severe material and social deprivation and very low work intensity. Through this multidimensional approach, the indicator shows which share of the population is at risk of exclusion and marginalisation from economic and social activities [1].
Stronger progress is necessary to meet the 2030 target to reduce the number of people at risk of poverty or social exclusion
In 2021, 95.4 million people, equalling 21.7 % of the EU population, were at risk of poverty or social exclusion. This represents a 7.9 % decrease since 2016, when 103.6 million people (or 23.7 % of the population) had been at risk. Nevertheless, the rate would need to fall more strongly in the next few years in order for the EU to meet its target of lifting at least 15 million people out of poverty or social exclusion by 2030. It is worth noting that the trends for many poverty-related indicators are affected by methodological changes in the data collection from 2020 onwards in a number of Member States, in particular Germany and France [2].
The number of children aged less than 18 who are at risk of poverty or social exclusion amounted to 19.6 million in 2021, corresponding to 24.4 % of the population of this age group. This is an 11.3 % decrease compared with five years earlier, when 22.1 million children (27.1 %) were at risk of poverty or social exclusion across the EU. However, in order to meet the complementary ambition of lifting at least 5 million children out of this situation by 2030, the pace of this development would need to speed up over the next years.
Monetary poverty is the main form of poverty or social exclusion in the EU
Monetary poverty was the most prevalent component of poverty or social exclusion in the EU in 2021, affecting 73.7 million people or 16.8 % of the population. This means that after social transfers (excluding pensions) these people had an equivalised disposable income of less than 60 % of the national median equivalised disposable income. The equivalised disposable income is the total income of a household — after tax and other deductions — that is available for spending or saving, divided by a specific scale which takes into account a household’s composition and size. Very low work intensity, referring to people living in (quasi-)jobless households where the adults worked equal to or less than 20 % of their total work-time potential during the past year, affected 29.3 million people (equalling 8.9 % of the population) aged less than 65 years in 2021. In the same year, 27.1 million people (6.3 % of the EU population) were affected by severe material and social deprivation, which meant they were unable to afford seven or more items out of a list of 13 elements of material goods, services or social activities considered by most people to be desirable or necessary for an adequate life.
The three components of the at-risk-of-poverty-or-social-exclusion indicator — monetary poverty, very low work intensity, and severe material and social deprivation — are related but distinct concepts that can overlap. This means that some people might be affected by two or even all three dimensions at the same time. According to its definition, monetary poverty is a relative measure and strongly depends on the median income level in a given country. This means that even during times of increasing median income, the relative poverty rate may remain stable or even increase, depending on changes in income distribution across the population. Rates of people living in households with very low work intensity (jobless or quasi-jobless households) and severe material and social deprivation (indicating a lack of resources to cover certain material and social needs) are likely to decrease during economic recoveries when people are generally better off financially and the labour market situation has improved. Of all of the 95.4 million people at risk of poverty or social exclusion in the EU in 2021, 28.7 million (30.1 %) were affected by more than one dimension of poverty, and 5.9 million (6.2 %) were affected by all three forms [3].
To reduce poverty, governments provide a wide range of measures, such as income support though various benefits (for example, unemployment benefits, sickness and invalidity benefits, and minimum income benefits), tax policies and provision of enabling, social and employment services. The impact of the transfers can be assessed by comparing the at-risk-of-poverty rate before and after social transfers, excluding pensions. In the EU, social transfers (excluding pensions) reduced the share of people at risk of monetary poverty in 2021 from 26.7 % [4] to 16.8 %, which corresponds to a reduction by 37.1 % [5].
Considerable differences in poverty rates exist within the EU
The multidimensional risk-of-poverty-or-social-exclusion rate differs considerably between Member States. In 2021, national rates for this indicator ranged from 10.7 % in Czechia to 34.5 % in Romania in 2021. While Czechia ranked among the best performing countries for all three components, other countries show striking differences in their situation in terms of monetary poverty, severe material and social deprivation, and very low work intensity, illustrating that good performance on one indicator does not necessarily go hand in hand with a similar performance on another one. Romania, for example, had the second highest share of monetary poverty after social transfers and the highest share of severely materially and socially deprived people in 2021, while at the same time its share of (quasi-)jobless households was the lowest across the EU. Hungary is another example with striking differences with regard to the three components. It was among the best third of countries for monetary poverty after social transfers and share of (quasi)jobless households, but had the fourth highest rate of severe material and social deprivation. These examples show that the drivers behind the Member States’ at-risk-of-poverty-or-social-exclusion rates can vary, depending on the national context.
Children and young people are particularly affected by poverty and social exclusion
Children and young people are generally more affected by the risk of poverty or social exclusion than other age groups. People aged 20 to 24 were most likely to be at risk in 2021, with 27.6 % of this age group living in households that were at risk of poverty or social exclusion. This figure is 5.9 percentage points higher than the rate for the total EU population (21.7 %). Children aged 0 to 17 were also more affected than the overall EU population, with 24.4 % living in households at risk of poverty or social exclusion. In line with the overall EU trend, the poverty or social exclusion rates for both groups have decreased since 2016 [6].
Children aged 0 to 17 show a similar pattern for the three poverty dimensions as the total population, with monetary poverty being the most prevalent form, followed by quasi-joblessness and material and social deprivation. In 2021, 19.5 % of children aged 0 to 17 were living in households affected by monetary poverty after social transfers, 8.3 % were living in (quasi-)jobless households, and 7.5 % were living in households affected by severe material and social deprivation [7].
Children’s risk of poverty or social exclusion is largely determined by the situation of their parents. Two major factors are education and household composition: parents with a lower level of education usually earn less. In 2021, 62.5 % of children aged 0 to 17 whose parents had at most lower secondary education were at risk of poverty or social exclusion. Very young children aged 0 to 5 were the most affected, with a rate of 67.0 %. Children with more highly educated parents fared significantly better. 28.5 % of children aged 0 to 17 and 29.8 % of children aged 0 to 5 whose parents had a mid-level education were at risk of poverty or social exclusion. The rates were 9.8 % for children aged 0 to 17 and 10.1 % for children aged 0 to 5 with highly educated parents [8]. Similarly, households of (mostly female) single parents with one or more dependent children had a much higher at-risk rate (44.1 % in 2021) than any other household type [9].
Poverty is more likely to affect people who are unemployed or have a migrant background, a low level of education or a disability
Identifying situations that can make people more vulnerable to being at risk of poverty and social exclusion is important for designing sound policies that prevent and fight poverty. Figure 4 shows which subgroups of people were most at risk of poverty or social exclusion in 2021. In addition to the case of children and young people discussed previously, other characteristics — such as unemployment, a migrant background, low education levels or disabilities — were also key risk factors. Not surprisingly, the group with the highest at-risk-of-poverty-or-social-exclusion rate were unemployed people, of which two-thirds (64.5 %) were in this situation. Nearly half (48.4 %) of non-EU citizens living in the EU were at risk of poverty and social exclusion, far more than EU home-country nationals (19.5 %). The situation was similar when looking at country of birth, with 41.0 % of adults born in non-EU countries being in that situation, compared with only 19.0 % of those born in the reporting EU countries. Moreover, more than one-third of people with severe disabilities (36.2 %) or low education levels (34.7 %) were at risk of poverty or social exclusion. People living in rural areas (22.5 %) were slightly more affected than those in urban areas (21.9 %). Women (22.6 %) were more affected than men (20.7 %)[10].
The poverty gap has widened in the past decade, but the situation has improved in recent years
The poverty gap measures the ‘depth’ of poverty and is defined as the distance between the median income of people at risk of poverty and the poverty threshold (set at 60 % of the national median equivalised disposable income after social transfers). In 2021, this gap amounted to 24.4 % in the EU, which means the median income of those below this poverty threshold was 24.4 % lower than the threshold itself. While this represents a 1.0 percentage point improvement compared with 2016, it is 1.3 percentage points above the level recorded in 2010, when the poverty gap amounted to 23.1 %
In-work poverty has increased in the past ten years, with a peak in 2016
Having a paid job does not necessarily prevent people from being at risk of poverty. The share of people at risk of monetary poverty among the employed, the so-called working poor, has grown slightly since 2010. In 2021, the in-work poverty rate was 8.9 %, which is an increase of 0.4 percentage points compared with 8.5 % in 2010. However, in 2016 the rate had reached a peak of 9.8 %, so the 2021 figure represents a 0.9 percentage point improvement in the in-work poverty rate over the final five years of this period. Rates varied considerably across the EU in 2021, with the lowest share of in-work-poverty recorded in Finland (2.8 %) and the highest in Romania (15.6 %) and Luxembourg (13.5 %). The likelihood of a person becoming a member of the ‘working poor’ varies according to their type of contract and education level. Low-skilled workers and people who work part-time or on temporary contracts are generally the most affected [11].
Basic needs
Being at risk of poverty can have a severe impact on a person’s ability to meet their basic needs such as being able to afford adequate housing or receive necessary medical treatment.
Fewer people are overburdened by their housing costs or face severe housing deprivation
The European Commission has declared access to affordable accommodation a fundamental need and right [12]. Meeting basic human needs is central to social sustainability and housing is a key dimension of need. The costs for housing often account for the largest component of many households’ expenditure and determine what is left of a household’s budget for satisfying other essential needs and expenses, such as education, medical treatment, food or energy. People suffering from poverty are far more often restricted to sub-optimal housing than the overall population.
Housing affordability can be analysed through the housing cost overburden rate, which is defined as the share of the population living in households where the total housing costs (net of housing allowances) represent more than 40 % of the total disposable household income. The EU’s housing cost overburden rate has been on a downward path since 2010, when 10.0 % of the population were affected, falling to 8.3 % in 2021. Low-income households are particularly prone to being overburdened by their housing costs. In 2021, 33.0 % of people with an income below the poverty threshold spent 40 % or more of their household disposable income on housing, compared with only 3.4 % of the not at-risk-of-poverty population (referring to people with an income above the poverty threshold) [13]. Similarly, persons with disabilities are more likely to be overburdened by housing costs. Data are only available for people aged 16 or over and show that in 2021, 9.1 % of persons with severe and 8.7 % of persons with some disability (activity limitation) were in this situation, compared with 6.9 % of people with no disability (activity limitation) [14].
The severe housing deprivation rate is an indicator of inadequate housing, referring to people living in an overcrowded household [15] that also faces housing deprivation defined by poor amenities such as a leaking roof, lacking sanitation facilities (bath, shower, indoor flushing toilet) or a dwelling considered to be too dark. In 2020, 4.3 % of the EU population faced severe housing deprivation, a 1.0 percentage point improvement compared with 2015. Among people living in monetary poverty, 10.2 % were affected by this situation in 2020, compared with only 3.2 % of the richer population [16].
An analysis by degree of urbanisation reveals that city dwellers in particular are more likely to be overburdened by their housing costs. In 2020, 9.9 % of people living in cities spent 40 % or more of their household disposable income on housing, compared with only 7.0 % for towns and suburbs and 5.8 % for rural areas. Severe housing deprivation was slightly more common in rural areas with 4.9 % than in cities with 4.8 % in 2020; in towns and suburbs the rate was 3.4 % in that year [17].
People who self-report unmet needs for medical care most commonly cite costs as the reason
Access to health care services is important for ensuring a high quality of life. In turn, this may contribute to increased productivity and reduced costs associated with social protection systems. Barriers to accessing health services include costs, distance and waiting time. In 2021, 2.0 % of the EU population aged 16 and above reported unmet needs for medical care. While the situation has improved by 0.8 percentage points compared with 2016, the rate has increased in the last four years. Cost was the main reason given for limited access to health care services, indicated by 1.0 % of the EU population in 2021. People with lower incomes face a much higher share of unmet needs for medical care. While only 0.2 % of the richest 20 % of the population reported unmet care needs due to financial constraints, 2.2 % of people in the poorest quintile reported that this was the case [18].
Presentation of the main indicators
People at risk of poverty or social exclusion

While a household's income is a key determinant of its standard of living, other aspects can prevent people from fully participating in society such as an impeded access to labour markets or material and social deprivation. To reflect these different dimensions of poverty or social exclusion, the indicator ‘at risk of poverty or social exclusion’ measures the number of people affected by at least one of the following three forms of poverty or social exclusion: monetary poverty, severe material and social deprivation and very low work intensity. Data on the three components are derived from the EU Statistics on Income and Living Conditions (EU-SILC).
.png)
Source: Eurostat (sdg_01_10)
.png)
Source: Eurostat (sdg_01_10)
.png)
Source: Eurostat (ilc_pees01n)
.png)
Source: Eurostat: (ilc_pees01n), (ilc_peps02n), (ilc_peps03n), (ilc_peps04n), (ilc_peps05n), (ilc_peps06n), (ilc_peps13n), (ilc_peps60n) and (hlth_dpe010)
People at risk of monetary poverty after social transfers

This indicator measures the number of people with an equivalised disposable income below the risk-of-poverty threshold. This is set at 60 % of the national median equivalised disposable income after social transfers [19]. The data stem from the EU Statistics on Income and Living Conditions (EU-SILC).
.png)
Source: Eurostat (sdg_01_20)
.png)
Source: Eurostat (sdg_01_20)
Severe material and social deprivation rate

The indicator shows an involuntary lack of necessary and desirable items to lead an adequate life. It is defined as the proportion of the population who cannot afford at least 7 of the following 13 deprivation items: (1) pay rent, utility bills, hire purchase instalments or other loan payments, (2) keep their home adequately warm, (3) face unexpected expenses, (4) eat meat, chicken, fish or vegetarian equivalent every second day, (5) a week of holiday away from home, (6) have access to a car/van for personal use, (7) replace worn-out furniture, (8) replace worn-out clothes with some new ones, (9) have two pairs of properly fitting shoes, (10) spend a small amount of money each week on themselves (‘pocket money’), (11) have regular leisure activities, (12) get together with friends/family for a drink/meal at least once a month, and (13) have an internet connection. Items 1 to 7 relate to the household level, while the remaining items 8 to 13 relate to the level of the individual. Data for this indicator stem from the EU Statistics on Income and Living Conditions (EU-SILC).
.png)
Source: Eurostat (sdg_01_31)
.png)
Source: Eurostat (sdg_01_31)
People living in households with very low work intensity

This indicator describes the share of people aged less than 65 living in households where the working age adults aged 18 to 64 worked equal or less than 20 % of their total combined potential work-time during the previous year. It excludes students aged 18 to 24 and people who are retired according to their self-defined current economic status or who receive any pension (except survivors pension), as well as people aged 60 to 64 who are inactive and live in a household where the main income comes from pensions (except survivors' pension). The EU Statistics on Income and Living Conditions (EU-SILC) is the data source for this indicator.
.png)
Source: Eurostat (sdg_01_40)
.png)
Source: Eurostat (sdg_01_40)
In work at-risk-of-poverty rate

This indicator refers to the share of people aged 18 years or over who declare to be at work (employed or self-employed) and who are at risk of monetary poverty. People are considered ‘employed’ if they held a job for more than half of the reference year. Data for this indicator are taken from the EU Statistics on Income and Living Conditions (EU-SILC).
.png)
Source: Eurostat (sdg_01_41)
.png)
Source: Eurostat (sdg_01_41)
Housing cost overburden rate

The indicator reflects the share of the population living in households where the total housing costs ('net' of housing allowances) represent more than 40 % of the disposable income. This indicator is derived from the EU Statistics on Income and Living Conditions (EU-SILC).
.png)
Source: Eurostat (sdg_01_50)
.png)
Source: Eurostat (sdg_01_50)
Direct access to
More detailed information on EU SDG indicators for monitoring of progress towards the UN Sustainable Development Goals (SDGs), such as indicator relevance, definitions, methodological notes, background and potential linkages, can be found in the introduction of the publication ’Sustainable development in the European Union — Monitoring report on progress towards the SDGs in an EU context — 2023 edition’.
Further reading on poverty
- European Commission (2022), Employment and Social Developments in Europe Annual Review 2022, Publications Office of the European Union, Luxembourg.
- European Commission (2023), Joint Employment Report 2023, Directorate-General for Employment, Social Affairs and Inclusion, Brussels.
- European Commission (2017), European Semester Thematic Factsheet, Social Inclusion.
- European Parliament (2023), Factsheet, The fight against poverty, social exclusion and discrimination.
- European Union (2022), Social Protection Committee Annual Report 2022, Publications Office of the European Union, Luxembourg.
- European Union (2021), Improving the understanding of poverty and social exclusion in Europe – 2021 edition, Publications Office of the European Union, Luxembourg.
- United Nation (2022), The Sustainable Development Goals Report 2022, United Nations Publications, New York.
Further data sources on no poverty
Notes
- ↑ In 2021, the AROPE indicator was modified and the new EU 2030 target was based on the revised definition. The ‘severe material deprivation’ indicator was replaced with the ‘severe material and social deprivation’ indicator also considering social aspects such as leisure activities and social relationships in addition to the material aspects of deprivation. In addition, the definition of ‘very low work intensity’ — referring to people living in (quasi-)jobless households — was adjusted, including extending the monitored age group from 0–59 to 0–64 years. As a consequence, the two components and thus the whole AROPE indicator presented in this report have indicator values from 2015 only and are not comparable with the data in reports before 2022.
- ↑ The change in data collection methods in several countries, in particular Germany and France, between 2019 and 2020 affected also the EU total but not the direction of change from 2020 to 2021.
- ↑ The year of reference differs for the three components. Data for the risk of poverty after social transfers and for whether or not someone lives in a household with very low work intensity are based on data from the previous year. The extent to which an individual is severely materially deprived is determined based on information from the year of the survey.
- ↑ Source: Eurostat (online data code: (ilc_li10)).
- ↑ Source: Eurostat (online data code: (TESPM050)).
- ↑ Source: Eurostat (online data code: (ilc_peps01)).
- ↑ Source: Eurostat (online data codes: (tepsr_spi110), (tepsr_spi120) and (tepsr_spi130)).
- ↑ Source: Eurostat (online data code: (ilc_peps01)).
- ↑ Source: Eurostat (online data code: (ilc_peps03n)).
- ↑ Source: Eurostat (online data codes: (ilc_peps02n), (ilc_peps04n), (ilc_peps05n), (ilc_peps06n), (ilc_peps13n) and (ilc_peps01n)). Further information on vulnerable groups particularly at risk of poverty or social exclusion can be found under the category Poverty and social exclusion on Eurostat's Statistics Explained pages.
- ↑ European Commission (2023), Joint Employment Report 2023, Directorate-General for Employment, Social Affairs and Inclusion, Brussels.
- ↑ European Commission (2010), The European Platform against Poverty and Social Exclusion: A European framework for social and territorial cohesion, COM(2010) 0758 final.
- ↑ Source: Eurostat (online data code: (ilc_lvho07a)).
- ↑ Source: Eurostat (online data code: (hlth_dhc060)).
- ↑ A household is considered overcrowded if it does not have at least one room for the entire household as well as a room for a couple, for each single person above 18, for a pair of teenagers (12 to 17 years of age) of the same sex, for each teenager of different sex and for a pair of children (under 12 years of age).
- ↑ Source: Eurostat (online data code: (ilc_mdho06a)).
- ↑ Source: Eurostat (online data codes: (ilc_lvho07d) and (ilc_mdho06d)).
- ↑ Source: Eurostat (online data code: (hlth_silc_08)).
- ↑ The equivalised disposable income is the total income of a household, after tax and other deductions, that is available for spending or saving, divided by the number of household members converted into equalised adults; household members are equalised or made equivalent by weighting each according to their age, using the so-called modified OECD equivalence scale.