Land cover statistics
Data extracted in May 2021.
Planned article update: January 2025.
Highlights
Landscapes across the European Union (EU) range from sub-Arctic tundra environments in the far north to semi-arid conditions in some Mediterranean regions in the south, or from the lowlands and plains of northern continental Europe to relatively high mountain chains such as the Alps, Pyrenees or Carpathians.
Wooded areas have very different structural features in northern and southern countries. In the north, there tend to be larger forests of tall trees in dense stands, with little vegetation in the understory (plants growing beneath the forest canopy). In the south, trees are generally not so tall and tend to be less densely set, leading to a better-developed canopy on each tree, but a lower total forest canopy cover and denser vegetation in the understory.
One of the underlying characteristics of European landscapes is the rapid changes that occur when moving within relatively small areas. This article analyses the latest statistics that are available on land cover in the EU, in other words, the bio-physical coverage of land (for example, by crops, grass, forest, buildings and roads or lakes).
Full article
Land cover in the EU
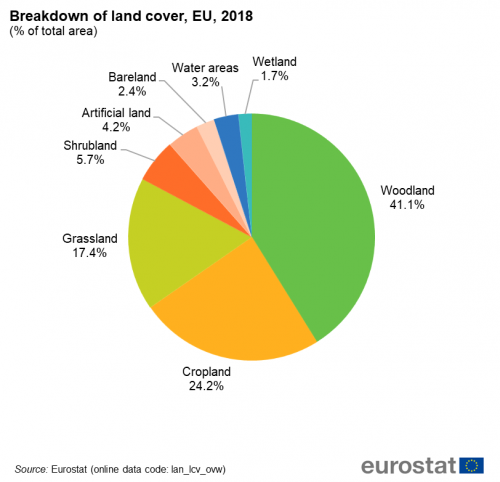
The total area of the EU was just over 4.1 million square kilometers (km²) in 2018. Woodland covered by far the largest proportion — some 41.1 % (see Figure 1). Almost one fourth (24.2 %) of the EU area was covered by cropland, while below one fifth (17.4 %) was covered by grassland. The remaining shares were relatively low: shrubland covered 5.7 % of the total, followed by artificial areas (4.2 %) and bareland (2.4 %), while the least common forms of cover were water areas (3.2 %) and wetland (1.7 %).
Land cover in the EU Member States
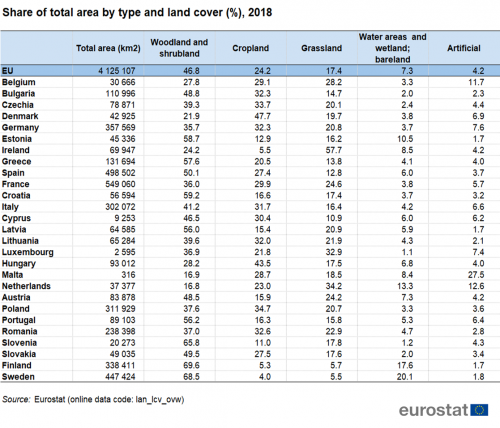
Table 1 presents the latest information available relating to land cover across the EU Member States in 2018.
Large forest areas are a typical landscape feature in northern Europe, particularly in the far north, as well as in many mountainous regions. In 2018, the share of woodland and shrubland was above 60.0 % of the total area of Slovenia and was just below 70.0 % in Finland and Sweden. At the other end of the scale, there were six EU Member States where less than 30 % of the land was covered by woodland and shrubland; four of those— Denmark, Ireland, Hungary, and Belgium — had shares of woodland and shrubland of between 20.0 % and 30.0 %, while the lowest proportions were recorded in Malta (16.9 %) and the Netherlands (16.8 %).
The term ‘crop’ within cropland covers a very broad range of cultivated plants. The variety of crops grown across the EU reflects their heritable traits as well as plant breeders’ abilities to harness those traits to best respond to the myriad of topographic and climatic conditions, pests and diseases. Most of the EU regions with relatively high shares of cropland are characterised by fertile lands and a long tradition of agriculture. Denmark (47.7 %) and Hungary (43.5 %) had the highest proportions of their area covered by cropland in 2018. For the vast majority of the EU Member States, cropland accounted for between 15.0 % and 35.0 % of the total area, this share falling to 10.0 % – 15.0 % in Estonia and Slovenia, while the lowest proportions were registered in Finland (5.3 %), Ireland (5.5 %) and Sweden (4.0 %). In absolute terms, France, Germany, Spain and Poland had the largest areas of cropland in 2018.
Grasslands tend to be concentrated in regions with less favorable conditions for growing crops or where forests have been cut down. Areas with a relatively low share of grassland are often located in regions that are characterised by harsh (as opposed to temperate) climatic conditions. Some of these are found in northern Europe (for example, most of Finland and Sweden), while others are in the far south (where the climate is too arid for natural grassland, for example, the south of Spain). Ireland remained the only EU Member State with more than half of its land area as grassland in 2018 (57.7 %) of the total area. By contrast, grassland covered less than 6.0 % of the land in Finland and Sweden.
Land covered by water, wetland and bareland accounted for a relatively low proportion of total land cover in most of the EU Member States in 2018. The only countries that recorded shares in excess of 10.0 % were Sweden (20.1 %), Finland (17.6 %), the Netherlands(13.3 %) and Estonia (10.5 %). The vast majority of the water cover in the Netherlands has resulted from the construction of man-made dikes which have created inland waterways and inland lakes — for example, the Ijsselmeer and Markermeer. In contrast, there are almost 300 000 natural lakes that are spread across Finland and Sweden, the vast majority of which resulted from glacial retreat.
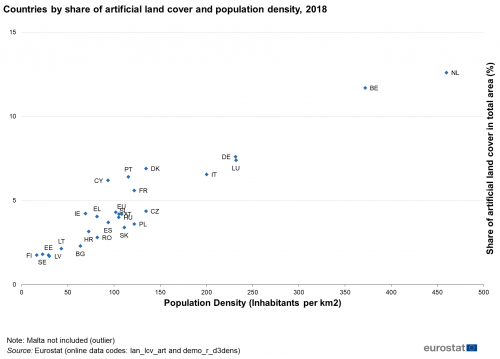
Artificial land cover is used for settlements, production systems and infrastructure. Land is a finite resource and increasing demand for more living space, ever-expanding levels of economic activity, and increased mobility, have in some cases resulted in the depletion of natural resources and the degradation of the environment. The highest proportion of artificial land cover is unsurprisingly found in the most densely populated countries: Malta, the Netherlands and Belgium. Almost one quarter (27.5 %) of Malta was classified as artificial land cover in 2018, well ahead of the Netherlands (12.6 %) and Belgium (11.7 %). At the other end of the scale, artificial land cover accounted for less than 3.0 % of the total area in Romania, Bulgaria, the Baltic Member States, Finland and Sweden.
Focus on artificial land cover
One of the main developments across the EU in recent years has been the expansion in artificial land cover. This section looks in more detail at artificial land cover, which may itself be split between built-up areas (buildings) and non-built-up areas (such as linear transport networks and associated areas).
Artificial land covered 4.2 % of the total area of the EU in 2018. Artificial areas dominate the landscapes of cities and towns and hence those countries with the highest population density tend to record a relatively high share of their land as artificial. This was particularly true in the Benelux Member States and Germany — see Figure 2.

In contrast, the extremities of the EU, such as northern Finland and Sweden had very low shares of their total area covered by artificial land cover in 2018; this pattern was also seen across most of the Baltic Member States and many of the central and eastern European countries that joined the EU in 2004 or 2007, where areas are often characterised as being predominantly rural and sparsely populated.
Malta was the only EU Member State that had a higher proportion of land covered by built-up artificial areas (17.9 %) than it did by non-built-up artificial areas (9.6 %), reflecting, at least in part, its relatively high population density. Non-built-up artificial areas in Latvia, Estonia, Cyprus, Ireland, Sweden and Finland accounted for at least three times the size of built-up areas — see Figure 3.
Source data for tables and graphs
Data sources
LUCAS — Land Use and Cover Area frame Survey — aims to gather harmonised data on land use/cover through direct observations by land surveyors on the ground. LUCAS data also provides territorial information facilitating the analysis of the interaction between agriculture and the environment and may be used as a vehicle for other data collection exercises (for example, in 2009, 2015 and 2018 soil samples were taken from approximately 10 % of the points visited).
The latest LUCAS data collection was carried out in 2018 for all EU Member States. Data on land cover and land use were collected for approximately 238 000 field points between March and October 2018, and for 100 000 photo-interpreted points; these points were selected from a standard 2 km grid covering a total of more than one million points all over the EU. The previous LUCAS data collection was conducted in 2015. The land cover and the visible land use data were classified according to the harmonised LUCAS land cover and land use classificationwhile information was also collected on irrigation management and structural elements in the landscape. Furthermore, at 1 in 10 of the selected field points a topsoil sample was taken to help assess environmental factors, update soil maps, validate soil models and measure the quantity of organic carbon in the soil. The next LUCAS survey will be held in 2022.
More detailed background information on the LUCAS survey can be found in this article.
Context
Historically, there has been a shift in land use across the EU which may be broadly characterised in terms of: a decline in agricultural land use; an increase in soil erosion and soil degradation; an increase in (sub)urban sprawl arising from demographic and economic growth; and the continued development of infrastructure (such as new roads, railways and other manifestations of economic development) — the latter often result in increasingly fragmented habitats, potentially impacting upon local ecosystems and biodiversity.
The onset of the industrial revolution in Europe led to a lengthy period during which forested areas were cleared (deforestation). Nevertheless, this pattern has been reversed during the last couple of decades, in part as a result of international climate change commitments made by the EU and its Member States — and as a result the EU is currently one of the few regions in the world where forest cover is actually increasing.
Most changes to landscapes are not visible on a day-to-day basis and the natural features that form landscapes (for example, valleys, plateaus and plains) are, by and large, the result of geographical processes that have taken place over a very long period of time. Alongside these natural processes, human intervention has increasingly left an imprint on the environments in which we live and work. Land has become a natural and economic resource used for multiple purposes: agriculture and forestry; mining, manufacturing and construction; distributive trades, transport and other services, as well as for residential and leisure use. Land is also an integral part of ecosystems and indispensable for biodiversity and the carbon cycle. As such, harmonised and reliable statistics on land cover provide a crucial source of information for monitoring a wide range of policy areas.
Direct access to
- Land cover (lan_lcv)
- Land cover overview (lan_lcv_ovw)
- Land covered by artificial (lan_lcv_art)
- Diversified landscape structure in the EU Member States (Statistics in Focus — Issue 24/2011)
- Regional yearbook — Chapter 12 (Statistical book)


