Trade in agricultural goods down 3.2% in 2023

In 2023, the value of trade (imports and exports) of agricultural products between the EU and the rest of the world reached €410.9 billion, €13.5 billion less than in 2022 (€424.4 billion), corresponding to a decrease of 3.2%.
The EU exported €228.6 billion worth of agricultural products and imported €182.3 billion, generating a surplus of €46.3 billion. While the value of exports between 2022 and 2023 remained stable, there was a noticeable decrease in the value of imports (-6.8%).
Between 2013 and 2023, EU trade in agricultural products increased by 56.2% (from €263.1 billion to €410.9 billion), equivalent to an average annual growth of 4.6%. In this period, exports grew faster (4.7%) than imports (4.4%).
Source dataset: ds-045409
UK and Brazil: biggest export and import partners
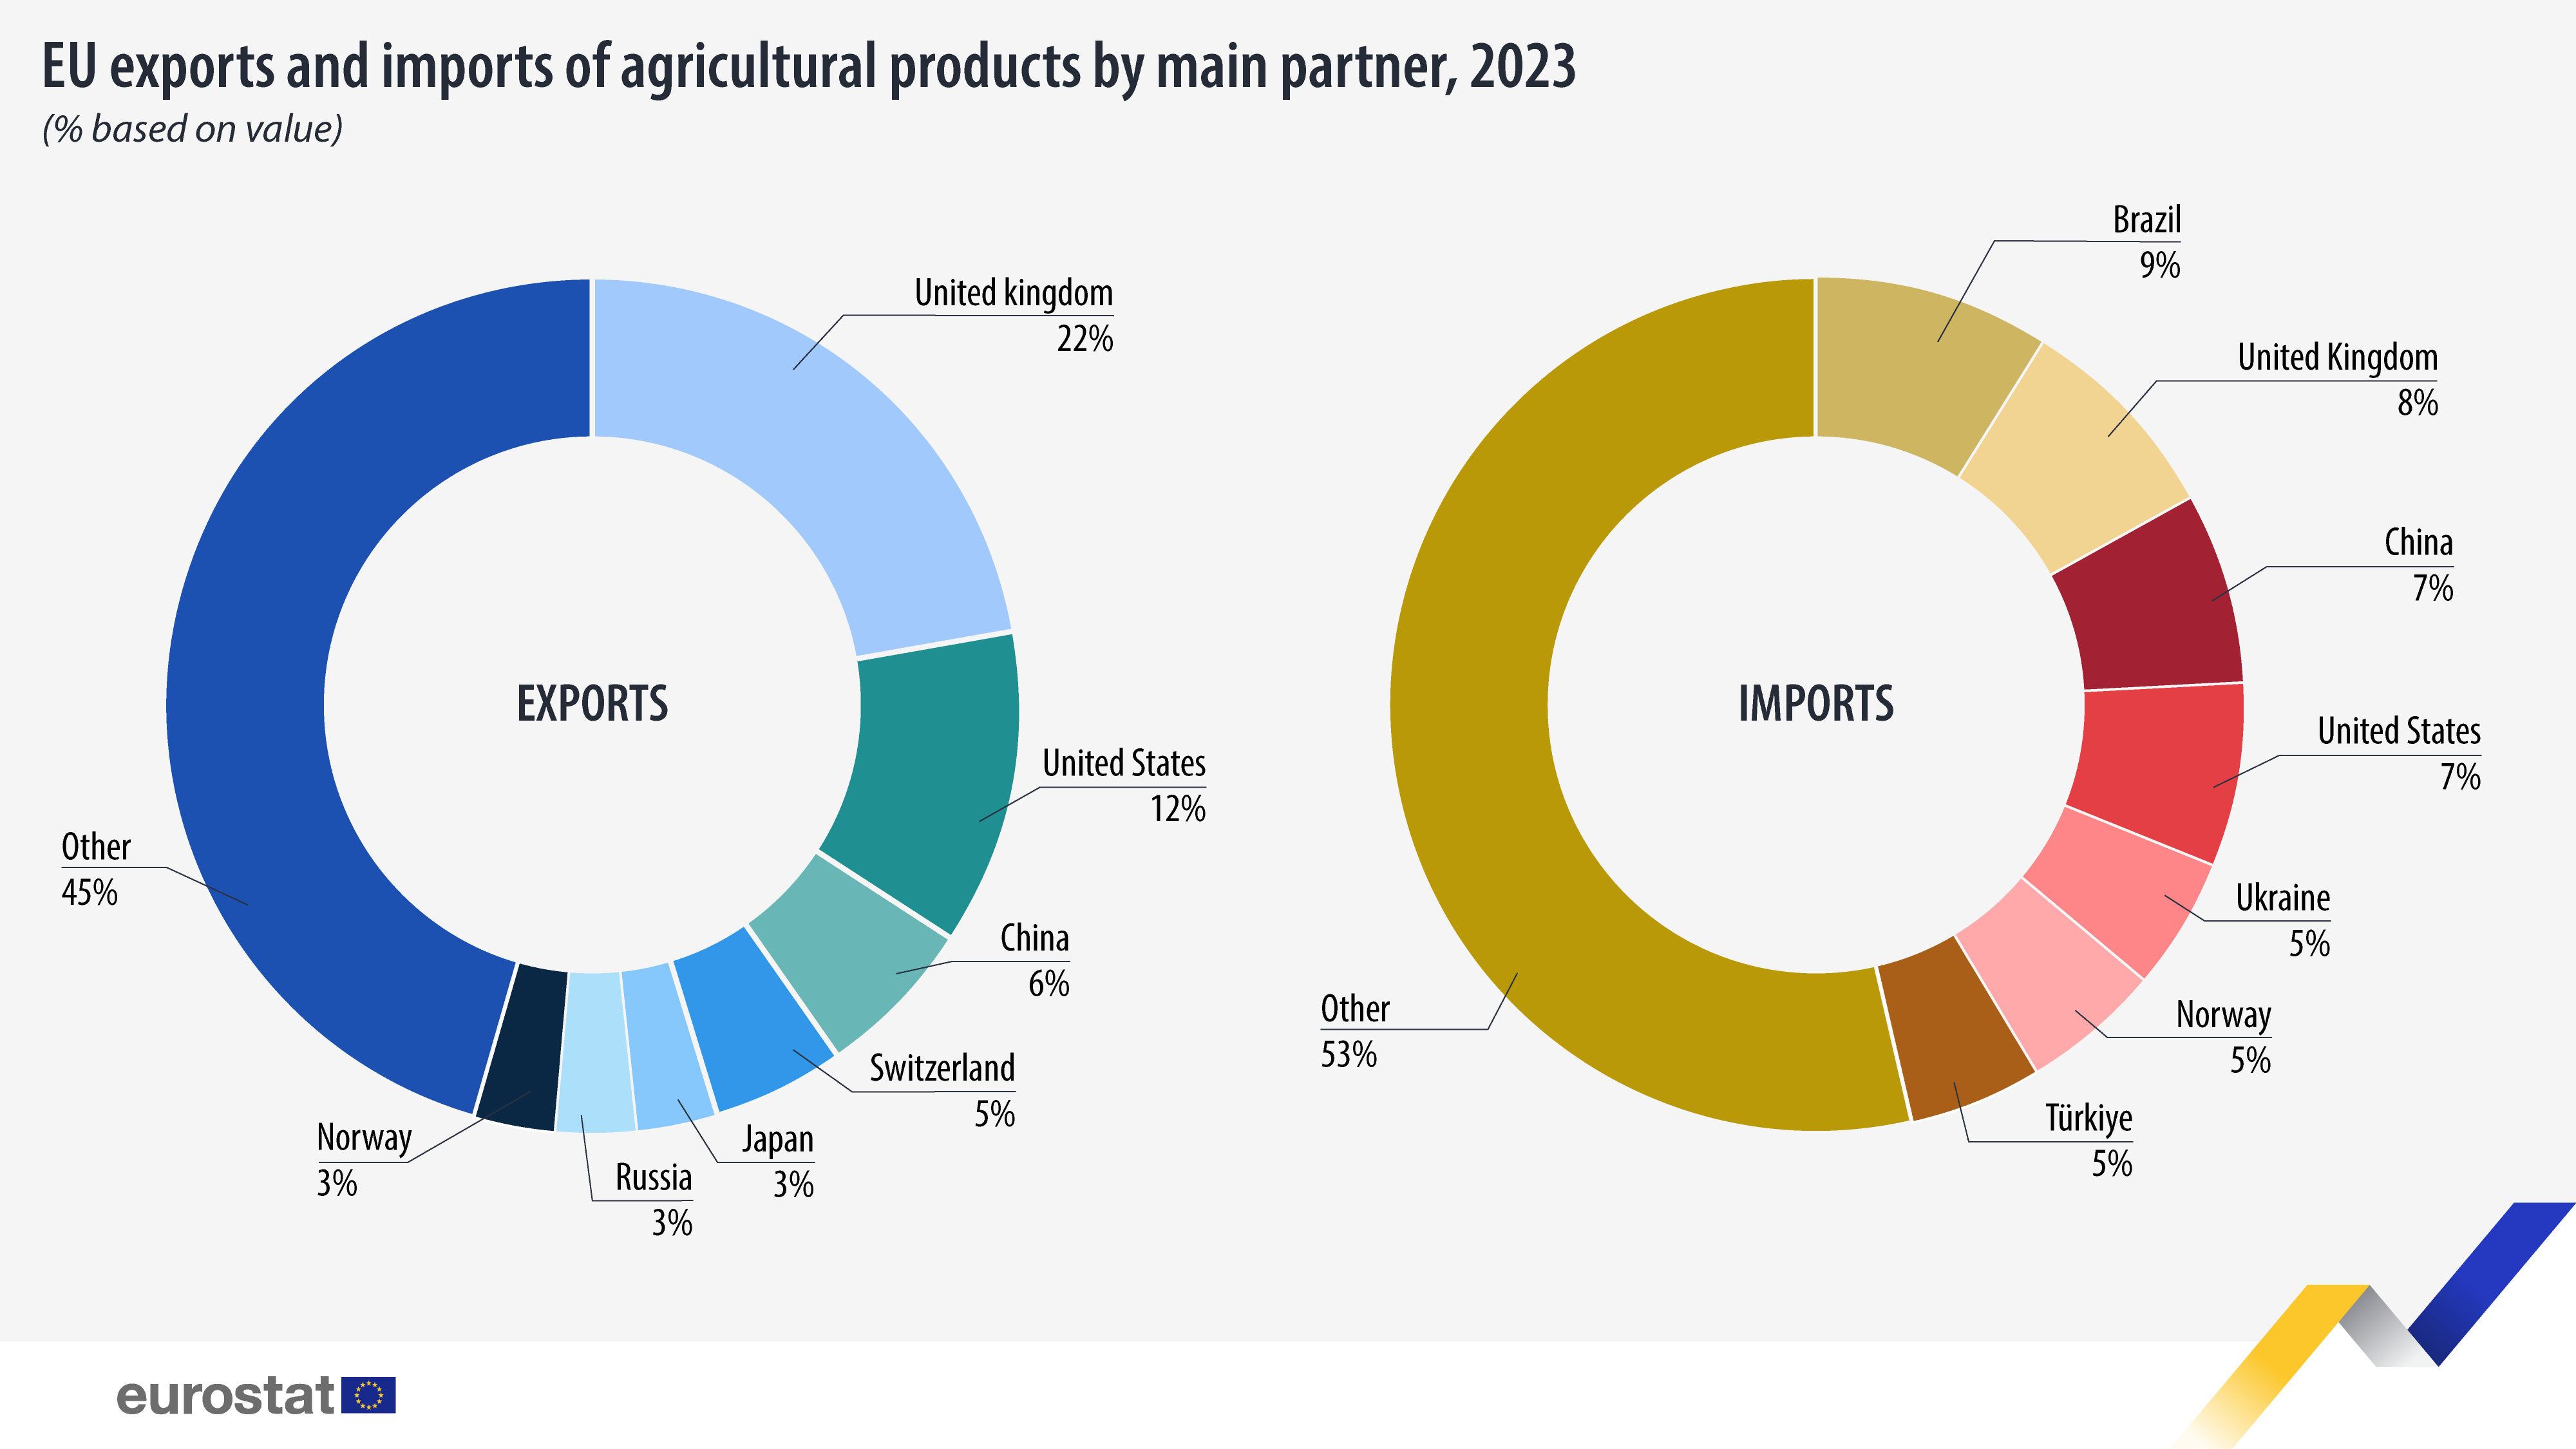
In terms of export partners, the United Kingdom was the main partner with a 22% share in EU exports of agricultural products (equivalent to €48.6 billion), followed by the United States (12%; €27.5 billion), China (6%; €13.5 billion), Switzerland (5%; €12.1 billion), Japan (3%; €7.2 billion) and Russia (3%; €6.6 billion).
EU imports originated mostly from Brazil (9%; €16.9 billion), the United Kingdom (8%; €15.8 billion), China (7%; €13.3 billion), the United States (7%; €13.1 billion), Ukraine (5%; €9.5 billion) and Norway (5%; €9.2 billion).
Source dataset: ds-045409
For more information
- Statistics Explained article on extra-EU trade in agricultural goods
- Thematic section on international trade of goods
- Database on international trade of goods
Methodological notes
- In this news article, agricultural products relate to four major groups: animal products (World Customs Organization Harmonized System (HS) chapters 1-5), vegetable products (HS chapters 6-14), animal or vegetable oils, fats and related products (HS chapter 15) and foodstuffs (HS chapters 16-24).
- As of January 2021 onwards, data on trade with the United Kingdom is based on a mixed concept. In application of the Withdrawal Agreement Protocol on Ireland/Northern Ireland, for trade with Northern Ireland the statistical concepts applicable are the same as those for trade between Member States while for trade with the United Kingdom (excluding Northern Ireland) the same statistical concepts are applicable as for trade with any other extra-EU partner country. For these reasons, data on trade with the United Kingdom are not fully comparable with data on trade with other extra-EU trade partners, and for reference periods before and after the end of 2020.
If you have any queries, please visit our contact us page.


