Over 30 million jobs in 2021 thanks to extra-EU exports

In 2021, the employment of 30.4 million persons in the EU was supported by exports to non-EU countries, a slight increase from 29.9 million in 2020 (+1.7%).
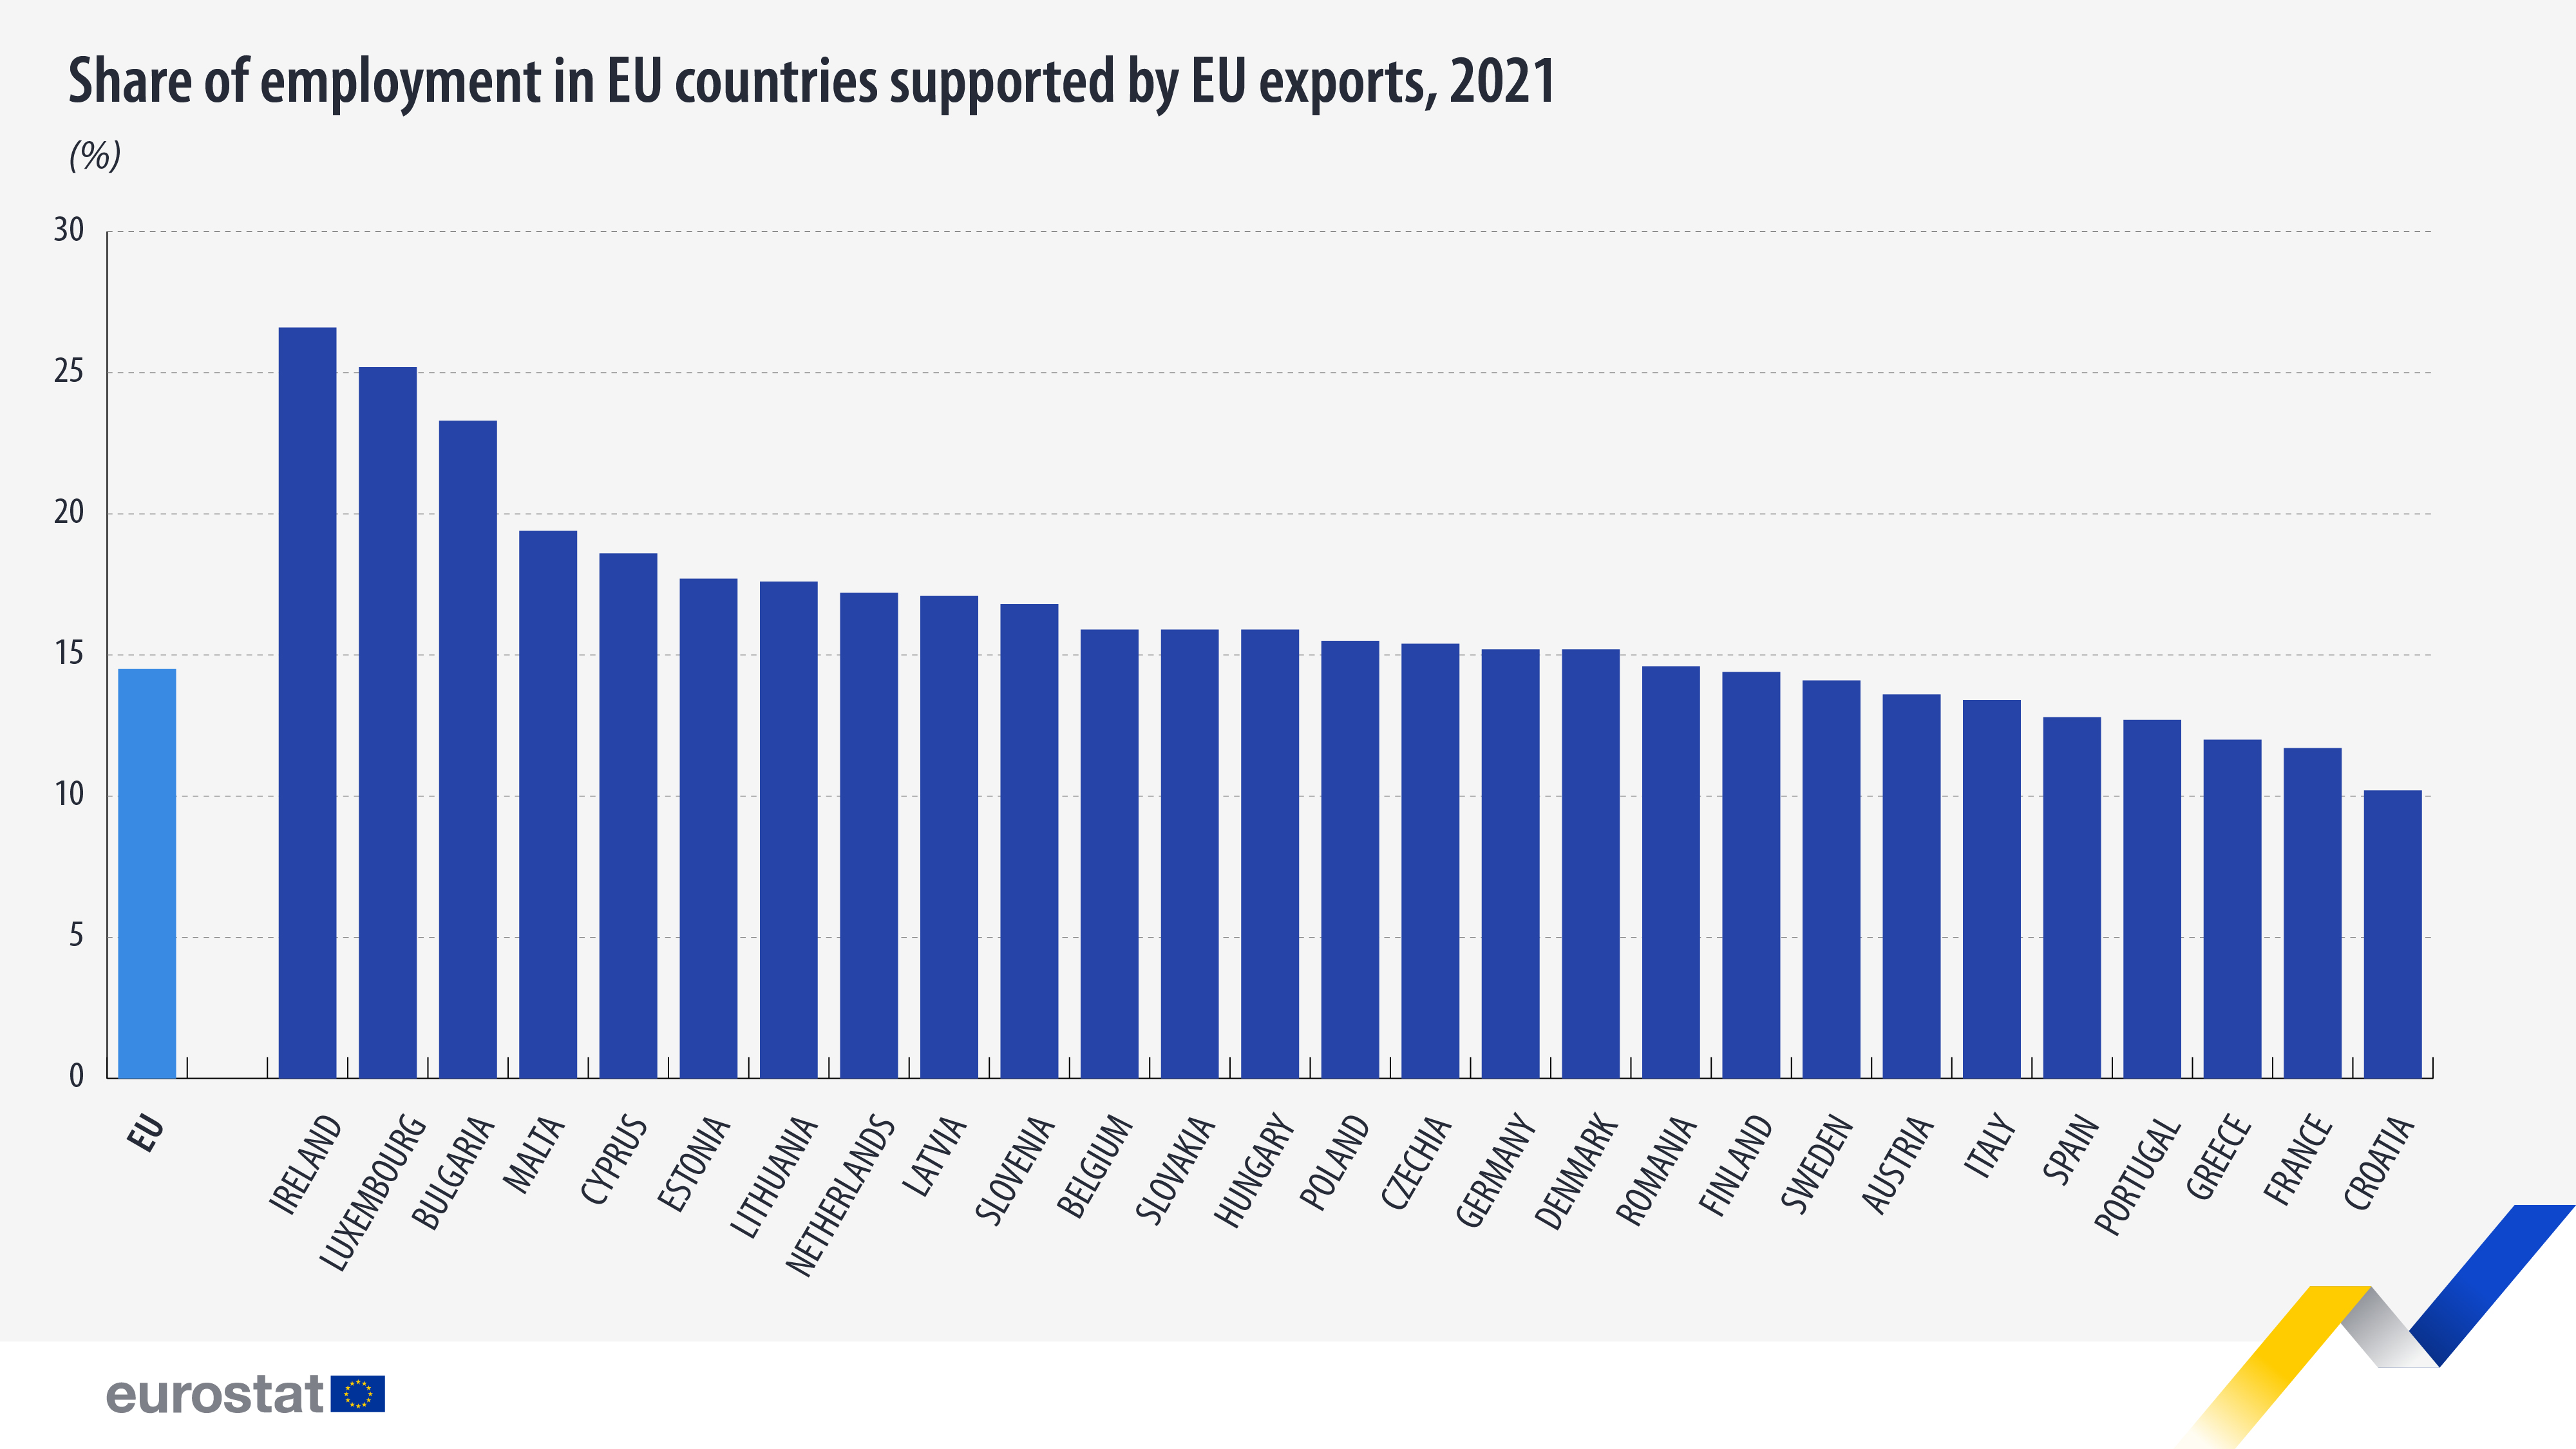
In relative terms, export-supported employment represented 15% of total employment in the EU (210 million), equivalent to just over 1 in 7 people employed within the EU.
Germany was the EU country with the highest absolute level of employment supported by EU exports. In 2021, the employment of 6.9 million people in Germany was supported by exports from the EU, including from Germany itself. France and Italy (both 3.4 million people) had the following highest levels of export-supported employment.
However, in relative terms, the highest share of employment supported by exports to non-EU countries was recorded in Ireland (27%), followed by Luxembourg (25%) and Bulgaria (23%).
These results were compiled using the FIGARO tables (Full International and Global Accounts for Research in input-Output analysis), whose update for the time series 2010-2021 has also been published today.
Source dataset: naio_10_faex
Croatia (10%), along with France and Greece (both 12%), recorded the lowest share of employment supported by EU exports in 2021.
Value added of extra-EU exports up to €2.226 billion in 2021
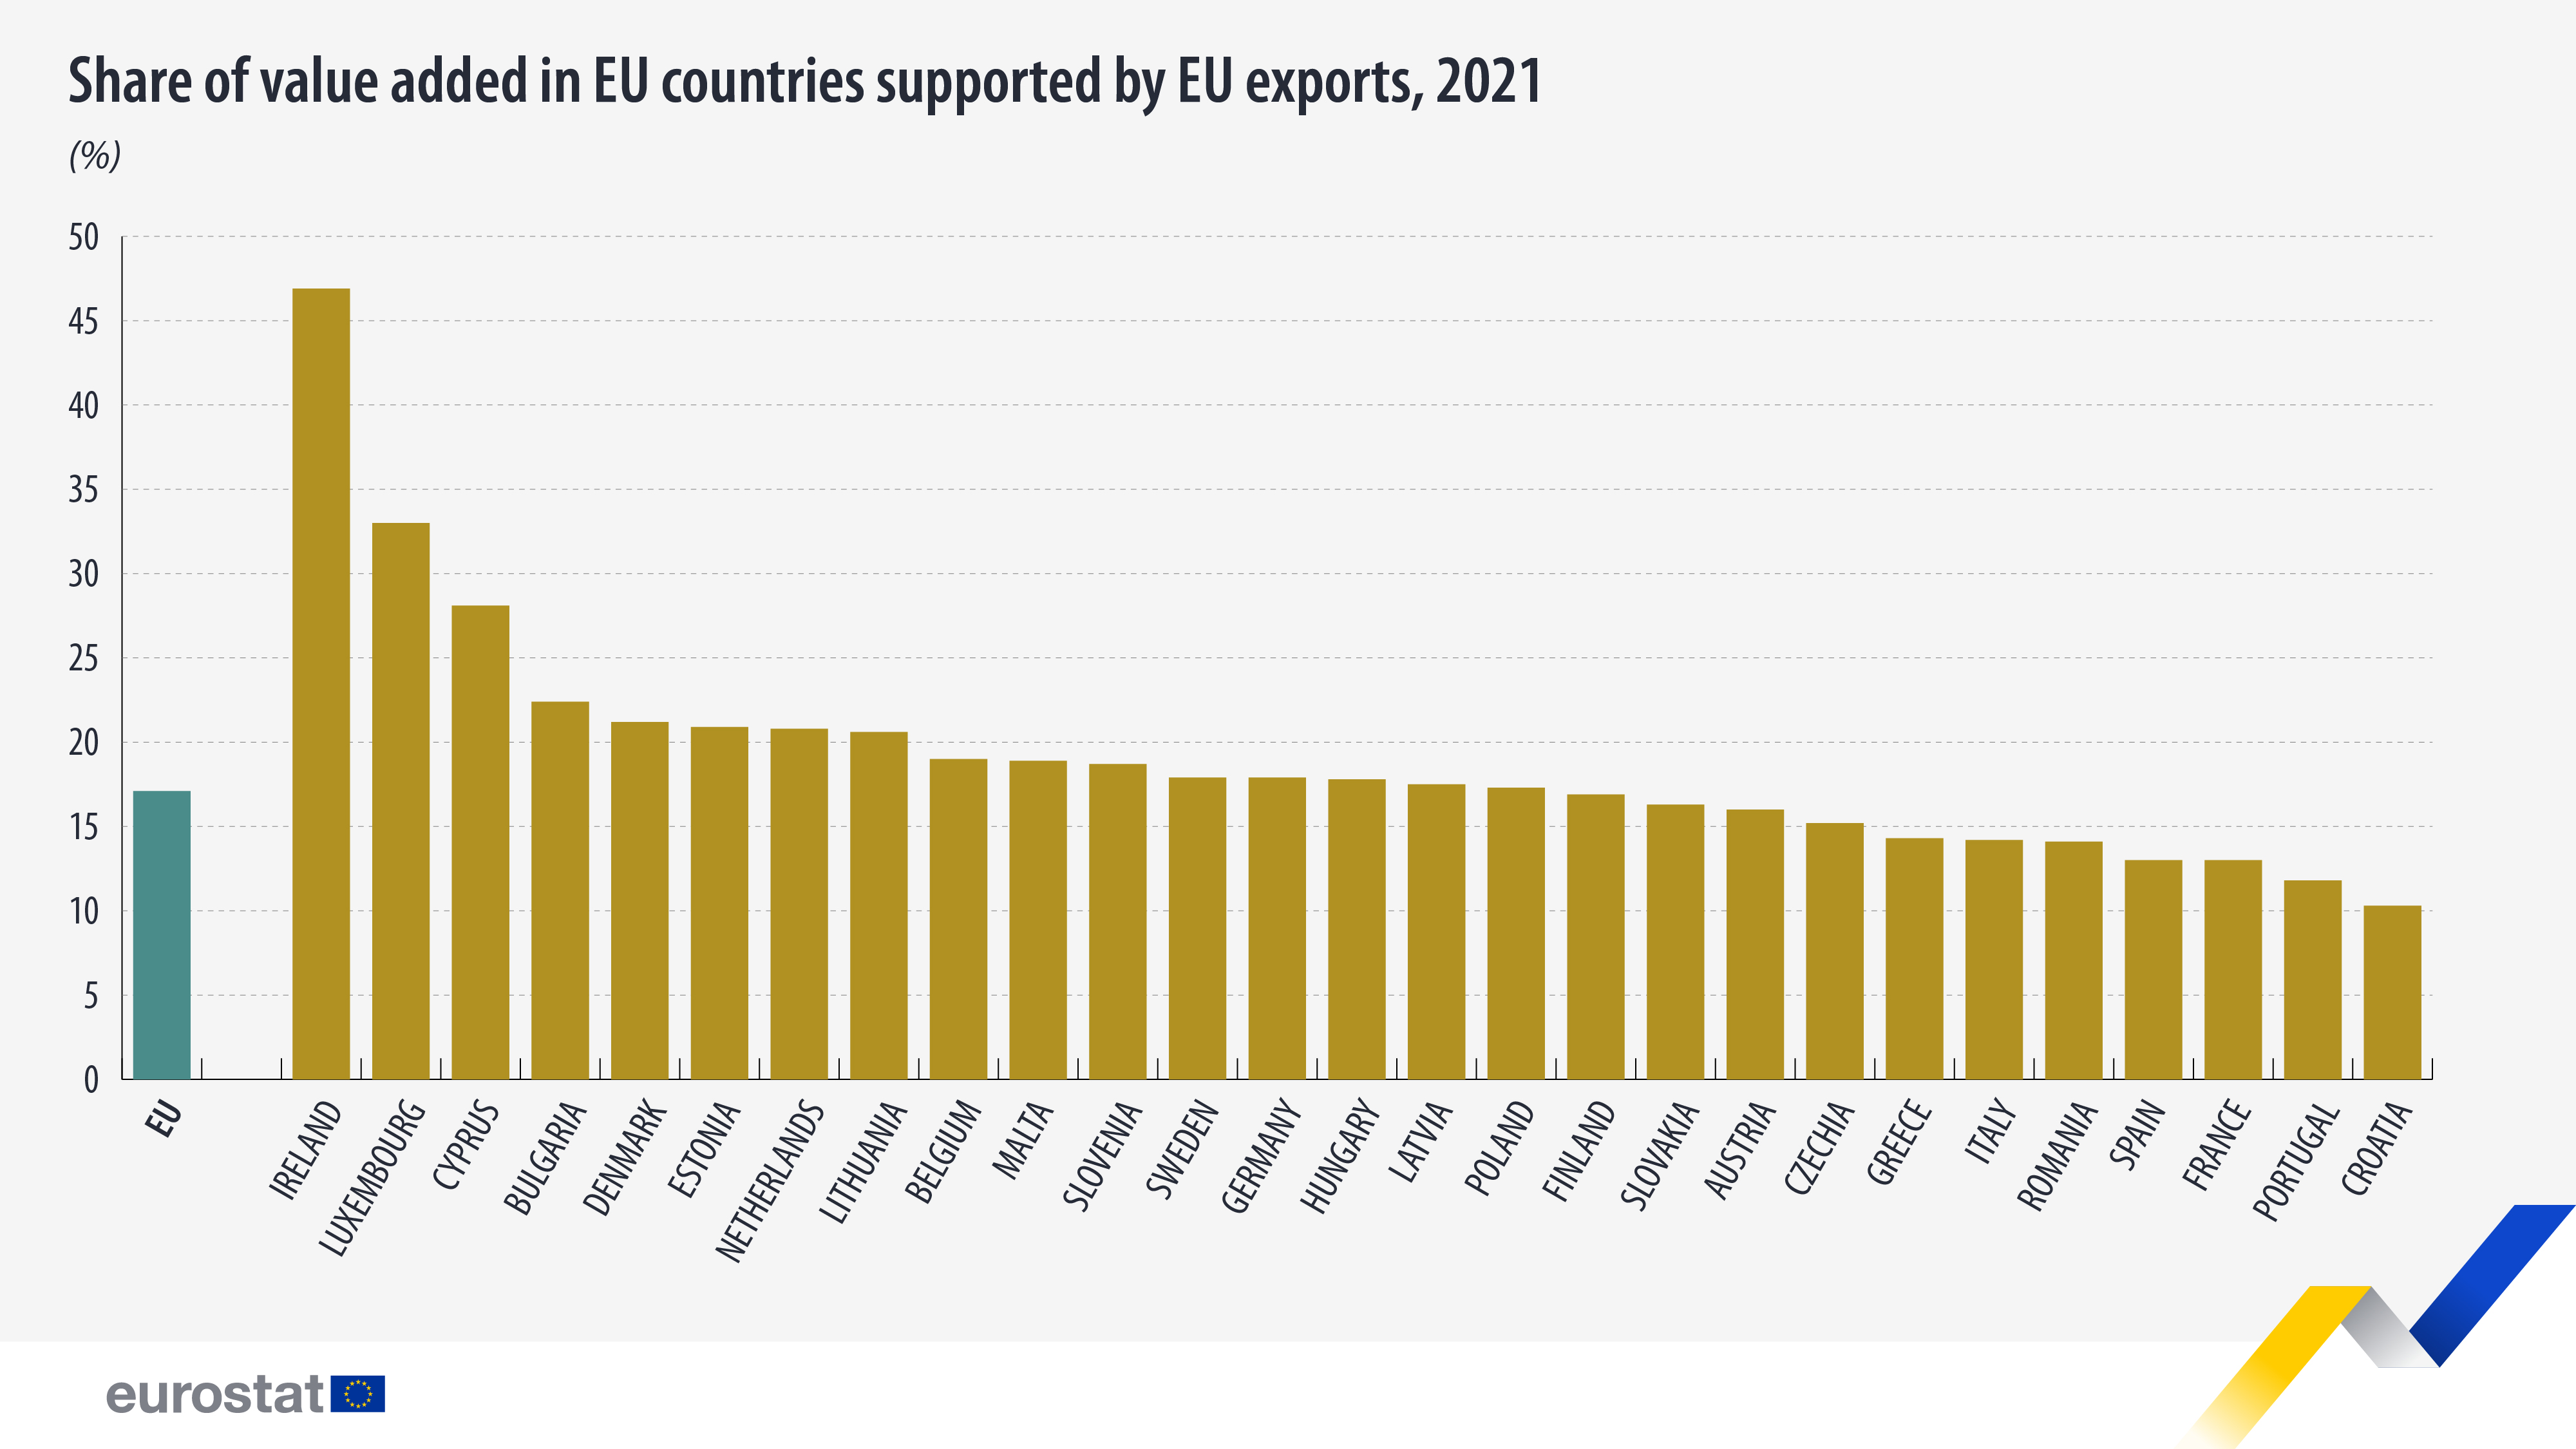
EU exports supported €2 226 billion in value added in 2021, equivalent to 17% of the €12 993 billion in total value added created in the EU.
Compared with 2020, when €1 962 billion of value added (16%) was supported by exports to non-EU countries (on a total EU value added of €12 032 billion), this represents an increase of €0.264 billion (+0.8%).
Again, in terms of absolute value added supported by EU exports, Germany was the EU country with the highest value in 2021: €583.6 billion. Germany was followed by France (€287.2 billion) and Italy (€227.8 billion).
As a share of the total value added, the highest values supported by EU exports were nevertheless found in Ireland (47%) and Luxembourg (33%).
By contrast, the lowest share of value added generated by EU exports were recorded in Croatia (10%) and Portugal (12%).
Source dataset: naio_10_favx
For more information
- Statistics Explained article on employment content in EU exports – an analysis with FIGARO data
- Statistics Explained article on value added content in EU exports – an analysis with FIGARO data
- Thematic section on supply, use and input-output tables
- Database on supply, use and input-output tables
- Database on FIGARO tables
- Database on FIGARO applications
Methodological notes
- All references to exports in this article concern exports to non-EU countries, in other words, extra-EU exports; trade between EU Member States is not considered.
- The number of persons employed in the EU or in individual EU Member States supported by exports includes not only employment in enterprises that are directly exporting, but also in others which provide goods and/or services to support the production of exported goods and services; in other words, employment in upstream enterprises is also included. This may concern employment in enterprises in the same industry as the exporter or in a different one (depending, in part, on how detailed an activity classification is used). Similarly, exports by enterprises in one Member State may support employment in the same Member State or in another one.
- Employment covers all persons engaged in some productive activity in an economy. Employed persons are either employees (working by agreement for another resident unit and receiving remuneration) or self-employed (owners of unincorporated enterprises).
- The first (resp. second) visual presents the share of employment (resp. value added) supported by EU exports to the total employment (resp. value added) generated in the country.
If you have any queries, please visit our contact us page.


