SDG 3 - Good Health and well-being
Ensure healthy lives and promote well-being for all at all ages
Data extracted in April 2023.
Planned article update: June 2024.
Highlights

This article is a part of a set of statistical articles, which are based on the Eurostat publication ’Sustainable development in the European Union — Monitoring report on progress towards the SDGs in an EU context — 2023 edition’. This report is the seventh edition of Eurostat’s series of monitoring reports on sustainable development, which provide a quantitative assessment of progress of the EU towards the SDGs in an EU context.
SDG 3 aims to ensure health and promote well-being for all at all ages by improving reproductive, maternal and child health; ending epidemics of major communicable diseases; and reducing non-communicable and mental diseases. It also calls for reducing behavioural and environmental health-risk factors.
Full article
Good health and well-being in the EU: overview and key trends
Health can be defined as ‘a state of complete physical, mental and social well-being and not merely the absence of disease or infirmity’ [1]. Good health is not only of value to the individual as a major determinant of quality of life, well-being and social participation, it is also a basic precondition for general economic growth. Monitoring SDG 3 in an EU context focuses on the topics of healthy lives, determinants of health, causes of death and access to health care. Over the five-year period assessed, the EU has made progress in most health-related indicators analysed here, even though the impacts of the COVID-19 pandemic are now clearly visible in some areas. As such, the healthy life expectancy has declined in the EU in 2020, and the number of people dying from avoidable (preventable) causes has grown. Developments have been more favourable in the other indicators used to monitor healthy lives, causes of death and access to health care. Progress has been particularly strong in reducing the negative impact of certain other causes of (premature) death and in diminishing self-reported unmet need for medical care. Less progress, however, has been made in improving some of the health determinants examined, such as obesity rates and noise pollution.
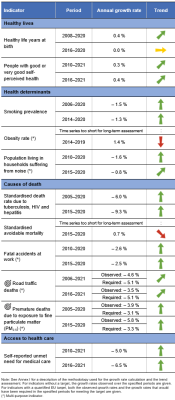
Table 1: Indicators measuring progress towards SDG 3, EU
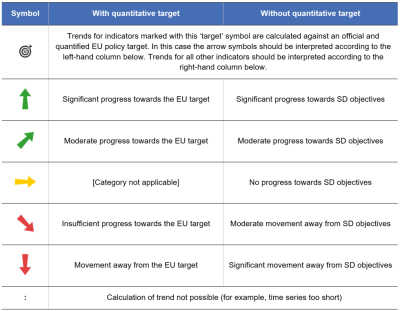
Table 2: Explanation of symbols for indicating progress towards SD objectives and targets


Healthy Lives
The worldwide surge in life expectancy over the past century is a result of various factors, including reduced infant mortality, rising living standards, improved lifestyles and better education, as well as advances in health care and medicine. While life expectancy has increased in EU countries over the past few decades, the pace of progress has slowed in recent years in many of those countries. The COVID‑19 pandemic resulted in a decline in life expectancy in most EU countries in 2020 and 2021 [2]. However, while life expectancy gives an objective assessment of how long people can expect to live, it does not show whether people live their lives in good health. Thus, two indicators are now included in the analysis. The first one, healthy life years at birth, measures the quantity of life spent in a healthy state. The second one measures the share of people with good or very good perceived health, capturing an individual’s subjective view of their well-being.
The healthy life expectancy of the EU population has stagnated since 2016, while self-perceived health has improved
In 2020, a child born in the EU could on average expect to live 64.0 years without any severe or moderate health problems. This is the same number of years as in 2016 but 0.6 years lower than at the pre-pandemic peak of 64.6 years in 2019. However, the overall EU figure masks considerable differences between Member States, with healthy life expectancy varying by 19.3 years between countries in 2020. This difference has become somewhat smaller compared with 2019, when it amounted to 20.2 years.
While healthy life expectancy has stagnated since 2016, self-perceived health has improved in the EU. Between 2016 and 2021, the share of people perceiving themselves to be in good or very good health increased by 1.5 percentage points. In 2021, 69.0 % of people in the EU judged their health as either good or very good. However, this share varied strongly across Member States, ranging from 47.9 % to 81.2 %. Furthermore, slight differences also exist between rural and urban areas. In 2021, the percentage of people who perceived their health as good or very good was highest in cities (70.7 %), slightly above the average in towns and suburbs (69.2 %) and lowest in rural areas (66.3 %) [3]. Lastly, the share of persons with activity limitation – a dimension of disability capturing a long-standing limitation to perform usual activities – who perceived their health as good or very good was significantly lower than the EU average. Only 26.6 % of persons with a moderate activity limitation and even only 6.6 % of people with severe activity limitation perceived their health as good or very good in 2021 [4], while 85.2 % of people without activity limitation did so.
Women have a higher healthy life expectancy than men, but are less likely to assess their health as good
Between 2016 and 2020, the number of healthy life years that women could expect at birth increased by 0.1 years, from 64.4 years to 64.5 years. During the same period, the healthy life years men could expect at birth decreased by 0.1 years — from 63.6 in 2016 to 63.5 years. On the other hand, women were associated with a higher absolute number of healthy life years, and with a higher gain of healthy life years than men. In addition, the gap between the two examined sexes rose from 0.8 years in 2016 to 1.0 years in 2020. In the same year, in about three out of four Member States, women could expect a higher number of healthy life years at birth than men.
Despite their higher healthy life expectancy at birth, women were less likely than men to rate their health as good or very good: 66.6 % of women and 71.6 % of men perceived their health as good or very good in 2021 — a gap of 5.0 percentage points.
High excess mortality has reduced life expectancy in the EU
The COVID-19 pandemic considerably affected death rates in EU Member States throughout 2020 and 2021. The population above the age of 60 years, as well as people from socially disadvantaged groups, were especially affected [5]. Overall, between January 2020 and February 2023, about 1.74 million excess deaths were recorded in the EU and European Free Trade Association (EFTA) countries compared with the average number of deaths registered during the period 2016 to 2019 [6]. The decrease in life expectancy across the EU caused by the COVID-19 pandemic in 2020 continued in 2021, once again with substantial differences across countries. Life expectancy at birth in the EU continued to decrease by on average 0.3 years between 2020 and 2021, from 80.4 to 80.1 years — after a decrease of 0.9 years between 2019 and 2020 [7]. The largest reductions in life expectancy in 2021 compared with 2020 were observed in Bulgaria and Slovakia (2.2 years both), followed by Latvia (2.1 years) and Estonia (2.0 years).
Furthermore, men appear to have been affected somewhat more strongly by the pandemic, with a reduction in life expectancy of 1.3 years compared with a reduction of 1.1 years for women in 2021, compared with the pre-pandemic figures (2019). Lastly, the effects of the pandemic on the elderly were substantial. The expected remaining life years at age 65 decreased by 1 year between 2019 and 2021 — from 20.2 to 19.2 years. Both men and women aged 65 were affected, with their remaining life expectancy falling by 1.0 and 0.9 years, respectively [8].
Specific population groups have lower life expectancy
While this monitoring report focuses on the life expectancy of the general population, other studies indicate that life expectancy may differ across specific subpopulations. For example, life expectancy estimates based on interviews with more than 8 000 respondents from 11 EU and non-EU countries suggest that Roma people have a substantially lower life expectancy than that of the general population in those countries. The extrapolated time trend for 2017 suggests that Roma men were expected to live 9.1 fewer years than men in the general population. The corresponding estimate for women shows that the life expectancy of Roma women was 11 years lower than that of women in the general population in the countries examined [9].
Health Determinants
Many factors affect the health of individuals and populations. These include socio-economic factors, the state of the environment, city design, access to and use of health services, and individual characteristics and behaviour [10]. Lifestyle-related risk factors, such as an unhealthy diet, physical inactivity, smoking and excessive alcohol consumption, directly affect citizens’ quality of life and life expectancy. These factors also have a negative impact on the health and social systems of EU Member States, government budgets, and economic productivity and growth. The health determinants discussed in the following sections are obesity rate , smoking prevalence and noise pollution. In addition, further factors such as mobility and consumption patterns may also influence all of the health determinants described below.
More than half of the adult EU population was overweight in 2019
Obesity is a serious public health problem because it significantly increases the risk of chronic diseases, such as cardiovascular disease, type-2 diabetes, hypertension and certain types of cancer. For some individuals, obesity may also be linked to a wide range of psychological problems. From a societal perspective, obesity has substantial direct and indirect costs that put a considerable strain on health and social security systems. Furthermore, being obese or overweight from an early age can lead to more health problems in the long term [11].
In 2019, 16.5 % of the EU population aged 18 or above were obese (with a body mass index equal to or greater than 30) and another 36.2 % were pre-obese (with a body mass index between 25 and 30) [12]. In total, more than half of the EU population at the age of 18 or above were obese or pre-obese (and therefore overweight). Between 2014 and 2019 the share of both obese and of pre-obese people increased by 1.1 and 0.5 percentage points respectively. The total share of overweight people grew slightly over this period, from 51.1 % in 2014 to 52.7 % in 2019.
The obesity rate generally increases with age, peaking at age group 65 to 74 years (22.3 % obese in 2019) and decreasing again for people aged 75 and older. Moreover, obesity and pre-obesity rates decrease with higher educational levels, with 2019 obesity rates ranging from 11.4 % for people with tertiary education to 20.3 % for people with lower secondary education or lower. The obesity rate was also lower among young people aged 18 to 24, at 6.0 % [13]. In 2019, there was furthermore a considerable difference between Member States, with values ranging from 10.9 % in Romania to 28.7 % in Malta for obese people aged 18 and over.
Smoking prevalence among the population aged 15 or over has decreased since 2006
Tobacco consumption is considered to be the single most preventable cause of illness and death worldwide. The WHO European Region — that also includes some non-European countries such as Israel, as well as some countries in Central Asia [14] — has one of the highest mortality rates attributable to tobacco use [15]. Tobacco use is currently the leading cause of 16 % of all deaths among adults aged 30 years and over in Europe, which is above the global average of 12 %. Many of these deaths occur prematurely, which is hardly surprising because many types of cancer and cardiovascular and respiratory diseases are linked to tobacco use [16].
Smoking prevalence among the population aged 15 or over fell between 2006 and 2020, from 31 % to 25 %. In 2020, more men (28 %) than women (22 %) reported that they smoke. However, the decline in smoking prevalence is less evident for women than for men, which can partially explain the narrowing gap in life expectancy between the sexes [17]. The age group with the highest prevalence of smokers were those aged 25 to 54 (close to 30 %) followed by younger respondents aged 15 to 24 (20 %) and older people aged 55 years and above (18 %). Lastly, the share of smokers who indicated having trouble paying bills most of the time is higher than the share of smokers who said they (almost) never have trouble paying bills [18].
Noise pollution levels in the EU have decreased
Noise exposure reduces life satisfaction and perceived well-being. The WHO identified noise as the second most significant environmental cause of ill health in western Europe after air pollution [19]. The most harmful health problems — such as those affecting the circulatory system — arise because of interrelated issues including decreased sleep quality and stress reactions in the human body. These issues can lead to premature death [20]. In Europe, environmental noise is estimated to contribute to 12 000 premature deaths per year [21]. Road traffic is the dominant source of environmental noise, but railways, airports and industry also remain important sources of localised noise pollution [22]. The WHO Environmental Noise Guidelines for the European Region provide recommendations for protecting human health from exposure to environmental noise that originates from various sources.
The EU has made progress towards reducing noise pollution over the past 11 years, with the share of the population feeling affected by noise from neighbours or the street falling from 20.6 % in 2010 to 17.6 % in 2020. Since the assessment of noise pollution is a subjective measure, a fall in the value of the indicator may not necessarily indicate a similar reduction in actual noise-pollution levels [23]. The perception of noise pollution is also unevenly distributed between Member States: the proportion of people suffering from noise in 2020 was smallest in Estonia (8.0 %) and largest in Malta (30.8 %).
Causes of Death
Causes of death are among the oldest medical statistics available and play a key role in the general assessment of health in the EU. The data can be used to determine which preventive and medical curative measures or investment in research might increase a population’s life expectancy. The indicators selected for this sub-theme look at deaths due to communicable diseases, avoidable mortality, air pollution and fatal accidents on roads and at work.
While recent developments in certain communicable diseases remain positive, the COVID-19 pandemic seems to have led to more avoidable deaths
Avoidable mortality refers to preventable and treatable causes of death, including injuries and drug-related diseases, as well as respiratory and infectious diseases, and some types of cancer. While avoidable mortality had been decreasing until 2019, the COVID-19 pandemic appears to have reversed the trend. Between 2015 and 2020, preventable mortality rose by 8.2 %, from 166.3 per 100 000 persons in 2015 to 180.0 per 100 000 in 2020. This result may be a consequence of the COVID-19 pandemic: health systems operated close to their capacity limits in many EU countries, which might have prevented health care professionals from providing patients with the health care they needed on time, or even at all. On the other hand, treatable mortality decreased by 4.3 %, from 95.9 per 100 000 persons to 91.7 in 100 000, over the same period. In total, avoidable mortality increased by 3.6 % in the EU, from 262.1 per 100 000 persons in 2015 to 271.7 per 100 000 persons in 2020. While the developments were nevertheless positive in many Member States, the gap of 410.6 persons per 100 000 in 2020 between the highest (593.2 in Romania) and the lowest (182.7 in Cyprus) value shows there remains a great deal of variability within the EU.
The objective of reducing the health burden caused by communicable diseases such as HIV, tuberculosis and hepatitis is enshrined in the Sustainable Development Goals. The EU has also committed to helping Member States achieve the objectives to eradicate HIV/AIDS and tuberculosis by 2030 and to reduce hepatitis [24]. Deaths due to these three diseases have been falling steadily in the EU over the past two decades. While 4.8 out of 100 000 people died from one of these diseases in 2005, the number of deaths had fallen to 1.9 per 100 000 people by 2020. In addition, there was a considerable gap between the country with the highest (7.9 deaths per 100 000 people in Latvia) and the lowest value (0.4 deaths per 100 000 people in Malta) in 2020.
The trends were also positive for the three diseases separately: between 2005 and 2020 deaths per 100 000 people fell from 1.8 to 0.6 for tuberculosis, from 1.3 to 0.4 for HIV/AIDS and from 1.7 to 0.8 for hepatitis. In the case of hepatitis, however, the current calculation of the indicator may conceivably underreport deaths due to hepatitis B and C [25].
The number of premature deaths due to exposure to air pollution by fine particulate matter in the EU has fallen
According to European Environment Agency (EEA) estimates, air pollution is the number-one environmental cause of death in Europe. It can lead to or aggravate many chronic and acute respiratory and cardiovascular diseases. Air pollution has been one of the EU’s main environmental policy concerns since the late 1970s. Air pollutants are emitted both naturally and as a result of human activities, mainly through fuel combustion. Urban populations are particularly exposed because of the daily flow of commuters, and the high concentration of industry and human activities causing the emission of fine particulate matter in EU cities. In addition, the most vulnerable citizens remain disproportionately affected by air pollution [26]. For example, groups with lower socioeconomic status tend to be disproportionately affected by air pollution because they often live closest to its source. Children are another disproportionally affected group. On one hand, children have higher respiratory rates than adults, which increases their exposure to air pollution. On the other hand, children’s developing immune system and organs make them more vulnerable to air pollution [27]. Air pollution also has a significant negative impact on the economy, by reducing both productivity and life expectancy, as well as by increasing health costs [28]. Fine particulate matter (PM2.5) is one of the most harmful components of air pollution for human health, causing 237 810 premature deaths in Europe in 2020. Between 2005 and 2020, premature deaths due to exposure to PM2.5 decreased by 44.8 %. This development suggests the EU is on track to meeting its target of reducing the negative impact of air pollution on health by 55 % by 2030 compared with 2005, as set out in the Zero Pollution Action Plan (see ‘Zero pollution’ monitoring and outlook). However, according to the EEA, it may be challenging for most EU countries to keep reducing the concentration of particulate matter in ambient air over the next decade [29]. To ensure the 2030 target is met, Member States need to fully adopt and implement current and proposed EU legislation, notably in the areas of energy and climate, and vehicle emissions. To help accelerate progress, the European Commission published a proposal for the revision of the EU Directive on ambient air quality and cleaner air for Europe in October 2022 to align air quality standards with the recommendations of the WHO on air quality.
Fatal accidents at work and on the road have decreased, but further progress is necessary to meet the 2030 target of halving deaths from road crashes
Accidents were one of the most common causes of death within the EU in 2020, leading to more than 154 000 deaths or 3.0 % of all deaths [30]. These accidents may happen at different places such as at home, leisure venues or work, as well as while travelling. Improving the working environment to protect employee health and safety is an important objective set out by the EU and its Member States in the Treaty on the Functioning of the European Union.
Halving the number of deaths from road-traffic crashes is not only a global target, but also a goal of EU policies. The EU road safety policy framework 2021–2030 set a target of reducing deaths and serious injuries by 50 % by 2030 compared with 2019.
In 2021, slightly more than 19 900 people were killed in road traffic crashes (equalling 4.5 per 100 000 people). This represents a 16.3 % reduction compared with 2016, due in part to the lower traffic volumes as a result of the COVID-19 pandemic. However, the number of road fatalities in the EU will need to fall more quickly to meet the target of halving the number of people killed in road traffic crashes by 2030 compared with 2019 levels. The EU rate of 4.5 fatalities per 100 000 people compares favourably with the global average of around 18 per 100 000. Preliminary results for 2022 indicate that fatalities remained well below the pre-pandemic level: while in 2022 road deaths rose by 3 % in relation to 2021, they remained almost 10 % lower compared with the pre-pandemic year 2019 [31]. For further details see the article on SDG 11.
Fatal accidents, leading to a person’s death within one year, may also occur at work. The EU made progress on this indicator between 2015 and 2020, reducing the number of fatal accidents at work per 100 000 employed persons from 2.0 to 1.8. Compared with 2019, the total incidence rate for fatal accidents at work increased somewhat in 2020. The reason for this increase might be that some countries included COVID-19 cases in the reported data on fatal work accidents [32]. Furthermore, there is a considerable difference between the sexes: the incidence rate of women (0.3) was negligible compared with the rate of men (3.1). This difference can be explained by the higher share of men working in professions associated with a higher risk of work accidents. Non-fatal accidents can also cause considerable harm, for example by leading to a permanent disability that may force people to leave the labour market or change their job. Non-fatal accidents happened considerably more often than fatal accidents, with an incidence rate of 1 444 per 100 000 employed persons in 2020 [33].
Access to Health Care
Access to health care — the timely access to affordable, preventive and curative health care — is high on the political agenda of most EU countries. It is defined as a right in the Charter of Fundamental Rights and is one of the 20 principles of the European Pillar of Social Rights [34]. Limited access for some population groups, especially people with disabilities, may result in poorer health outcomes and greater health inequalities [35]. Reducing health inequalities is not only important for equity reasons, but also because it contributes to higher economic and social cohesion [36].
Overall, the unmet need for medical care has decreased, but the gap between Member States has widened
In 2021, 2.0 % of the EU population reported an unmet need for medical care because of financial reasons, long waiting lists or travel distance. This share was lower than five years earlier, when it was 2.8 %. However, progress seems to have stalled since 2017, and in some Member States the trend has reversed, showing an increase in the percentage of the population that reported unmet medical need in 2021 — a trend that started in 2019. The considerable differences between Member States’ reported unmet needs for medical care registered in 2016 have become substantially smaller five years later. Compared with 2016, the gap between the EU countries has narrowed by 7.1 percentage points, reaching 8.0 percentage points in 2021. While in Cyprus, Germany and Malta 0.1 % of the population reported an unmet need for medical care in 2021 for the reasons monitored, in Estonia the rate was 8.1 % of the population. Moreover, people with disabilities find it more difficult to access health care. In 2021, 6.2 % of people with severe activity limitations and 3.9 % of people with some activity limitations reported unmet needs for medical care due to the monitored reasons (financial, waiting list or distance), compared with only 1.1 % of people without disabilities [37]. This discrepancy indicates that access to health care remains a challenge not only in certain parts of the EU but also for certain population groups.
Financial constraints are the most common reason why people report unmet needs for medical examination. On average, for 1.0 % of the total EU population in 2021, ‘too expensive’ was the most prominent reason for reporting unmet medical examination. Furthermore, financial constraints were the most common self-reported reason for unmet needs in rural areas (1.1 %), which was slightly more than for people in towns or suburbs (0.9 %) and in cities (0.8 %). A further 0.9 % across all degrees of urbanisation reported ‘waiting lists’ as a reason for unmet need for medical examination. This reason for unmet medical needs was more often declared in cities, and rural areas (both 1.0 %) than in towns and suburbs (0.8 %). Another 0.1 % described ‘too far to travel’ as the main reason for an unmet need for medical examination. This was more often the case in rural areas (0.2 %) than in cities, or in towns and suburbs (both 0.1 %). However, not all Member States listed cost as the main reason for unmet need — in many countries waiting lists were cited by the majority of people [38].
Most European countries have achieved universal coverage for a core set of services, which usually include consultations with doctors, tests, examinations and hospital care. Yet in some countries, coverage of these services might not be universal or patients have to bear the costs of accessing them. Furthermore, across the EU, around a seventh of all health spending was borne directly by households in 2020. Out-of-pocket payments as a share of total current health expenditure decreased slightly from 15.9 % in 2014 to 14.4 % in 2020. However, a considerable gap of 27.1 percentage points between countries remained in 2020 [39]. Such out-of-pocket payments can pose a serious problem for low-income households, in particular if combined with reduced financial resources for the health care system caused, for example, by an economic crisis [40]. Moreover, across Member States, between 1.0 % and 19.2 % of households experienced catastrophic spending on health, meaning out-of-pocket spending on health care exceeded 40 % of a household’s disposable income [41]. Poor households and those who have to pay for long-term treatment such as medicines for chronic illness are at high risk of experiencing financial hardship as a result of having to pay out of their own pockets.
Specific population groups may not have the same access to health services as the general population
In many EU countries minorities do not have the same access to health services as the general population. One of those minorities is the one of Roma people. According to a study based on survey data from 2021 the share of Roma people who experienced discrimination in terms of access to health services increased between 2016 and 2021 in most of the 13 EU and non-EU countries examined by the Fundamental Rights Agency. The same survey provides evidence that women were more often discriminated against than men. Furthermore, the youngest and the oldest respondents reported lower levels of discrimination compared with middle-aged respondents: the age group 16 to 24 experienced discrimination in 10 % of cases, while respondents aged 65 and above reported discrimination in 13 % of cases. At the same time, 16 % of respondents aged 25 to 64 reported they had experienced discrimination.
Presentation of the main indicators
Healthy life years at birth

This indicator measures the number of years at birth that a person can expect to live in a healthy condition. Healthy life years is a health expectancy indicator which combines information on mortality and morbidity (prevalence of the population suffering from a disease or medical condition).
.png)
.png)
Source: Eurostat (sdg_03_11)
People with good or very good self-perceived health

This indicator is a subjective measure of how people judge their health in general on a scale from ‘very good’ to ‘very bad’. The data stem from the EU Statistics on Income and Living Conditions (EU-SILC). Indicators of perceived general health have been found to be a good predictor of people’s future health care use and mortality.
.png)
Source: Eurostat (sdg_03_20)
_2023.png)
Source: Eurostat (sdg_03_20)
Smoking prevalence

This indicator measures the percentage of the population aged 15 years and over who report they currently smoke boxed cigarettes, cigars, cigarillos or a pipe [42]. It does not include the use of other tobacco and related products such as electronic cigarettes and snuff. The data are collected through a Eurobarometer survey [43] and are based on self-reported use during face-to-face interviews in people’s homes.
_2023.png)
Source: European Commission services, Eurostat (sdg_03_30)
_2023.png)
Source: European Commission services, Eurostat (sdg_03_30)
Standardised death rate due to tuberculosis, HIV and hepatitis

This indicator measures the age-standardised death rate of selected communicable diseases. The rate is calculated by dividing the number of people dying due to tuberculosis, HIV and hepatitis by the total population. This value is then weighted with the European Standard Population [44].
.png)
Source: Eurostat (sdg_03_41)
.png)
Source: Eurostat (sdg_03_41)
Standardised avoidable mortality

Avoidable mortality covers both preventable and treatable causes of mortality. Preventable mortality refers to mortality that can mainly be avoided through effective public health and primary prevention interventions (i.e. before the onset of diseases/injuries, to reduce incidence). Treatable mortality can mainly be avoided through timely and effective health care interventions, including secondary prevention and treatment (after the onset of diseases to reduce case-fatality). The total avoidable mortality rate includes a number of infectious diseases, several types of cancers, endocrine and metabolic diseases, as well as some diseases of the nervous, circulatory, respiratory, digestive and genitourinary systems, some diseases related to pregnancy, childbirth and the perinatal period, a number of congenital malformations, adverse effects of medical and surgical care, a list of injuries and alcohol and drug related disorders.
.png)
Source: Eurostat (sdg_03_42)
.png)
Source: Eurostat (sdg_03_42)
Self-reported unmet need for medical care

In the context of SDG monitoring, this indicator measures the share of the population aged 16 and over reporting unmet needs for medical care due to one of the following reasons: ‘financial reasons’, ‘waiting list’ and ‘too far to travel’. Self-reported unmet needs concern a person’s own assessment of whether they needed medical examination or treatment (dental care excluded), but did not have it or did not seek it. The data stem from the EU Statistics on Income and Living Conditions (EU-SILC). Since social norms and expectations may affect responses to questions about unmet care needs, caution is required when comparing differences in the reporting of unmet medical examination across countries. In addition, the different organisation of health care services is another factor to consider when analysing the data. Finally, there are also some variations in the survey question across countries and across time [45].
.png)
Source: Eurostat (sdg_03_60)
.png)
Source: Eurostat (sdg_03_60)
Direct access to
More detailed information on EU SDG indicators for monitoring of progress towards the UN Sustainable Development Goals (SDGs), such as indicator relevance, definitions, methodological notes, background and potential linkages, can be found in the introduction of the publication ’Sustainable development in the European Union — Monitoring report on progress towards the SDGs in an EU context — 2023 edition’.
Further reading on good health and well-being
- European Center for Disease Prevention and Control (2020), Guidance on the provision of support for medically and socially vulnerable populations in EU/EEA countries and the United Kingdom during the COVID-19 pandemic.
- EEA (2019), Healthy environment, healthy lives: how the environment influences health and well-being in Europe, European Environment Agency, Copenhagen.
- OECD & European Commission (2022), Health at a Glance: Europe 2022, OECD Publishing, Paris.
- WHO (2018), Environmental Noise Guidelines for the European Region, WHO Regional Office for Europe, Copenhagen.
Further data sources on good health and well-being
Notes
- ↑ World Health Organization (1946), Constitution of the World Health Organization.
- ↑ Source: Eurostat (online data code: (sdg_03_10)).
- ↑ Source: Eurostat (online data code: (hlth_silc_18)).
- ↑ Source: Eurostat (online data code: (HLTH_DH010)).
- ↑ OECD/EU (2020), Health at a Glance. Europe 2020 — State of Health in the EU Cycle, OECD Publishing, Paris, p. 12.
- ↑ Eurostat (2023), Excess mortality statistics.
- ↑ Source: Eurostat (online data code: (sdg_03_10)).
- ↑ Source: Eurostat (online data code: (DEMO_MLEXPEC)).
- ↑ European Union Agency for Fundamental Rights (2022), Roma Survey 2021. Roma in 10 European countries — Main results.
- ↑ WHO (2017), Social determinants of health, Evidence on social determinants of health.
- ↑ World Health Organization (2021), Obesity: New analysis from WHO/Europe identifies surprising trends in rates of overweight and obesity across the Region.
- ↑ The indicator measures the share of obese people based on their body mass index (BMI). BMI is defined as the weight in kilograms divided by the square of the height in metres. People aged 18 years or over are considered obese with a BMI equal to or greater than 30. Other categories are: underweight (BMI less than 18.5), normal weight (BMI between 18.5 and less than 25), and pre-obese (BMI between 25 and less than 30). The category overweight (BMI equal or greater than 25) combines the two categories pre-obese and obese.
- ↑ Source: Eurostat (online data code: (HLTH_EHIS_BM1E)).
- ↑ The WHO European Region also includes some non-European countries such as Israel, Uzbekistan, Turkmenistan or Tajikistan; see https://www.euro.who.int/en/countries for the full list of countries.
- ↑ World Health Organization (2012), WHO global report: mortality attributable to tobacco.
- ↑ World Health Organization Regional Office for Europe (2019), European Tobacco Use: Trends Report 2019.
- ↑ OECD/EU (2014), Health at a Glance: Europe 2014, OECD Publishing, Paris, p. 16–17.
- ↑ European Commission (2021), Attitudes of Europeans towards tobacco and electronic cigarettes, Special Eurobarometer 506.
- ↑ European Environment Agency (2019), Environmental noise.
- ↑ European Environment Agency (2021), Managing exposure to noise in Europe.
- ↑ European Environment Agency (2020), Healthy environment, healthy lives: how the environment influences health and well-being in Europe.
- ↑ European Environment Agency (2021), Managing exposure to noise in Europe.
- ↑ Also see: European Environment Agency (2019), Environmental noise.
- ↑ European Commission (2016), Next steps for a sustainable European future: European action for sustainability, COM(2016) 739 final, Strasbourg.
- ↑ Mårdh,O., Quinten, C., Amato-Gauci, A. & Duffell, E. (2020), Mortality from liver diseases attributable to hepatitis B and C in the EU/EEA – descriptive analysis and estimation of 2015 baseline, Infectious Diseases, 52:9, 625–637.
- ↑ European Environment Agency (2018), Unequal exposure and unequal impacts: social vulnerability to air pollution, noise and extreme temperatures in Europe, EEA Report No 22/2018, Copenhagen.
- ↑ Ibid.
- ↑ European Environment Agency (2021), Air quality in Europe — 2021 report, EEA Report 15/2021, Copenhagen.
- ↑ Ibid.
- ↑ Source: Eurostat (online data code: (hlth_cd_aro)).
- ↑ Source: European Commission (2022), Road safety in the EU: fatalities below pre-pandemic levels but progress remains too slow.
- ↑ European Commission (2023), European Accidents at Work Statistics: COVID-19 Cases with Occupational Origin.
- ↑ Source: Eurostat (online data code: (hsw_mi08)).
- ↑ OECD/EU (2018), Health at a Glance: Europe 2018 — State of Health in the EU Cycle, OECD Publishing, Paris, p. 3.
- ↑ Ibid, p. 169.
- ↑ European Council (2014), Council conclusions on the economic crisis and healthcare, 2014/C 217/02.
- ↑ Source: Eurostat (online data code: (HLTH_DH030)).
- ↑ Source: Eurostat (online data code: (HLTH_SILC_21)).
- ↑ Source: Eurostat (online data code: (HLTH_SHA11_HF)).
- ↑ Expert Panel on effective ways of investing in health (EXPH) (2016), Access to health services in the European Union, final opinion approved at the 14th plenary meeting of 3 May 2016 after public consultation, p. 18.
- ↑ OECD/EU (2020), Health at a Glance. Europe 2020 — State of Health in the EU Cycle, OECD Publishing, Paris. Data refer to different years for the Member States, ranging from 2011 to 2018.
- ↑ European Commission (2017), Attitudes of Europeans towards tobacco and electronic cigarettes, Special Eurobarometer 458, Annex.
- ↑ European Commission (2021), Eurobarometers on tobacco.
- ↑ Standardised death rates take into account the fact that countries with larger shares of older inhabitants also have higher death rates. See also: Eurostat (2013), Revision of the European Standard Population, Report for Eurostat’s Task Force, Publications Office of the European Union, Luxembourg.
- ↑ OECD/EU (2018), Health at a Glance: Europe 2018 — State of Health in the EU Cycle, OECD Publishing, Paris, p. 170.