SDG 11 - Sustainable cities and communities
Make cities and human settlements inclusive, safe, resilient and sustainable
Data extracted in April 2023.
Planned article update: June 2024.
Highlights

This article is a part of a set of statistical articles, which are based on the Eurostat publication ’Sustainable development in the European Union — Monitoring report on progress towards the SDGs in an EU context — 2023 edition’. This report is the seventh edition of Eurostat’s series of monitoring reports on sustainable development, which provide a quantitative assessment of progress of the EU towards the SDGs in an EU context.
SDG 11 aims to renew and plan cities and other human settlements in a way that offers opportunities for all, with access to basic services, energy, housing, transportation and green public spaces, while reducing resource use and environmental impact.
Full article
Sustainable cities and communities in the EU: overview and key trends
Around 325 million people or almost three-quarters of the EU population live in urban areas — cities, towns and suburbs — with almost 40 % residing in cities alone [1]. With the share of Europe’s urban population projected to rise to just over 80 % by 2050 [2], sustainable cities, towns and suburbs are therefore essential for citizens’ well-being and quality of life. Monitoring SDG 11 in an EU context means looking at developments in the quality of life in cities and communities, sustainable mobility and adverse environmental impacts. Overall, the EU has made only modest progress towards SDG 11 over the past few years. While there has been strong progress in increasing the quality of life in cities and communities, trends in the area of sustainable mobility are less clear-cut and are moreover impacted by the COVID-19 pandemic. The picture is similarly diverse when it comes to adverse environmental impacts, with both sustainable and unsustainable trends visible.
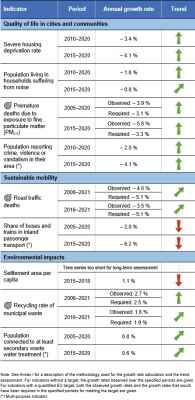
Table 1: Indicators measuring progress towards SDG 11, EU
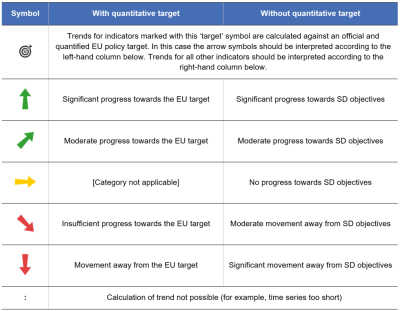
Table 2: Explanation of symbols for indicating progress towards SD objectives and targets


Quality of life in cities and communities
While European cities and communities provide opportunities for employment, and economic and cultural activity, many inhabitants still face considerable social challenges and inequalities. Problems affecting the quality of housing and the wider residential area, such as noise disturbance, crime and vandalism, are some of the most visible challenges that cities and communities can face and that impact quality of life.
Quality of housing in the EU has improved since 2010
Safe and adequate homes are a foundation for living an independent, healthy and fulfilling life. Poor housing conditions, on the other hand, are associated with lower life chances, health inequalities, increased risks of poverty and environmental hazards.
The severe housing deprivation rate refers to the share of the population living in an overcrowded household while also experiencing types of housing deprivation such as a leaking roof, damp walls, floors or foundations; rot in window frames or floors; lacking sanitary facilities; or a dwelling that is considered too dark. Between 2010 and 2020, the share of EU residents who lived in such conditions fell by 1.8 percentage points, which indicates an improvement in the perceived quality of the EU’s housing stock.
Europeans perceive their residential areas as quieter and safer
Noise disturbance can cause annoyance, stress, sleep deprivation, poor mental health and wellbeing, as well as harm to the cardiovascular and metabolic system [3]. Likewise, crime and vandalism can also reduce quality of life and housing satisfaction in a residential area. In 2020, 17.6 % of the EU population (about 78 million people) said their household suffered from noise disturbance, compared with 20.6 % in 2010 [4]. Crime, violence and vandalism in the neighbourhood were perceived by 10.7 % of the EU population in 2020, compared with 13.1 % in 2010.
The EU’s zero pollution action plan aims to reduce the share of people chronically disturbed by transport noise by 30 % by 2030 compared with 2017. At 55 decibels (dB) noise levels can start to have critical effects, ranging from severe annoyance and sleep disturbance to hearing impairment [5]. The more recent WHO guidelines for Europe are even more stringent, recommending that the noise level from road traffic should be below 53 dB during the day and below 45 dB at night. Despite improvements in perceived exposure to noise, 95 million people in the EU were estimated to be exposed to road traffic noise at levels of 55 dB or higher on an annual average for day, evening and night in 2017. While railways and airports represent further significant sources of local noise pollution, their impact on the overall population is much lower. The number of people exposed to harmful noise levels has not decreased significantly since 2012 [6]. A recent outlook from the European Environment Agency (EEA) suggests that meeting the 30 % reduction target of the zero pollution action plan will be challenging, with the most optimistic scenario only estimating a 19 % reduction.
Exposure to fine particular matter in the EU leads to premature deaths
Pollutants such as fine particulate matter (PM2.5) suspended in the air reduce people’s life expectancy, and can lead to or aggravate many chronic and acute respiratory and cardiovascular diseases [7]. Exposure to air pollution is of particular concern in cities, as they contain both a large number of potential emission sources (due to the concentration of economic activities) and large number of people being affected by air pollutants (due to the high population density).
According to data from the EEA, in 2020 almost all EU Member States registered annual mean PM2.5 concentrations below the EU limit value of 25 μg/m3 [8]. This effect is partly due to lockdown measures introduced by most governments during the COVID-19 pandemic. However, when considering the more stringent 2021 WHO air quality guideline of 5 μg/m3, almost all EU city dwellers (96 %) were estimated to be exposed to PM2.5 concentration levels deemed harmful to human health. The European Commission has proposed aligning EU ambient air quality standards more closely with WHO recommendations, and improving air quality monitoring, modelling and plans.
In the EU, long-term exposure to fine particulate matter was responsible for around 238 000 premature deaths in 2020. Since 2005, the number of premature deaths has already fallen by around 45 %, and the EU thus appears on track to meeting the zero pollution action plan target for 2030 which aims to reduce the number of premature deaths due to fine particulate matter exposure by more than 55 % compared with 2005 [9]. However, achieving the zero pollution target would require Member States to successfully implement current and planned policies, including the climate and energy targets put in place by the EU for 2030 [10].
City dwellers experience more noise pollution and crime
Statistics on the degree of urbanization provide an analytical and descriptive lens through which to view urban and rural communities. Based on the share of the local population living in urban clusters and urban centres, Eurostat differentiates between three types of area: ‘cities’, ‘towns and suburbs’ and ‘rural areas’ [11].
The severe housing deprivation rate in the EU in 2020 was higher in rural areas (4.9 %) than in cities (4.8 %) and in towns and suburbs (3.4 %) [12]. The perceived level of noise pollution varies greatly depending on the degree of urbanisation. In 2020, people living in EU cities were more likely to report noise from neighbours or from the street (23.9 %) compared with those living in towns and suburbs (16.3 %) or in rural areas (10.5 %) [13]. Similarly, the perceived occurrence of crime and vandalism in cities (16.3 %) was almost three times higher than in rural areas (5.8 %) and above the level observed in towns and suburbs (8.4 %) in 2020 [14].
Only two-thirds of the EU’s urban population can enjoy green urban spaces within walking distance
Green spaces in cities have a great potential to boost human health and well-being, and play a crucial role for children, the elderly and those with lower incomes, who may otherwise have limited access to nature. Universal accessibility to these green spaces that are safe, inclusive and open is thus essential. In the EU, 66.7 % of the urban centre population had access to green urban areas within a 400 metres walk in 2018. This share has remained stable since 2012. When considering green urban areas that are at least one hectare large, only 56.3 % of the urban centre population had access within a 400-metre walk in 2018. Among the EU Member States, Finland held the largest share of urban population with access to a green space within walking distance (93.9 %) in 2018, while Cyprus had the lowest (26.1 %) [15].
Sustainable mobility
A functioning transport system is necessary for people to reach their places of work, education, services and social activities, all of which affect quality of life and equal opportunities for everyone. In addition to availability, the type, quality and safety of transport systems are also crucial when designing sustainable and inclusive cities and communities.
Use of public transport modes dropped considerably during the pandemic
The EU aims to improve citizens’ quality of life and to strengthen the economy by promoting sustainable urban mobility and greater use of clean and energy-efficient vehicles, together with reducing the demand for individual car transport. Public transport networks help to relieve traffic jams, reduce harmful pollution and offer more affordable and sustainable ways to commute to work, access services and travel for leisure.
Since 2000, the share of buses and trains in inland passenger transport has stagnated well below 20 %, accounting for only 17.5 % in 2019. With the onset of the pandemic in 2020, this share fell drastically by 4.7 percentage points compared with 2019, to 12.8 %. The precautionary measures put in place, including domestic and international travel restrictions, quarantine restrictions, introduction of remote-working policies and changing mobility habits led to a reduction in the use of public transport [16] and passengers’ perceptions about safety and comfort. Consequently, the share of private mobility, including cycling, walking and private cars has increased. This decline in the shares of public modes of mobility is also reflected in the long- and short-term trends, showing a reduction by 4.6 percentage points since 2005 and by 4.8 percentage points since 2015.
Cars continue to remain the dominant form of passenger mobility in the EU. The decline in the use of public transport in 2020 coincides with an increase in the share of passenger kilometres travelled by car, which rose from 82.5 % in 2019 to 87.2 % [17]. According to an EU-wide survey on passenger mobility carried out in 2021, 64 % of the respondents reported that their travel behaviour was impacted by the COVID-19 pandemic. The extent of the recovery of public transport modes relative to private ones — especially cars — thus remains to be seen for 2022 and beyond.
Deaths from road crashes have fallen, but greater progress will be necessary to meet the 2030 target
Road traffic injuries are a public health issue and have a huge economic cost. About 120 000 people are estimated to be seriously injured in road accidents in the EU each year [18]. In 2021, about 55 people a day lost their lives on EU roads. This corresponds to slightly more than 19 900 people for the entire year — a loss equivalent to the size of a medium town. Nevertheless, the EU has made considerable progress in this respect compared with 2002 and 2010, when road deaths amounted to about 50 000 and 30 000, respectively. In recent years, the figures have experienced some fluctuations, in part explained by significant changes in traffic volumes as a result of to the COVID-19 pandemic. Between 2020 and 2021, road traffic deaths increased by 6 % following an unprecedented fall of 18 % between 2019 and 2020. The most recent figures, based on preliminary data for 2022, show the number of road deaths were 10 % lower than in relation to 2019. However, while the underlying trend in relation to the pre-pandemic level continues to be downward, the EU as a whole is not on track to meet its 2030 target of halving the total death toll on EU roads compared with 2019.
The highest share of road-traffic fatalities in 2021 was recorded on non-motorway roads outside urban areas (52 %), followed by roads inside urban areas (39 %) and motorways (9 %) [19]. While the overall number of fatalities fell by 23.1 % between 2010 and 2019, the number of cyclists killed in urban areas actually increased by 3.1 % [20]. Indeed, EU-wide, almost 70 % of fatalities in urban areas involve vulnerable road users such as pedestrians, motorcyclists and cyclists. This is therefore a key area when it comes to introducing new policy measures to tackle road safety.
Environmental impacts
While cities, towns and suburbs are a focal point for social and economic activity, if not managed sustainably, they risk causing considerable environmental damage. At the same time, large and densely populated cities provide opportunities for effective environmental action, indicating that urbanisation is not necessarily a threat but can act as a transformative force for more sustainable societies [21]. EU progress in reducing the environmental impacts of cities and communities is monitored by three indicators looking into the management of municipal waste, waste water treatment and artificial land cover.
The settlement area per capita has increased
Offering numerous cultural, educational and job opportunities, an urban lifestyle is attractive to many people. However, growth in the urban population has also come with increased land take. Land take is described as the process of transforming agricultural, forest and other semi-natural and natural areas into artificial areas. It often means growth in the settlement area over time, usually at the expense of rural areas. As a result of land take, urban areas may severely hamper the functioning of ecosystems and the related delivery of ecosystem services [22].
The settlement area indicator captures the amount of settlement area due to land-take. In the EU, settlement area per capita has increased over the past few years. In 2018, for each EU inhabitant, 703.4 square metres (m2) of land was covered by settlement area (comprising both sealed and non-sealed surfaces — for example, buildings, industrial and commercial area, infrastructure as well as also parks and sportsgrounds), which is 3.3 % more than in 2015.
Despite continuous improvements in municipal waste recycling, the EU might miss its targets
The ‘waste hierarchy’ is the overarching logic that guides EU waste policy. It prioritises waste prevention, followed by preparing for reuse, recycling, other recovery and finally disposal, including landfilling, as the last resort. Waste management activities promote recycling, which reduces the amount of waste going to landfills and leads to higher resource efficiency. Although municipal waste accounts for less than 10 % of the weight of total waste generated in the EU [23], it is highly visible and closely linked to consumption patterns. Sustainable management of this waste stream reduces the adverse environmental impact of cities and communities, which is why the EU has set a target to recycle or prepare for reuse at least 60 % of its municipal waste by 2030 [24].
In 2021, the EU residents generated 236 801 thousand tonnes of municipal waste, corresponding to 530 kilograms (kg) of waste per capita per year [25]. Since 2016, the annual amount of waste generated per capita increased by 37 kg, which represents an increase of 7.5 % between 2016 and 2021. Although the EU has not reduced its municipal waste generation, it has clearly shifted to more recycling. Since 2000, the recycling rate of municipal waste — covering both recycling and preparing for re-use — has increased continuously from 27.3 % to 49.6 % in 2021. However, the trend has slowed since 2016, with the share of recycled municipal waste increasing by only 3.7 percentage points between 2016 and 2021. Further efforts are therefore needed to put the EU back on track towards meeting its recycling targets by 2030.
Connection rates to waste water treatment have been increasing
Urban areas also place significant pressure on the water environment through waste water from households and industry that contains organic matter, nutrients and hazardous substances. The share of the EU population connected to at least secondary waste water treatment plants, which decompose most of the organic material and retain some of the nutrients, has been steadily growing since 2000 and reached 81.1 % in 2020. In seven Member States, more than 90 % of the population were connected to such services according to most recent data (which refer to 2015, 2019 or 2020, depending on the country). However, it may not be suitable to connect 100 % of the population to a sewerage collection system, either because it would produce no environmental benefit or would be too costly (see article on SDG 6 ‘Clean water and sanitation’).
Presentation of the main indicators
Severe housing deprivation rate

The severe housing deprivation rate is defined as the percentage of the population living in a dwelling which is considered to be overcrowded, while also exhibiting at least one of the following housing deprivation measures: i) a leaking roof, ii) no bath/shower and no indoor toilet, and iii) considered too dark. The data stem from the EU Statistics on Income and Living Conditions (EU-SILC).
_new.png)
Source: Eurostat (online data codes: (sdg_11_11) and (ilc_mdho06d))
_new.png)
Source: Eurostat (sdg_11_11)
Population living in households suffering from noise

This indicator measures the share of the population who declare they are affected either by noise from neighbours or from the street. Because the assessment of noise pollution is subjective, it should be noted that the indicator accounts for both the levels of noise pollution as well as people’s standards of what level they consider to be acceptable. Therefore, an increase in the value of the indicator may not necessarily indicate a similar increase in noise pollution levels but also a decrease in the levels that European citizens are willing to tolerate and vice versa. In fact, there is empirical evidence that perceived environmental quality by individuals is not always consistent with the actual environmental quality assessed using ‘objective’ indicators, particularly for noise. The data stem from the EU Statistics on Income and Living Conditions (EU-SILC).
_new.png)
Source: Eurostat (online data codes: (sdg_11_20) and (ilc_mddw04))
_new.png)
Source: Eurostat (sdg_11_20)
Premature deaths due to exposure to fine particulate matter (PM2.5)
_evaluation_2023.png)
The indicator measures the number of premature deaths due to exposure to particulate matter. Fine particulates (PM2.5) are particulates whose diameter is less than 2.5 micrometres, meaning they can be carried deep into the lungs where they can cause inflammation and exacerbate the condition of people suffering heart and lung diseases. Premature deaths refer to those deaths that occur before the expected age of death. This expected age is typically defined by accounting for the life expectancy in the country, stratified by sex and age. The data stem from the European Environment Agency.
,_EU,_2005-2020_(number).png)
Source: EEA, Eurostat (sdg_11_52)
,_by_country,_2015_and_2020_(rate).png)
Source: EEA, Eurostat (sdg_11_52)
Road traffic deaths

This indicator measures the number of fatalities caused by road accidents, including drivers and passengers of motorised vehicles and pedal cycles, as well as pedestrians. Persons dying on road crashes up to 30 days after the occurrence of the crash are counted as fatalities. The data come from the CARE database managed by DG Mobility and Transport (DG MOVE).
.png)
Source: European Commission services, DG Mobility and Transport, Eurostat (sdg_11_40)
.png)
Source: European Commission services, DG Mobility and Transport, Eurostat (sdg_11_40)

Source: Eurostat (TRAN_R_ACCI)
Settlement area per capita

This indicator captures the amount of settlement area used for buildings, industrial and commercial areas, infrastructure and sports grounds, and includes both sealed and non-sealed surfaces.
_new.png)
_new.png)
Recycling rate of municipal waste

This indicator measures the tonnage recycled or prepared for re-use from municipal waste divided by the total municipal waste arising. Recycling includes material recycling, composting and anaerobic digestion. Municipal waste consists mostly of waste generated by households but may also include similar wastes generated by small businesses and public institutions and collected by the municipality. This latter part of municipal waste may vary from municipality to municipality and from country to country, depending on the local waste management system. For areas not covered by a municipal waste collection scheme the amount of waste generated is estimated.
.png)
Source: Eurostat (sdg_11_60)
.png)
Source: Eurostat (sdg_11_60)
Direct access to
More detailed information on EU SDG indicators for monitoring of progress towards the UN Sustainable Development Goals (SDGs), such as indicator relevance, definitions, methodological notes, background and potential linkages, can be found in the introduction of the publication ’Sustainable development in the European Union — Monitoring report on progress towards the SDGs in an EU context — 2023 edition’.
Further reading on sustainable cities and communities
- EEA (2022), Air Quality in Europe 2022, EEA Report no. 05/2022, Publications Office of the European Union, Luxembourg.
- Eurostat (2022), Eurostat regional yearbook 2022, Publications Office of the European Union, Luxembourg.
- Joint Research Centre (2021), Atlas of the Human Planet 2020, Publications Office of the European Union, Luxembourg.
- The Housing Europe (2022), The State of Housing in Europe 2022, Housing Europe, the European Federation for Public, Cooperative and Social Housing, Brussels.
- United Nations, Department of Economic and Social Affairs, Population Division (2018), The World’s Cities in 2018 — Data Booklet (ST/ESA/SER.A/417).
- UN-Habitat (2022), World Cities Report 2022: Envisaging the future of cities.
- WHO (2018), Global Status Report on Road Safety 2018.
- WHO Regional Office for Europe (2018), Environmental Noise Guidelines for the European Region.
Further data sources on sustainable cities and communities
Notes
- ↑ 2020 data. Source: Eurostat (online data codes: (ilc_lvho01) and (demo_gind)).
- ↑ Eurostat (2016), Urban Europe: Statistics on cities, towns and suburbs, Publications Office of the European Union, Luxembourg, p. 9.
- ↑ European Environment Agency (2019), Population exposure to environmental noise.
- ↑ Source: Eurostat (online data code: (sdg_11_20) and (demo_gind).
- ↑ Berglund, B., Lindvall, T., Schwela, D.H. (1999), Guidelines for Community Noise, World Health Organization (WHO), Geneva.
- ↑ European Environment Agency (2023), Noise pollution and health.
- ↑ WHO (2021), WHO global air quality guidelines: particulate matter (PM2.5 and PM10), ozone, nitrogen dioxide, sulfur dioxide and carbon monoxide, World Health Organization.
- ↑ For PM2.5, the Ambient Air Quality Directive 2008/50/EC introduced a target value to be attained by 2010, which became a limit value starting in 2015. For more information on EU air quality standards see: http://ec.europa.eu/environment/air/quality/standards.htm.
- ↑ European Commission (2022), Zero Pollution Monitoring and Outlook Report.
- ↑ European Environment Agency (2021), Air quality in Europe — 2021 report, EEA Report 15/2021, Copenhagen, and European Commission (2022), The Third Clean Air Outlook, COM/2022/673 final, Brussels.
- ↑ Degree of urbanisation classifies local administrative units as ‘cities’, ‘towns and suburbs’ or ‘rural areas’. In ‘cities’ at least 50 % of the population lives in an urban centre. If less than 50 % lives in an urban centre but more than 50 % of the population lives in an urban cluster it is classified as ‘towns and suburbs’, and if more than 50 % of the population lives outside an urban cluster it is classified as a ‘rural area’. An urban centre is a cluster of contiguous grid cells of 1 km2 with a density of at least 1 500 inhabitants per km2 and a minimum population of 50 000 people. An urban cluster is a cluster of contiguous grid cells of 1 km2 with a density of at least 300 inhabitants per km2 and a minimum population of 5 000 people.
- ↑ Source: Eurostat (online data code: (ilc_mdho06D)).
- ↑ Source: Eurostat (online data code: (ilc_mddw04)).
- ↑ Source: Eurostat (online data code: (ilc_mddw06)).
- ↑ Calculations based on European Commission (2018), A walk to the park? Assessing access to green areas in Europe’s cities.
- ↑ European Parliament, Directorate-General for Internal Policies of the Union; Lozzi, G., Ramos, C., Cré, I. (2022), Relaunching transport and tourism in the EU after COVID-19; Part VI, Public transport, European Parliament.
- ↑ Source: Eurostat (online data code: (tran_hv_psmod)).
- ↑ European Commission (2020), Road safety: Europe’s roads are getting safer but progress remains too slow.
- ↑ European Commission (2022), Road safety in the EU: fatalities in 2021 remain well below pre-pandemic level.
- ↑ European Commission (2021), European Road Safety Observatory: Annual statistical report on road safety in the EU 2020, p. 13.
- ↑ UN-Habitat (2016), Urbanization and Development: Emerging Futures, World Cities report 2016, pp. 85–100.
- ↑ EEA (2016), Land recycling in Europe: Approaches to measuring extent and impacts, EEA Report No 31/2016, European Environment Agency.
- ↑ Eurostat (2021), Statistics explained: Municipal waste statistics.
- ↑ European Commission (2018), Directive (EU) 2018/851 of the European Parliament and of the Council of 30 May 2018 amending Directive 2008/98/EC on waste (Text with EEA relevance).
- ↑ Source: Eurostat (online data code: (env_wasmun))