SDG 15 - Life on land
Protect, restore and promote sustainable use of terrestrial ecosystems, sustainably manage forests, combat desertification, and halt and reverse land degradation and halt biodiversity loss
Data extracted in April 2023.
Planned article update: June 2024.
Highlights

This article is a part of a set of statistical articles, which are based on the Eurostat publication ’Sustainable development in the European Union — Monitoring report on progress towards the SDGs in an EU context — 2023 edition’. This report is the seventh edition of Eurostat’s series of monitoring reports on sustainable development, which provide a quantitative assessment of progress of the EU towards the SDGs in an EU context.
SDG 15 seeks to protect, restore and promote the conservation and sustainable use of terrestrial ecosystems. This includes efforts to sustainably manage forests and halt deforestation, combat desertification, restore degraded land and soil, halt biodiversity loss and protect threatened species.
Full article
Life on land in the EU: overview and key trends
SDG 15 is one of the key goals at international level that addresses biodiversity and ecosystems. In the EU, this goal ensures that the health and functioning of terrestrial ecosystems and the delivery of ecosystem services remain a priority, especially in the face of global trends such as population growth, accelerating urbanisation and an increasing need for natural resources. Monitoring SDG 15 in an EU context focuses on trends in ecosystem status, land degradation and biodiversity. The EU has on average slightly moved away from SDG 15 objectives over the past few years. While the EU’s terrestrial protected areas and forest area have grown, recent trends for pollutant concentrations in EU rivers have been mixed. Indicators on species’ biodiversity show a long-term and continued decline in common birds and grassland butterflies in the EU.
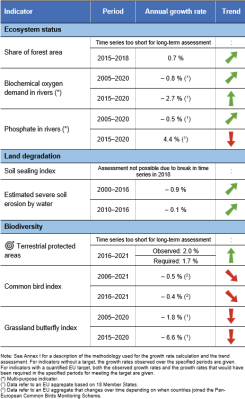
Table 1: Indicators measuring progress towards SDG 15, EU
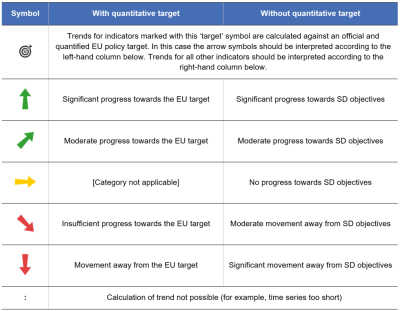
Table 2: Explanation of symbols for indicating progress towards SD objectives and targets


Ecosystem status
Humans greatly benefit from many ecosystem services, such as clean air, purified water and food provision. In addition, terrestrial ecosystems provide natural resources used in industrial processes and cultural services such as outdoor recreation. Other services that ecosystems offer include protection from natural disasters, such as flooding, and mitigation of the negative effects of climate change. Human activities that degrade ecosystems, including pollution and the overuse of resources, threaten animals and plants and, as a result, the provision of ecosystem services and their benefits to human wellbeing [1].
In 2019, the Intergovernmental Science-Policy Platform on Biodiversity and Ecosystem Services (IPBES) released a Global Assessment Report on Biodiversity and Ecosystem Services. The key findings of the report indicate that negative trends in biodiversity and ecosystem services are expected to hinder progress towards the 2030 Agenda and its SDGs. As such, current global conservation and sustainability goals will not be met unless transformative change is implemented. In 2021, the European Commission issued the report Accounting for ecosystems and their services in the European Union (INCA) which delivered an integrated system of ecosystem accounts for the EU. The report’s key findings suggest that between 2000 and 2018, changes in the extent of most ecosystem types have been small in relative terms. However, urban ecosystems have seen a significant increase in their extent, indicating a continued expansion of urbanised areas at the expense of semi-natural ecosystems and farmland. The report also suggests that sites in the Natura 2000 network tend to have a higher degree of ecosystem stability than those outside the network [2]. Reacting to the negative biodiversity trends, the 15th meeting of the Conference of Parties to the UN Convention on Biological Diversity (CBD-COP15) in December 2022 agreed on the ‘Kunming-Montreal Global Biodiversity Framework’ (GBF). The framework announced four long-term goals related to the 2050 Vision for Biodiversity and included 23 global biodiversity targets to be achieved by 2030. It adopted a global monitoring framework to observe the implementation.
Some types of terrestrial ecosystems (for example, wetlands, heathlands and scrub) and the pressures placed on them (such as invasive species, habitat fragmentation, and noise and light pollution) are not monitored in this report due to data shortcomings. It is therefore important to recognise the limitations in presenting a full and complete picture of Europe’s terrestrial ecosystems, the status of which cannot be fully assessed with the long-term datasets that are currently available.
Organic and phosphate pollution levels in EU rivers have been decreasing since 2000
The ecological status of European water bodies gives an important indication of how Europe’s natural environment is faring in the face of pressures from human use. Two indicators monitor progress in this area: biochemical oxygen demand in rivers and phosphate in rivers. While these indicators paint a somewhat favourable picture of the EU’s progress over the past 20 years in making rivers cleaner, the short-term developments have been less clear-cut.
Biochemical oxygen demand in rivers is an indicator of organic water pollution and the effectiveness of water treatment. When a high level of oxygen (O2) is required for the microbiological decomposition of organic compounds in water this means there is less O2 available for other river species. As such, biochemical oxygen demand provides an indication of a river system’s overall health. In 2020, the biochemical oxygen demand in EU rivers was 2.65 milligrams (mg) of O2 per litre (L) of water, representing a 21.1 % reduction from 3.36 mg/L in 2000. Between 2015 and 2020, 11 out of 16 reporting Member States saw reductions in BOD in their rivers, with the EU’s levels falling by 12.8 % over this period.
Phosphate (PO4) in rivers can originate from agricultural production, urban waste water and industrial discharges. Heavy loads of phosphate in rivers can harm the environment by causing biodiversity loss and water eutrophication. European phosphate concentrations have fallen by 17.2 % since 2000, reaching 0.072 mg/L in 2020. Overall, this reduction can be linked to the introduction of measures by national and European legislation, such as the Urban Waste Water Treatment Directive [3] and a switch to phosphate-free detergents [4].
Declines in phosphate concentrations in EU rivers, however, levelled off in 2011 and have even increased slightly in recent years. Between 2015 and 2020, phosphate concentrations in EU rivers increased by 24.1 %. This tendency may be related to slower reductions in phosphorus emissions from the agricultural sector [5] and a rise in phosphorus fertiliser consumption between 2008 and 2018 in some Member States [6]. Of all the reporting Member States, rivers in Finland and Sweden on average had the lowest concentrations of phosphate between 2015 and 2020. This is likely to be a result of their low population densities and high levels of waste water collection and treatment. In contrast, relatively high concentrations were found in some Member States with high population densities and/or intensive agriculture. The high and increasing short-term values observed, particularly in Bulgaria, Belgium and Lithuania, may lead to freshwater eutrophication [7].
The share of forest area in the EU is growing
Europe’s forests provide multiple benefits, such as enhancing soil fertility and conserving soil moisture, storing carbon and providing habitats for animals and plants. They also provide employment in rural areas and help mitigate climate change and regulate the microclimate. In 2018, forests and other wooded land covered 43.5 % of the EU’s total area. As a proportion of total land area, the EU’s share of forests and other wooded land increased slightly, by 0.9 percentage points, between 2015 and 2018.
Currently, forests are affected by pressures from habitat degradation and loss, invasive alien species, pollutants and excessive nutrient loads, as well as climate change [8], which has resulted in persistent droughts and heatwaves. This means that EU efforts to retain and sustainably manage its forested areas are increasingly important. According to the latest assessment of the State of Nature in the EU, only around 14 % of forest habitats at the EU level are in good conservation status, while the rest are in poor and bad conservation status. Nevertheless, the report shows that forest habitats have experienced the most improvement compared with other habitats.
Land degradation
Land degradation is linked to the long-term functionality and biological productivity of land or land-based ecosystems. It is a complex phenomenon bringing together several elements, including soil degradation and the capacity of land to support water resources, biodiversity and primary productivity [9]. Soil degradation by itself covers many aspects such as soil sealing and contamination, erosion by wind and water, loss of soil biodiversity, compaction, decline in organic matter, desertification, acidification and salination [10]. Not all of these threats to soil quality can be covered in this indicator set, so the analysis has been limited to imperviousness change and soil erosion by water.
Land take is continuing to increase in the EU
Land take is described as the process of transforming agricultural, forest and other semi-natural and natural areas into artificial areas. It often means an increase in settlement area over time, usually at the expense of agricultural areas. Land take can be monitored using the Copernicus CORINE land cover datasets, which have been published every six years since 2000. Net land take includes the 'reverse land take process', which occurs when artificial areas are returned to non-artificial land categories through recultivation and renaturalisation. According to data from the European Environment Agency (EEA), net land take in the EU amounted to 11 845 square kilometres (km2) between 2000 and 2018, equalling an average annual net land take of 658 km2. Even though the rate of net land take has fallen by more than 40 % over the three observation periods, there is still a long way to go to meet the ‘no net land take’ policy target for 2050.
Soil sealing is the most intense form of land take and is essentially an irreversible process. It destroys or covers soils with layers of partly or completely impermeable artificial material such as asphalt and concrete [11]. Increases in the area of sealed land can be used to estimate land-use change for human use or intensification. The area of sealed soil in the EU has increased in all Member States since 2006. Between 2006 and 2015, the total area covered with impervious materials grew by 2 983 km2 or 4.5 %. Between 2015 and 2018, it increased by 3.7 %. A substantial but unknown share of the increase is due to improvements in methodology and spatial resolution of the underlying remote-sensing data. According to the newest methodology, 1.8 % of the EU was covered with impervious materials in 2018.
In all three observation periods, EEA data show that agricultural areas were the most likely to be converted to artificial surfaces, reducing the amount of land available for food and feed production. This results in increased fragmentation and loss of natural habitats. Furthermore, artificial areas create plots that are isolated from functional ecosystems and can lead to increased flood risk and more frequent rapid surface run off [12]. Moreover, sealed lands cannot store carbon and thereby contribute to greenhouse gas emissions and climate change.
Fewer areas in the EU are now at risk of severe soil erosion by water
Soil is a resource that provides multiple benefits to society, including the provision of raw materials, food production, storage, filtration and the transformation of many substances, including water, carbon and nitrogen. Maintaining soil health ensures the continued provision of these benefits. While soil erosion by water poses the biggest threat to EU soils, multiple erosion processes, including water, tillage, wind and crop harvesting erosion contribute to soil degradation simultaneously or subsequently. Co-occurring processes may enhance and trigger each other or lead to self-reinforcing feedback loops, and thus enhance the severity of soil degradation [13].
Severe soil erosion by water is estimated to affect more than 5 % of the non-artificial erodible land area in the EU and is responsible for 52 % of total soil loss in Europe [14]. Overall, water erosion is the major cause of soil displacement, both quantitatively (51 % of the total displacement) and spatially (57 % of the total area). Tillage erosion is in second place (36 %), followed by wind erosion (10 %) and crop harvesting (2.7 %) [15].There are hotspots in some European regions, in particular in the Mediterranean and continental areas, mainly due to a combination of steep topography and high rainfall erosivity [16]. Modelling results up to 2070 show that water erosion could rise by up to two-thirds compared with today [17]. In addition, there are other erosion processes that can be attributed to about 40 % of the soil displacement in EU arable landscapes. Because of their ephemeral nature, these processes often occur almost unnoticed without leaving substantial geomorphic evidence but may act as a trigger and enhance soil degradation. Accordingly, new evidence suggests that countries such as Denmark and the Netherlands, which are generally considered to be little affected by soil erosion, are very prone to wind erosion risks [18].
However, efforts to address and mitigate soil erosion by water have helped to reduce the estimated EU land area at risk of severe soil erosion (soil loss of more than 10 tonnes per hectare per year) by water, from 198 607 km2 in 2010 to 196 853 km2 in 2016, equalling a decrease of 0.9 %. This represents a considerable slowdown compared with the period 2000 to 2010, when the estimated area at risk fell by 12.6 %.
Between 2010 and 2016, arable land experienced the greatest reduction in area at risk of soil erosion compared with other land types [19]. Here, improvements due to the implementation of agro-environmental standards under the Common Agricultural Policy (CAP) may have helped to reduce the mean rate of soil loss by water erosion. This includes the application of soil conservation practices such as reduced tillage, preservation of a minimum soil cover, reduction in the area of bare soils, contour farming along slopes, maintenance of terraces and stone walls, and extended use of grass margins [20].
Biodiversity
Terrestrial ecosystems have been protected under the Birds Directive since 1979 and the EU Habitats Directive since 1992. Both Directives form the main pillar for the protection of Europe’s biodiversity and ecosystems. Under these Directives, Member States are required to designate and manage Special Protection Areas (SPAs; Birds Directive) and Sites of Community Importance/Special Areas of Conservation (SCIs/SACs; Habitats Directive). These sites, collectively known as the Natura 2000 network, should enable protected habitats and species to reach favourable conservation status in the EU. The Natura 2000 network is complemented by nationally designated terrestrial protected areas that are established under each Member State’s national framework. The EU Biodiversity Strategy for 2030 includes a target for at least 30 % of EU land to be protected.
Despite an increase in protected areas, many terrestrial habitats and species in the EU have not reached ‘favourable conservation status’
In 2021, the EU and its Member States protected 1 074 254 km2 of terrestrial habitats, covering 26.0 % of the EU’s land area. This is an increase of almost 35 % compared with 2013, when only 798 550 km2, equalling 18.9 % of the EU’s area, were protected. Even though the designation of new protected areas has slowed in recent years, the EU appears to be on track to meet its 30 % target by 2030 if it can maintain the pace observed between 2016 and 2021. The Member States with the largest protected areas relative to country size in 2021 included Luxembourg (55.8 %), Bulgaria (41.0 %) and Slovenia (40.5 %). In contrast, the shares of protected areas were smallest in Finland (13.3 %) and Ireland (13.9 %).
The latest assessment of the State of Nature in the EU reveals that many species and habitats of European interest are still in unfavourable conservation status. The conservation status of habitats did not improve over the reporting period (2013–2018), but for species other than birds a slight improvement can be stated. Across the EU, about a quarter (27 %) of species assessments and 15 % of the habitat assessments show a good conservation status, compared with 23 % and 16 %, respectively, reported in the assessment from 2015. The majority of the assessments considered, however, have a poor or bad conservation status at EU level (63 % for species and 81 % for habitats). Moreover, a look at the trends reveals that only 6 % of species assessments and 9 % of habitat assessments showed improving trends in the reporting period, while 35 % and 36 % indicated a deteriorating trend at EU level, respectively.
The State of Nature report also shows that fish and molluscs continue to have a particularly high proportion of species (around 30 % each) with a bad conservation status, while reptiles and vascular plant species have the highest proportion of good conservation status (36 % and 40 % respectively). Habitats in dunes, bogs, mires and fens have the highest share of assessments showing a bad conservation status (around 50 % each). Grasslands, which contain some species-rich habitats that are particularly suitable for pollinator species, also have one of the highest proportions of bad conservation status assessments (49 %).
Common birds and grassland butterflies are in long-term decline in the EU
Changes in land use and overuse of ecosystems can harm biodiversity. Because biodiversity supports all ecosystem functions and contributes to their capacity to provide ecosystem services [21], it needs to be monitored so it can be preserved and restored. Birds are sensitive to both human-induced and natural environmental change, making them good indicators of wider ecosystem health. Their widespread and diverse habitats also make them ideal for monitoring the results of conservation efforts.
The EU common bird index tracks the population abundance and diversity of a selection of common bird species in the EU, further typified by common forest and common farmland bird species. The index shows an 11.8 % decline of common birds and a dramatic 35.9 % fall in the abundance of common farmland birds between 1990 and 2021. Common forest birds have declined slightly, with their index falling 4.7 % over the whole period. The decline in common farmland birds has largely been attributed to agricultural intensification, which has reduced natural nesting habitats such as hedges, wetlands, meadows and fallow fields. Agro-chemicals, such as pesticides, and changes in ploughing times for cereals have also affected common farmland birds, disrupting their breeding and reducing available food sources, in particular insect populations [22]. Shorter-term trends show a continued decline for all common birds and common farmland bird populations. For all common birds there has been a 6.8 % decline since 2006 and a 2.2 % decline since 2016, while common farmland birds continued to show an even stronger decline, by 20.2 % since 2006 and 7.8 % since 2016.
Butterflies, which are among the most common plant pollinators, are well suited to act as signals of environmental and habitat health. They occur in a wide range of habitat types and are sensitive to environmental change. The SPRING (Strengthening Pollinator Recovery through INdicators and monitorinG) and ABLE (Assessing Butterflies in Europe) projects have generated a butterfly indicator for widespread species of grassland butterflies.
The grassland butterfly index is based on data from 18 Member States, measuring the population trends of 17 butterfly species within the national Butterfly Monitoring Schemes [23]. According to estimates from these monitoring efforts, butterfly populations declined by 29.5 % between 1991 and 2020, signifying a dramatic loss of grassland biodiversity. While moderate climate warming aided a temporary increase in butterfly populations between 2002 and 2012, the increasing frequency of extreme temperatures led to even stronger declines in the subsequent years [24]. Overall, grassland butterfly populations thus fell by 24.3 % between 2005 and 2020, and by 28.9 % between 2015 and 2020. The main causes for this decline can be attributed to land use changes in rural areas, in particular stemming from intensification of agricultural grasslands, and deposition of nitrogen in protected areas, mainly in North-western Europe. In the rest of Europe, grassland abandonment is a threat [25]. Butterflies show a decline in non-urban areas but they have been stable within urban areas across Europe, suggesting that parks and other green parts of the urban environment are becoming increasingly suitable and are being managed in a butterfly-friendly way. However, the situation of butterflies in urban areas requires further research, as different studies offer contrasting findings [26].
Presentation of the main indicators

This indicator measures the proportion of forest ecosystems in comparison to the total land area. Data used for this indicator is derived from the Land Use and Cover Area frame Survey (LUCAS). The LUCAS land use and land cover classification has been adapted to FAO forest definitions, distinguishing between the categories 'forests' and 'other wooded land' [27].
_new2.png)
_new2.png)
Source: Eurostat (sdg_15_10)
Soil sealing index

This indicator estimates the increase in sealed soil surfaces with impervious materials due to development and construction (such as buildings, constructions and laying of completely or partially impermeable artificial material, such as asphalt, metal, glass, plastic or concrete). This provides an indication of the rate of soil sealing, which occurs when there is a change in land use towards artificial and urban land use [28]. The indicator builds on data from the Imperviousness High Resolution Layer (a product of the Copernicus Land Monitoring Service).
_new2.png)
_new2.png)
Estimated severe soil erosion by water

This indicator estimates the area potentially affected by severe erosion by water such as rain splash, sheet-wash and rills (soil loss greater than 10 tonnes/hectare/year). This area is expressed in square kilometres (km2) and as a percentage of the total non-artificial, erodible area in the country. These numbers are estimated from soil-erosion susceptibility models and should not be taken as measured values. Data presented in this section stem from the JRC’s soil erosion database.
_new2.png)
Source: Joint Research Centre, Eurostat (sdg_15_50)
.png)
Source: Joint Research Centre, Eurostat (sdg_15_50)

Source: Eurostat (AEI_PR_SOILER)
Terrestrial protected areas

This indicator measures the extent of terrestrial protected areas, comprising nationally designated protected areas and Natura 2000 sites. A nationally designated area is an area protected by national legislation. The Natura 2000 network comprises both marine and terrestrial protected areas designated under the EU Habitats and Birds Directives with the goal to maintain or restore a favourable conservation status for habitat types and species of EU interest. The EU biodiversity strategy aims to protect at least 30 % of land and sea in Europe including both nationally designated sites and Natura 2000 sites. Data provided by the Member States to the Commission are consolidated at least yearly by the European Environment Agency and the European Topic Centre on Biological Diversity (EEA ETC/BD) and collected by European Commission Directorate-General for the Environment.
.png)
Source: EEA, Eurostat (sdg_15_20)
.png)
Source: EEA, Eurostat (sdg_15_20)
Common bird index

This indicator is an index integrating the abundance and diversity of a selection of common bird species associated with specific habitats for feeding and nesting. Rare species are excluded, although some species common in certain Member States may be considered rare in others. Three groups of bird species are represented: common farmland species (39 species), common forest species (34 species) and all common bird species (168 species; including farmland species, forest species and common generalists’ species). The indices are presented for EU-aggregates only and with smoothed values. The index draws from data produced by the European Bird Census Council and its Pan-European Common Bird Monitoring Scheme programme. Data coverage has increased from nine to 25 EU Member States over the period 1990 to 2014, with 26 countries covered as of the reference year 2015 [29].
.png)
Source: European Bird Census Council (EBCC)/BirdLife/Statistics Netherlands, Eurostat (sdg_15_60)
Grassland butterfly index

This indicator measures the population trends of 17 butterfly species at EU-level. The index is presented as an EU-aggregate only and with smoothed values. The indicator is based on data from 18 EU Member States (Austria, Belgium, Czechia, Estonia, Finland, France, Germany, Hungary, Ireland, Italy, Latvia, Lithuania, Luxembourg, the Netherlands, Romania, Slovenia, Spain, Sweden), but with a limited number of long time-series available [30]. The data are integrated and provided by the Butterfly Conservation Europe, European Butterfly Monitoring Scheme partnership, SPRING project. For technical details see the European Grassland Butterfly Indicator 1990–2020 report.
.png)
Source: Butterfly Conservation Europe, European Butterfly Monitoring Scheme partnership, SPRING project, Eurostat (sdg_15_61)
Direct access to
More detailed information on EU SDG indicators for monitoring of progress towards the UN Sustainable Development Goals (SDGs), such as indicator relevance, definitions, methodological notes, background and potential linkages, can be found in the introduction of the publication ’Sustainable development in the European Union — Monitoring report on progress towards the SDGs in an EU context — 2023 edition’.
Further reading on life on land
- Butterfly Conservation Europe (BCE)
- Díaz et al. (2019), Summary for policymakers of the global assessment report on biodiversity and ecosystem services of the Intergovernmental Science-Policy Platform on biodiversity and Ecosystem Services (IPBES).
- EEA (2020), State of nature in the EU. Results from reporting under the nature directives 2013–2018, Publications Office of the European Union, Luxembourg.
- EEA (2020), The European Environment – state and outlook 2020, Luxembourg: Publications Office of the European Union.
- FOREST EUROPE, 2020, State of Europe’s Forests 2020.
- FAO and UNEP (2021). Global Assessment of Soil Pollution: Report. Rome.
- Maes et al (2021), EU Ecosystem Assessment, EUR 30599 EN, Publications Office of the European Union, Luxembourg.
- Panagos et al. (2020), Soil related indicators to support agri-environmental policies, Publications Office of the European Union, Luxembourg.
- PECBMS (2023), Report on the Pan-European Common Bird Monitoring Scheme, February 2023.
- UN (2021), System of Environmental-Economic Accounting—Ecosystem Accounting, Committee of Experts on Environmental-Economic Accounting.
- Van Swaay et al. (2022), European Grassland Butterfly Indicators 1990–2020, Technical report, Butterfly Conservation Europe & ABLE/eBMS
- EEA (2023), European forest ecosystems: key allies in sustainable development
Further data sources on life on land
- EEA, Conservation status of species under the EU Habitats Directive.
- EEA, Forest: growing stock, increment and fellings.
- EEA, Conservation status of habitats under the EU Habitats Directive.
- EEA, Land take and net land take, indicator dashboard.
- EEA, Land cover and change statistics 2000-2018, dashboard.
- European Commission, European Soil Data Centre (ESDAC): Soil Threats Data.
Notes
- ↑ Diaz et al. (2019), Summary for policymakers of the global assessment report on biodiversity and ecosystem services of the Intergovernmental Science-Policy Platform on biodiversity and Ecosystem Services.
- ↑ Vysna et al. (2021), Accounting for ecosystems and their services in the European Union (INCA), Final report from phase II of the INCA project aiming to develop a pilot for an integrated system of ecosystem accounts for the EU, Statistical report, Publications office of the European Union, Luxembourg.
- ↑ Council of the European Communities (1991), Directive 91/271/EEC concerning urban waste water treatment.
- ↑ European Environment Agency (2022), Nutrients in freshwater in Europe.
- ↑ Ibid.
- ↑ Eurostat (2022), Statistics Explained, Agri-environmental indicator — mineral fertiliser consumption.
- ↑ European Environment Agency (2022), Nutrients in freshwater in Europe.
- ↑ European Environment Agency (2016), European forest ecosystems — State and trends, EEA Report No 5/2016, Copenhagen.
- ↑ European Environment Agency (2016), The direct and indirect impacts of EU policies on land, EEA Report No 8/2016, Copenhagen. European Environment Agency (2019), Land degradation knowledge base: policy, concepts and data, European Topic Centre on Urban, Land and Soil Systems (ETC/ULS) Report No 1/2019, Vienna.
- ↑ European Commission (2012), The implementation of the Soil Thematic Strategy and ongoing activities, COM(2012) 46 final; FAO (2015), Status of the World’s Soil Resources, Food and Drug Administration, Rome, Food and Agriculture Organization of the United Nations.
- ↑ Prokop G, Jobstmann H, Schonbauer A (2011), Report on best practices for limiting soil sealing and mitigating its effects, European Commission, Brussels.
- ↑ European Environment Agency (2017), Landscapes in transition: An account of 25 years of land cover change in Europe, EEA Report No 10/2017.
- ↑ Borrelli et al. (2022), Policy implications of multiple concurrent soil erosion processes in European farmland, Nature Sustainability, Volume 6, January 2023, 103–112.
- ↑ Panagos et al. (2015), The new assessment of soil loss by water erosion in Europe, Environmental Science & Policy 54, 438–447.
- ↑ Borrelli et al. (2020), Land use and climate change impacts on global soil erosion by water (2015-2070), PNAS September 8, 2020 117 (36) 21994–22001.
- ↑ Borrelli et al. (2022), Policy implications of multiple concurrent soil erosion processes in European farmland, Nature Sustainability, Volume 6, January 2023, 103–112.
- ↑ Panagos et al. (2020), A soil erosion indicator for supporting agricultural, environmental and climate policies in the European Union, Remote Sensing 12 (9), p. 1365.
- ↑ Panagos et al. (2020), A soil erosion indicator for supporting agricultural, environmental and climate policies in the European Union, Remote Sensing 12 (9), p. 1365; and Panagos et al. (2016), Soil conservation in Europe: wish or reality? Land Degrad. Dev., 27, pp. 1547–1551.
- ↑ European Commission (2020), EU Biodiversity Strategy for 2030 — Bringing nature back into our lives, COM(2020) 380 final.
- ↑ Greshko, M. (2018), Around the World, Farmland Birds Are in Steep Decline, National Geographic.
- ↑ Van Swaay, C.A.M., Dennis, E.B., Schmucki, R., Sevilleja, C.G., Åström, S., Balalaikins, M., Barea-Azcón, J.M. , Bonelli, S., Botham, M., Cancela, J.P., Collins, S., De Flores, M., Dapporto, L., Dopagne, C., Dziekanska, I., Escobés, R., Faltynek Fric, Z., Fernández-García, J.M., Fontaine, B., Glocovcan. P., Gracianteparaluceta, A., Harpke, A., Harrower, C., Heliölä, J., Houard, X., Kolev, Z., Komac, B., Kühn, E., Kuussaari, M., Judge, M., Lang, A., Lysaght, L., Maes, D., McGowan,D., Mestdagh, X., Middlebrook, I., Monasterio, Y., Monteiro, E., Munguira, M.L., Musche, M., Olivares, F.J., Õunap, E., Ozden, O., Pavlíčko, A., Pendl, M., Pettersson, L.B., Rákosy, L., Roth, T., Rüdisser, J., Šašić, M., Scalercio, S., Settele, J., , Sielezniew, M., Sobczyk-Moran, G., Stefanescu, C., Švitra, G., Szabadfalvi, A., Tiitsaar, A., Titeux, N., Tzirkalli, E., Ubach, A., Verovnik, R., Vray, S., Warren, M.S., Wynhoff, I., & Roy, D.B. (2022), European Grassland Butterfly Indicator 1990-2020 Technical report. Butterfly Conservation Europe & SPRING/eBMS & Vlinderstichting report VS2022.039.
- ↑ Ibid.
- ↑ Ibid.
- ↑ Van Swaay, et al., (2020), Assessing Butterflies in Europe — Butterfly Indicators 1990–2018, Technical report, Butterfly Conservation Europe & ABLE/eBMS (www.butterfly-monitoring.net).
- ↑ Eurostat (2019), Statistics Explained, LUCAS — Land use and land cover survey.
- ↑ European Environment Agency (2020), Imperviousness and imperviousness change.
- ↑ Eurostat (2020), Metadata Biodiversity (env_biodiv).
- ↑ Van Swaay, C.A.M., Dennis, E.B., Schmucki, R., Sevilleja, C.G., Åström, S., Balalaikins, M., Barea-Azcón, J.M. , Bonelli, S., Botham, M., Cancela, J.P., Collins, S., De Flores, M., Dapporto, L., Dopagne, C., Dziekanska, I., Escobés, R., Faltynek Fric, Z., Fernández-García, J.M., Fontaine, B., Glocovcan. P., Gracianteparaluceta, A., Harpke, A., Harrower, C., Heliölä, J., Houard, X., Kolev, Z., Komac, B., Kühn, E., Kuussaari, M., Judge, M., Lang, A., Lysaght, L., Maes, D., McGowan,D., Mestdagh, X., Middlebrook, I., Monasterio, Y., Monteiro, E., Munguira, M.L., Musche, M., Olivares, F.J., Õunap, E., Ozden, O., Pavlíčko, A., Pendl, M., Pettersson, L.B., Rákosy, L., Roth, T., Rüdisser, J., Šašić, M., Scalercio, S., Settele, J., , Sielezniew, M., Sobczyk-Moran, G., Stefanescu, C., Švitra, G., Szabadfalvi, A., Tiitsaar, A., Titeux, N., Tzirkalli, E., Ubach, A., Verovnik, R., Vray, S., Warren, M.S., Wynhoff, I., & Roy, D.B. (2022), European Grassland Butterfly Indicator 1990-2020 Technical report. Butterfly Conservation Europe & SPRING/eBMS & Vlinderstichting report VS2022.039.