SDG 6 - Clean water and sanitation
Ensure availability and sustainable management of water and sanitation for all
Data extracted in April 2023.
Planned article update: June 2024.
Highlights

This article is a part of a set of statistical articles, which are based on the Eurostat publication ’Sustainable development in the European Union — Monitoring report on progress towards the SDGs in an EU context — 2023 edition’. This report is the seventh edition of Eurostat’s series of monitoring reports on sustainable development, which provide a quantitative assessment of progress of the EU towards the SDGs in an EU context.
SDG 6 calls for ensuring universal access to safe and affordable drinking water, sanitation and hygiene, and ending open defecation. It also aims to improve water quality and water-use efficiency and to encourage sustainable abstractions and supply of freshwater.
Full article
Clean water and sanitation in the EU: overview and key trends
Access to water is a basic human need. Provision of drinking water and sanitation services is a matter of public and environmental health in the EU. Clean water in sufficient quantity is also of paramount importance for agriculture, industry and the environment and plays a crucial role in providing climate-related ecosystem services. Monitoring SDG 6 within an EU context focuses on sanitation, water quality and water scarcity. While the EU has made further progress on access to sanitation, trends for water quality have been mixed over the assessed five-year period, with concentrations of some surface and groundwater pollutants rising. Similarly, despite an overall positive long-term trend, developments regarding water scarcity have been mixed, with seasonal variations and a slight decline in recent years that can be attributed to more frequent and severe drought events.
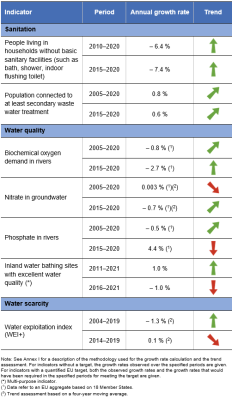
Table 1: Indicators measuring progress towards SDG 6, EU
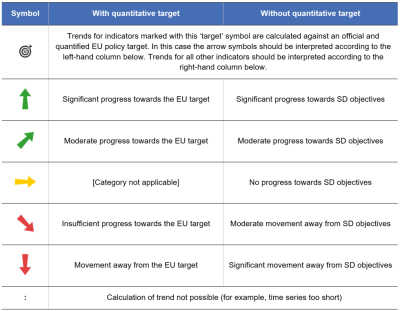
Table 2: Explanation of symbols for indicating progress towards SD objectives and targets


Sanitation
Provision of drinking water and the adequate treatment of sewage are matters of public and environmental health. As a vital resource, water is considered a public good in the EU. Water utilities are subject to strict regulation regarding the quality and efficiency of services. The indicators chosen to monitor sanitation are the share of the population having neither a bath, nor a shower, nor indoor flushing toilet in their household and the share of the population connected to at least secondary waste water treatment.
Most EU citizens have access to basic sanitation and are connected to secondary waste water treatment
Overall, connection rates and the quality of water services in the EU were already high more than 10 years ago, and have continued to improve. The share of the population without a bath, shower, or indoor flushing toilet in their household fell from 2.2 % in 2015 to 1.5 % in 2020. Data also show that the share of the EU population connected to secondary waste water treatment has increased continuously since 2000, reaching 81.1 % in 2020. Conventional primary waste water treatment mainly removes suspended solids and only reduces organic water pollution by 20–30 %. Secondary treatment processes, which are typically applied after primary treatment, remove about 70 % of organic pollution. Growth in the share of people connected to secondary treatment indicates that the Urban Waste Water Treatment Directive, which was first implemented in the 1990s, has helped to reduce pollution and improve water quality in Europe’s rivers, lakes and coastal waters. The ongoing revision of the Directive will bring additional improvements not only for water quality but also for access to sanitation.
Different levels of access to water services and sanitation persist between Member States
Almost every household in the EU had basic sanitary facilities in 2020, and most countries reported that less than 1 % of their population were still living in households without a bath, shower or a flushing toilet. However, in some countries, this share remains comparatively high. In particular, Romania reported figures far above all other Member States, with 21.2 % of the population not having access to basic sanitary facilities in 2020. Relatively high shares were also reported by Lithuania, Bulgaria and Latvia with values between 6.4 % and 7.0 % in the same year. These figures highlight the strong link between access to basic sanitary facilities and poverty, which can be seen across the EU. In 2020, 5.1 % of poor people in the EU lacked access to a bath, shower or toilet in their households, compared with only 0.8 % of those living above the poverty threshold.
Connection to secondary waste water treatment is another important facility for enhancing access to sanitation. Connection rates have increased slowly but continuously across the EU, with 81.1 % of the EU population connected in 2020. This is almost 10 percentage points higher than in 2005, when the connection rate was 71.8 %. Between 2015 and 2020, connection rates increased in almost all reporting Member States. The lowest-scoring countries were in south-east Europe. It is important to note that connection rates are not expected to reach 100 % in most cases because connection costs can be disproportionately high in some areas, in particular for rural areas with a low population density. The Urban Waste Water Treatment Directive only obliges bigger agglomerations to introduce secondary treatment, while requiring smaller agglomerations to apply an appropriate treatment (when waste water is collected) or other alternative solutions to reach the same level of protection for water bodies. However, the Commission’s proposal to review the Urban Waste Water Treatment Directive suggests making this obligation applicable for smaller agglomerations too.
Water quality
Diffuse pollution by agriculture, accidental spillage of harmful substances and discharge of untreated or insufficiently treated domestic and industrial waste water, as well as atmospheric deposition of pollutants such as mercury, can pose a threat to human and environmental health. These pressures, along with changes to the structure and flow of water bodies, pose a barrier to sustainable development. Water quality monitoring distinguishes between different kinds of chemical pollution such as organic pollution by nutrients, pesticides and pathogens. In this report, water quality is monitored through four indicators looking at nutrients in freshwater and at bathing water quality [1].
Improved waste water treatment has reduced organic pollution in European rivers
Heavy organic pollution, caused by municipal waste water and effluents from industry or livestock, can lead to the deoxygenation of water, killing fish and invertebrates. Thanks to improved waste water collection and treatment, as well as mature treatment, organic pollution in European rivers has been declining, though the trend has slowed in recent years. A proxy for organic water pollution is the amount of oxygen needed for microbes to digest organic pollution under standard conditions, expressed as biochemical oxygen demand (BOD). BOD values of rivers in Europe range from less than 1 milligram per litre (mg/L) (very clean) to more than 15 mg/L (heavily polluted).
Available data for 18 Member States show an overall decline in BOD in EU rivers, from 3.0 mg/L in 2005 to 2.7 mg/L in 2020. The trend, however, has not been continuous. While BOD levels were showing a downward trend up to 2010, they had climbed back to 3.0 mg/L by 2015 before falling again. Recently, there has been a small increase from 2.6 mg/L in 2019 to 2.7 mg/L in 2020. Overall, BOD levels in EU rivers have fallen by 10.8 % since 2005 and by 12.8 % since 2015. The overall decrease in BOD values is mainly linked to a general improvement in waste water collection and treatment throughout Europe.
Eutrophication is still a major issue for Europe’s aquatic environment
An assessment of European waters published by the European Environment Agency (EEA) in 2018 concludes that although nutrient pollution has fallen since the 1990s, it is still the main reason why 28 % of EU surface water bodies have not achieved good water quality [2]. In some regions, pollution of rivers with nitrate/ammonia (N) and phosphorous (P) is still causing severe eutrophication in coastal waters. Eutrophication can lead to algal blooms and oxygen depletion of surface waters, which in turn can harm fish, invertebrates and whole ecosystems.
The main sources of nutrient inputs are the use of fertilisers and animal waste in agriculture, as well as poorly treated waste water from industry [3]. Nitrates (NO3), among other chemicals, can infiltrate and contaminate groundwater bodies. They are the most common cause of poor chemical status of groundwater in the EU — 18 % of groundwater bodies by area across 24 Member States are in poor status because of nitrates [4]. This is particularly problematic because groundwater is an important source of drinking water in Europe.
Data on nitrate concentrations in EU groundwater are available for 18 Member States. They show a long-term stagnation of NO3 concentrations at around 23 milligrams per litre (mg/L), with a slight downward trend in 2019 and 2020. Due to annual fluctuations in the data, a smoothed four-year average is used to better depict the trend over time. This shows a 3.2 % decrease in the average EU nitrate concentrations between 2015 and 2020. Additionally, between 2016 and 2019, 14.1 % of groundwater stations showed NO3 concentrations above the threshold considered unfit for drinking, which is set at 50 mg/L by the Nitrates Directive [5]. The comparatively small changes at European level do not mean that overall groundwater nitrate concentrations remain stable, but rather that there are groundwater bodies in Europe with both increasing and decreasing trends [6].
Data on phosphate (PO4) concentrations in EU rivers are available for 18 Member States. They show a marked improvement between 2007 and 2013, after which, however, the trend levelled off and even started increasing again. Thus, while the phosphate concentration of 0.072 mg/L recorded in 2020 is considerably below the values reported in the early 2000s of around 0.087 mg/L, it is 24.1 % higher than in 2015. The overall positive long-term trend is to some extent the result of measures implemented under the Urban Waste Water Treatment Directive over the past 30 years, especially the introduction of phosphate-free detergents [7]. The recent turnaround may be related to the slower decrease in phosphorus emissions from the agricultural sector as well as increasing phosphorus fertiliser consumption at EU level [8].
The share of inland bathing waters with excellent water quality has fallen in recent years
Contamination of water by faecal bacteria continues to pose a risk to human health. This is especially the case when it is found at bathing water sites, where it can cause illness among swimmers. Overall, the share of inland water bathing sites with excellent water quality in the EU increased between 2011 and 2017, followed by a decline until 2020 and a slight improvement in 2021. The downward trend has been caused by a stagnation in the absolute number of bathing sites with excellent water quality, while the total number of bathing sites included in the assessment rose. According to the latest European Environment Agency (EEA) data, 78.2 % of inland water bathing sites showed excellent bathing water quality in 2021, compared with 82.1 % five years earlier and 77.7 % in 2020. The major sources of bathing water pollution are sewage and water draining from farmland. Such pollution increases during heavy rains and floods which wash sewage overflow and polluted drainage water into rivers and seas.
Water scarcity
SDG 6 also focuses on the sustainable use of freshwater resources and on reducing water stress. The regionalised water exploitation index (WEI+) aims to illustrate the pressure on renewable freshwater resources due to water demand, which is largely affected by population trends and socio-economic developments; and climate conditions, which control the availability of renewable freshwater resources. Due to a change in the reference database for the WEI+, the data presented in this report are not comparable to those shown in previous editions.
Water stress is low in most EU countries, but shows strong seasonal and local variability
Water stress occurs when water demand exceeds the available water resources at a specific place and time. Water scarcity is generally considered to occur when the ratio of water abstraction to long-term average available water resources exceeds 20 %, while ratios above 40 % indicate severe water scarcity, meaning the use of freshwater resources is unsustainable [9]. Using a four-year smoothed average shows that the EU’s WEI+ decreased by 0.9 index points over the past 15 years, from 5.0 % in 2004 to 4.1 % in 2019. Between 2014 and 2019, however, the WEI+ has stagnated at this level. A look at the annual figures shows that the change in the EU’s WEI+ was not constant but varied both annually and between Member States. Apart from socio-economic developments, the recent stagnation can be attributed to more frequent and severe droughts, which have affected water availability in an increasingly larger area in the EU [10].
In 2019, Cyprus showed severe water stress with a mean annual WEI+ of 113 %, while Malta showed water stress with a mean annual WEI+ of around 30 %. However, annual national values can mask regional and seasonal water stress, which is in fact common in many European regions [11]. In 2019, almost a third (29 %) of the EU territory, excluding Italy, was affected by water scarcity conditions in at least one quarter of the year, with WEI+ values of above 20 % [12].
Water scarcity is more common in southern Europe, where about 30 % of the population lives in areas with permanent water stress and up to 70 % of the population in areas with seasonal water stress during summer [13] caused mainly by abstractions from agriculture, public water supply and tourism [14]. However, water scarcity also affects river basins in other parts of the EU, particularly in western Europe, where it is caused primarily by high population densities in urban areas, combined with high levels of abstraction for public water supply, energy and industry [15].
Presentation of the main indicators
People living in households without basic sanitary facilities (such as bath, shower, indoor flushing toilet)

This indicator reflects the share of total population having neither a bath, nor a shower, nor an indoor flushing toilet in their household. Data presented in this section stem from the EU Statistics on Income and Living Conditions (EU-SILC).
.png)
Source: Eurostat (sdg_06_10)
.png)
Source: Eurostat (sdg_06_10)
Population connected to at least secondary wastewater treatment

This indicator measures the percentage of the population connected to waste water treatment systems with at least secondary treatment. Thereby, waste water from urban or other sources is treated by a process generally involving biological treatment with a secondary settlement or other process that removes organic material and reduces its biochemical oxygen demand (BOD) by at least 70 % and chemical oxygen demand (COD) by at least 75 %. Data presented in this section stem from the Water Statistics of the European Statistical System (ESS).
.png)
Source: Eurostat (sdg_06_20)
.png)
Source: Eurostat (sdg_06_20)
Biochemical oxygen demand in rivers

This indicator measures the mean annual five-day biochemical oxygen demand (BOD5) in rivers, weighted by the number of measuring stations. BOD5 is a measure of the amount of oxygen that aerobic microorganisms need to decompose organic substances in a water sample over a five-day period in the dark at 20 °C. High BOD5 values are usually a sign of organic pollution, which affects water quality and the aquatic environment. Organic pollution caused by discharges from waste water treatment plants, industrial effluents and agricultural run-off increase BOD. The cleanest rivers have a five-day BOD of less than 1 milligram per litre (mg/L). Moderately polluted rivers show values ranging from 2 to 8 mg/L. Data presented in this section stem from the EEA Waterbase database on the status and quality of Europe's rivers.
.png)
Source: EEA (Eurostat (sdg_06_30))
.png)
Source: EEA (Eurostat (sdg_06_30))
Nitrate in groundwater

This indicator refers to concentrations of nitrate (NO3) in groundwater measured as milligrams per litre (mg NO3/L). Data are taken from well samples and aggregated to annual average concentrations for groundwater bodies in Europe. Only complete series after inter/extrapolation are included. The indicator is relatively robust in presenting the overall trend in water quality, however, the distribution of measuring stations over groundwater bodies might mask exceedances of nitrate levels in certain polluted areas. The data stem from the EEA Waterbase database on the status and quality of Europe's rivers.
.png)
Source: EEA (Eurostat (sdg_06_40))
.png)
Source: EEA (Eurostat (sdg_06_40))
Phosphate in rivers

This indicator measures the concentration of phosphate (PO4) per litre in the dissolved phase from water samples from river stations and aggregated to annual average values. At high concentrations phosphate can cause water quality problems, such as eutrophication, by triggering the growth of aquatic plants including algae. The data stem from the EEA Waterbase database on the status and quality of Europe's rivers.
.png)
.png)
Source: EEA (Eurostat (sdg_06_50))
Water exploitation index (WEI+)
_evaluation_2023.PNG)
The regionalised water exploitation index (WEI+) measures total water consumption as a percentage of the renewable freshwater resources available for a given territory and period. It quantifies how much water is abstracted monthly or seasonally and how much water is returned before or after use to the environment via river basins (for example, leakages and discharges by economic sectors) [16]. The difference between water abstractions and water returns is regarded as ‘water consumption’. In the absence of Europe-wide agreed formal targets, values above 20 % are generally considered to be a sign of water scarcity, while values equal or greater than 40 % indicate situations of severe water scarcity [17], meaning the use of freshwater resources is unsustainable. Annual calculations of the WEI+ at national level do not reflect uneven spatial and seasonal distribution of resources and may therefore mask water stress which occurs on a seasonal or regional basis. The indicator is a result of data modelling by the EEA based on data from the WISE SoE-Water quantity database (WISE 3) and other open sources (JRC, Eurostat, OECD, FAO) and including gap filling methods.
,_EU,_2000-2019_(%25_of_renewable_water_resources).png)
Source: EEA (Eurostat (sdg_06_60))
,_by_country,_2014_and_2019_(%25_of_renewable_water_resources).png)
Source: EEA (Eurostat (sdg_06_60))
Direct access to
More detailed information on EU SDG indicators for monitoring of progress towards the UN Sustainable Development Goals (SDGs), such as indicator relevance, definitions, methodological notes, background and potential linkages, can be found in the introduction of the publication ’Sustainable development in the European Union — Monitoring report on progress towards the SDGs in an EU context — 2023 edition’.
Further reading on clean water and sanitation
- EEA (2017), Emissions of pollutants to Europe’s waters — sources, pathways and trends, ETC/ICM Report 3/2017, European Environment Agency, Copenhagen.
- EEA (2018), European waters — Assessment of status and pressures 2018, ETC/ICM Report No 7/2018, European Environment Agency, Copenhagen.
- EEA (2019), The European environment — State and outlook 2020, Chapter 4: Freshwater, European Environment Agency, Copenhagen.
- Fitness Check - SWD(2019)439 - web.pdf European Commission (2019), Commission Staff Working Document, Fitness Check of the Water Frameowrk Directive, Groundwater Directive, Environmental Quality Standards Directive and Floods Directive, SWD(2019) 439, Brussels.
- European Commission (2019), Commission Staff Working Document — Executive summary of the fitness check of the WFD, GWD and EQSD, SWD(2019) 440, Brussels.
- European Commission (2019), Report from the Commission to the European Parliament and the Council on the implementation of the Water Framework Directive (2000/60/EC) and the Floods Directive (2007/60/EC), COM(2019) 95, Brussels.
- European Commission (2019), Integrated Assessment of the 2nd River Basin Management Plans. EU-wide storyline report, Brussels.
- UN Water (2018), SDG 6 Synthesis Report 2018 on Water and Sanitation.
- EEA (2021), Water resources across Europe — confronting water stress: an updated assessment. ETC/ICM Report 12/2021, European Environment Agency, Copenhagen.
- EEA (2021), Drivers of and pressures arising from selected key water management challenges. A European overview, ETC/ICM Report 9/2021, European Environment Agency, Copenhagen.
Further data sources on clean water and sanitation
Notes
- ↑ Chemical water quality is not evaluated in this report because of a lack of a comprehensive series of suitable data.
- ↑ European Environment Agency (2018), European waters — Assessment of status and pressures 2018 , EEA Report No 7/2018, p. 63.
- ↑ European Environment Agency (2017), Emissions of pollutants to Europe’s waters — sources, pathways and trends, ETC/ICM report, p. 17.
- ↑ European Environment Agency (2018), European waters — Assessment of status and pressures 2018, EEA Report No 7/2018, p. 52.
- ↑ European Commission (2021), Report from the Commission to the Council and the European Parliament on the implementation of Council Directive 91/676/EEC concerning the protection of waters against pollution caused by nitrates from agricultural sources based on Member State reports for the period 2016–2019, p. 4.
- ↑ European Environment Agency (2022), Nutrients in freshwater in Europe.
- ↑ ibid.
- ↑ Eurostat (2022), Statistics Explained, Agri-environmental indicator - mineral fertiliser consumption.
- ↑ European Environment Agency (2023), Water scarcity conditions in Europe.
- ↑ ibid.
- ↑ ibid.
- ↑ ibid.
- ↑ European Environment Agency (2021), Water resources across Europe — confronting water stress: an updated assessment, EEA Report No 12/2021, p. 84.
- ↑ European Environment Agency (2022), Water abstraction by source and economic sector in Europe.
- ↑ ibid.
- ↑ European Environment Agency (2023), Water scarcity conditions in Europe (Water exploitation index plus).
- ↑ ibid.