SDG 10 - Reduced inequalities
Reduce inequality within and among countries
Data extracted in April 2023.
Planned article update: June 2024.
Highlights

This article is a part of a set of statistical articles, which are based on the Eurostat publication ’Sustainable development in the European Union — Monitoring report on progress towards the SDGs in an EU context — 2023 edition’. This report is the seventh edition of Eurostat’s series of monitoring reports on sustainable development, which provide a quantitative assessment of progress of the EU towards the SDGs in an EU context.
SDG 10 addresses inequalities within and among countries. It calls for nations to reduce inequalities in income as well as those based on age, sex, disability, race, ethnicity, origin, religion, or economic or other status within a country. The goal also addresses inequalities among countries and calls for support for safe migration and mobility of people.
Full article
Reduced inequalities in the EU: overview and key trends
It is widely agreed that economic prosperity alone will not achieve social progress. High levels of inequality risk leaving much human potential unrealised, damage social cohesion, hinder economic activity and undermine democratic participation. Leaving no one behind is thus a crucial part of achieving the SDGs. Monitoring SDG 10 in an EU context thus focuses on inequalities within countries, inequalities between countries, and migration and social inclusion. Over the five-year period assessed, the EU has made moderate progress towards addressing income inequalities within countries, even though the impacts of the COVID-19 pandemic may have slightly widened the income gap between rich and poor people in 2021. The trends in economic disparities between EU countries show a long-term convergence of Member States in terms of GDP and income. The picture remains less clear for migration and social inclusion of people with migrant background. Despite progress in certain areas, the EU still faces challenges in eliminating differences in social and labour market inclusion between home-country nationals and non-EU citizens.
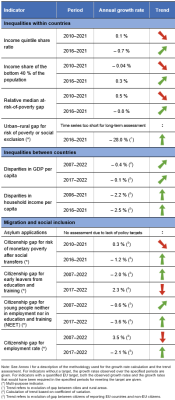
Table 1: Indicators measuring progress towards SDG 10, EU
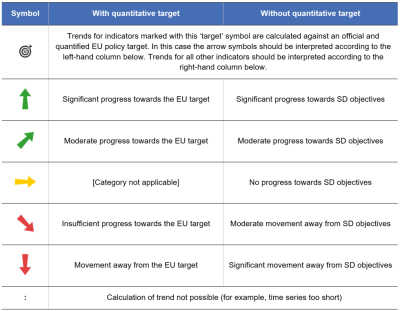
Table 2: Explanation of symbols for indicating progress towards SD objectives and targets


Inequalities within countries
High levels of inequality harm society in many ways. They can hamper social cohesion, result in lost opportunities for many, hinder economic activity, reduce social trust in institutions, lead to disproportionate exposure to adverse environmental impacts such as climate change and pollution, and undermine democratic participation [1]. Technological innovation and financial globalisation in particular have driven inequality within countries by favouring people with specific skills or accumulated wealth [2]. Similarly, the transition to a climate-neutral society will have to be managed well to prevent rising inequality.
The income gap between the rich and the poor in the EU remains large
Analysing income distribution is one of the ways to measure inequality within EU countries. The income quintile share ratio compares the income received by the 20 % of the population who have the highest equivalised disposable income with the income of the 20 % with the lowest equivalised disposable income. The higher this ratio, the bigger the income inequality between the bottom and the top ends of the income distribution. In the EU, this ratio had been decreasing in recent years, falling from 5.22 in 2014 to 4.89 in 2020. However, in 2021, this trend reversed, with the ratio rising again to 4.97. This means that in 2021 the richest 20 % of the EU population earned almost five times as much as the poorest 20 % [3].
Reflecting the trend in the income quintile share ratio, the income share of the bottom 40 % of the population in the total equivalised disposable income had been increasing between 2014 and 2019, followed by a stagnation in 2020 and a decline in 2021 to 21.3 %. The recent deterioration for both the income quintile share ratio and the income share of the bottom 40 % in 2021 might reflect the first impacts of the pandemic. However, it needs to be noted that recent trends might also be affected by a methodological change in the data collection in 2020 in a number of Member States, in particular in Germany and France [4]. Moreover, as data collected in 2021 refer to people’s income in 2020, the extent of the recovery after the pandemic remains to be seen.
Economic inequality affects children’s long-term opportunities
Inequality is also of particular concern regarding the long-term outcomes and opportunities for children. It puts those affected at a disadvantage from the start in areas with long-lasting consequences, such as physical and mental health and education, thus undermining their development and human potential. To evaluate these disadvantages, indicators on several dimensions of childhood inequality of opportunity, such as income [5] and education [6], have been developed. The COVID-19 pandemic has had negative effects on children’s physical and mental health and exacerbated societal inequality [7]. Moreover, there are wide variations between EU Member States regarding the childcare gap, which refers to a period in which families with young children are unable to benefit from childcare leave or a guaranteed place in early childhood care. While some Member States experience no childcare gap (for example, Denmark and Slovenia), others offer a relatively short period of childcare leave and guarantee a place in early childhood care only relatively late in the child’s life, at around 5 years of age (for example, the Netherlands and Ireland). Additionally, affordability of childcare remains an issue, especially for parents with multiple children and who are from low-income households [8].
The poverty gap and the at-risk-of-poverty-or-social-exclusion gap between urban and rural areas have both narrowed in recent years
Inequality and poverty are closely interrelated. The poverty gap, defined as the distance between the median (equivalised disposable) income of people at risk of poverty and the poverty threshold (set at 60 % of the national median equivalised disposable income after social transfers), has decreased since 2016. In 2021, this gap amounted to 24.4 % in the EU, which means the median income of those below the poverty threshold was 24.4 % lower than the poverty threshold. This is a 1.0 percentage point narrowing of the gap since 2016, representing a moderate short-term improvement. However, relative to 2010, this gap has widened by 1.3 percentage points, indicating a longer-term deterioration in the ‘depth’ of monetary poverty in the EU.
Furthermore, the distribution of resources within a country has a direct impact on the extent and depth of poverty. In 2021, 21.7 % of the EU population were at risk of poverty or social exclusion. However, this rate differs between cities and rural areas. In 2021, the urban–rural gap in the at-risk-of-poverty-or-social-exclusion rate amounted to 0.6 percentage points, with 21.9 % of people living in cities being in this situation, compared with 22.5 % of people in rural areas. The lowest share of people at risk of poverty or social exclusion was observed in towns and suburbs, with 20.8 % of people at risk in 2021.
The gap in the risk of poverty or social exclusion rate between cities and rural areas at EU level has thus significantly narrowed compared with 2016, when it was 3.1 percentage points. This development is the result of a stronger improvement in rural areas, where the share of people at risk of poverty or social exclusion has fallen by 3.8 percentage points since 2016. In contrast, the rate in cities has decreased by only 1.3 percentage points over the same time span.
However, the overall EU figure masks the full scope of the broad variations in gaps among Member States. Rural poverty remains extremely high in some European countries, such as Bulgaria and Romania, where 42.5 % and 50.3 % of the rural population were at risk of poverty or social exclusion in 2021. This amounted to an urban-rural gap of 18.1 and 34.2 percentage points in these two countries, respectively. However, while rural areas generally tend to be at a higher risk of poverty due to out-migration and limited access to services, infrastructure, labour markets and educational opportunities [9], this does not account for all Member States. Countries such as Austria, France and Belgium are reporting much higher poverty rates in cities than in rural areas.
Additionally, certain minorities such as Roma are at a much higher risk of monetary poverty. As of 2021, 80 % of Roma were at risk of monetary poverty, with their situation remaining unchanged since 2016. Moreover, 48 % of Roma were living in severe material deprivation in 2021, a reduction of 14 percentage points compared with 2016. Roma children under the age of 18 are particularly affected by poverty, with 83 % of those being at risk of poverty and 54 % living in households with severe material deprivation in 2021. This further adds to the vulnerability of the Roma population [10].
The gap between the rich and the poor extends to their carbon footprint
In recent years, research has increasingly pointed to the greenhouse gas (GHG) emissions gap between the rich and the poor. This emissions gap highlights that the poorer sections of the society contribute less to the climate crisis. Research has shown that reaching the EU’s 2030 target to reduce GHG emissions to at least 55 % below 1990 levels necessitates addressing carbon inequality within the EU [11]. Data from the World Inequality Database [12] show that in the EU, the carbon footprint, referring to per capita CO2 emissions from consumption, of the richest 10 % of the population was 5.0 times higher than that of the poorest 50 % in 2020. The ratio has stagnated at this level since 2015. The Member States with the widest carbon footprint gap between the top 10 % and the bottom 50% were Luxembourg, Romania and Austria, with ratios of 7.1, 6.5 and 6.3, respectively, in 2020. In comparison, the gap was the narrowest in Malta and the Netherlands, at 3.9 and 4.0, respectively. Overall, carbon footprint inequality in the EU is somewhat smaller than in other parts of the world. For example, the ratio amounted to 5.8 in Japan and 6.5 in the United States. A much higher carbon inequality was measured in India and China, with ratios of 10.2 and 12.6, respectively.
Inequalities between countries
We live in an interconnected world, where problems and challenges — such as poverty, climate change or migration — are rarely confined to one country or region. Therefore, combating inequalities between countries is important, not only from a social justice perspective, but also as a prerequisite for solving many interdependent problems. In particular, sharing prosperity and reducing trade barriers allow nations to cooperate on meeting global challenges, which by definition cannot be addressed by the EU alone (see article on SDG 17 Partnerships for the goals). Cohesion between Member States is one of the EU’s objectives, as mentioned in the Treaty on European Union (article 3.3).
North–south and west–east divides in economic disparities between EU countries remain
Not only have economic performance, incomes and living standards improved across the EU as a whole over time, they have also converged between countries. A way to measure such conversion is by looking at the coefficient of variation, expressed as the ratio of the standard deviation to the mean (in %). A lower coefficient of variation indicates less disparities between Member States. The two indicators used to measure this convergence show that inequalities between EU countries have decreased over the 15-year period assessed, even though the short-term trends are mixed.
The coefficient of variation in gross domestic product (GDP) per capita — expressed in purchasing power standards (PPS) — shows that economic disparities between Member States have narrowed since 2000, reaching 42.9 % in 2022. Most of this convergence took place in the period leading up to the 2008 economic crisis and between 2015 and 2019. However, during the COVID-19 crisis of 2020 and 2021, economic disparities between countries increased by 3.5 percentage points compared with the pre-pandemic levels of 2019. The coefficient of variation in GDP per capita returned to a downward trend in 2022, decreasing by 0.4 percentage points compared with 2021. At Member State level, purchasing power adjusted GDP per capita ranged from 59 % of the EU average in Bulgaria to 261 % in Luxembourg in 2022.
While GDP per capita is used to measure a country’s economic performance, adjusted gross household disposable income provides an indication of the average material well-being of people. Gross household disposable income reflects households’ purchasing power and ability to invest in goods and services or save for the future, by taking into account taxes, social contributions and in-kind social benefits. The coefficient of variation in gross household disposable income between Member States has decreased over time, reaching 24.2 % in 2021. This figure is 3.2 percentage points less than in 2016 and a 9.8 percentage point improvement since 2006.
However, a clear north–south and west–east divide is evident when looking at the geographical distribution of GDP per capita and household income (from national accounts) in the EU in 2021. EU citizens living in northern and western European countries with above average GDP per capita levels had the highest gross disposable income per capita. At the other end of the scale were eastern and southern EU countries, which displayed gross household disposable incomes and GDP per capita levels below the EU average.
Migration and social inclusion
The Syrian conflict, unstable situations in Afghanistan and some African countries, crises in several Latin American countries such as Venezuela, Colombia, Honduras and Nicaragua, and the war in Iraq have contributed to an unprecedented surge of migration into the EU over the past few years. Russia’s invasion of Ukraine has led to a mass influx of people fleeing the war to seek protection in the EU. The successful integration of migrants is decisive for the future well-being, prosperity and cohesion of European societies. To ensure the social inclusion of immigrants and their children, it is essential to strengthen the conditions that will enable their participation in society, including their active participation in education and training and their integration into the labour market. Successful integration of migrants into the EU labour force has the potential to slow down the ongoing trend of population ageing and to address skills shortages.
The number of asylum applications in the EU has fallen considerably in recent years
The urge to seek international protection is one of the main reasons why people cross borders. In 2022, the EU received 881 220 first-time asylum applications [13], which is an almost 64 % increase since 2021. During 2022, slightly more than 310 000 people were granted protection status at the first instance in the EU [14]. In relation to the EU population, these numbers equal 1 973 first-time asylum applications and 695 positive first-instance decisions per million EU inhabitants in 2022.
Following a considerable fall (by one-third) in the number of first-time asylum seekers applying for international protection between 2019 and 2020, owing to the COVID-19 pandemic and related emergency measures such as movement restrictions [15], the EU has since seen a consistent rise in asylum applications. The recent increase in first-time asylum applications and positive first instances can be attributed to the ongoing Russian invasion of Ukraine, which began in the first quarter of 2022. Following the displacement caused, the Council Decision of March 2022 enabled non-EU citizens fleeing Ukraine to receive immediate and temporary protection. At the end of December 2022, close to 3.8 million displaced people were beneficiaries of this temporary protection in the EU [16]. Poland and Germany, followed by Czechia, hosted the highest absolute number of beneficiaries, providing temporary protection to around 61.8 % of all beneficiaries in the EU.
Despite some improvements in recent years, the social inclusion of non-EU citizens remains a challenge
The social integration of migrants is monitored here by comparing the situation of non-EU citizens with citizens of EU Member States that reside in their home country —referred to as ‘home-country nationals’ in this publication — in the areas of poverty, education and the labour market. In all these areas, people from outside the EU fare less well than EU nationals. However, short-term trends have been mostly favourable, with the gap between home-country nationals and non-EU citizens closing or at least stagnating in almost all areas monitored here.
Trends in the citizenship gap for people at risk of monetary poverty after social transfers show that between 2016 and 2021, poverty rates remained quite stable for both non-EU citizens and EU home-country nationals. Still, the gap remains large, with 38.7 % of non-EU citizens being at risk of monetary poverty (after social transfers) in 2021, compared with only 14.8 % of home-country nationals.
Between 2017 and 2022, the employment rate for EU home-country nationals aged 20 to 64 increased by 3.4 percentage points, while the rate for non-EU citizens grew by 4.9 percentage points. As a result, the gap between the two groups has narrowed by 1.5 percentage points since 2017. While 75.4 % of EU home-country nationals were employed in 2022, the rate for non-EU citizens stood at 61.9 %. Thus, despite the stronger improvement for non-EU citizens since 2017, the gap remains considerable, at 13.5 percentage points in 2022.
The gaps between home-country nationals and non-EU citizens in the area of education and training have evolved differently in recent years. The shares of young people not in employment nor in education and training (NEET) decreased for both groups between 2017 and 2022. The NEET rate for 15- to 29-year old non-EU citizens fell by 4.2 percentage points, reaching 22.3 % in 2022. For home-country nationals of the same age, the NEET rate decreased by 1.9 percentage points in the same period, amounting to 10.9 % in 2022. Thus, a narrowing of the gap by 2.3 percentage points has been visible since 2017. Despite these improvements, the citizenship gap between the two groups still amounted to 11.4 percentage points in 2022.
The most striking difference between non-EU citizens and EU home-country nationals is visible for 18- to 24-year old early leavers from education and training. The early leaving rate of home-country nationals has fallen continuously since 2017, reaching 8.3 % in 2022. In contrast, the early leaving rate for non-EU citizens increased by 0.8 percentage points over the same period, reaching 26.1 % in 2022. As a result, the citizenship gap has widened by 1.9 percentage points since 2017, reaching 17.8 percentage points in 2022. Because early school leaving and unemployment both have an impact on people’s future job opportunities and their lives in general, further efforts are needed to fully integrate young migrants into European societies.
Presentation of the main indicators

The distribution of income can be measured by using, among others [17], the ratio of total equivalised disposable income received by the 20 % of the population with the highest income (top quintile) to that received by the 20 % of the population with the lowest income (lowest quintile). Equivalised disposable income is the total income of a household (after taxes and other deductions) that is available for spending or saving, divided by the number of household members converted into equivalised adults. Data presented in this section stem from the EU Statistics on Income and Living Conditions (EU-SILC).
.png)
Source: Eurostat (sdg_10_41)
.png)
Source: Eurostat (sdg_10_41)

This indicator measures the income share received by the bottom 40 % of the population (in terms of income). The income concept used is the total disposable household income, which is a households’ total income (after taxes and other deductions) that is available for spending or saving. Data presented in this section stem from the EU Statistics on Income and Living Conditions (EU-SILC).
.png)
Source: Eurostat (sdg_10_50)
.png)
Source: Eurostat (sdg_10_50)
Relative median at-risk-of-poverty gap

The relative median at-risk-of-poverty gap helps to quantify how poor the poor are by showing the distance between the median income of people living below the poverty threshold and the threshold itself, expressed in relation to the poverty threshold. The poverty threshold is set at 60 % of the national median equivalised disposable income of all people in a country and not for the EU as a whole. Data presented in this section stem from the EU Statistics on Income and Living Conditions (EU-SILC).
.png)
Source: Eurostat (sdg_10_30)
.png)
Source: Eurostat (sdg_10_30)
Disparities in GDP per capita

GDP per capita is calculated as the ratio of GDP to the average population in a specific year. Basic figures are expressed in purchasing power standards (PPS) which represent a common currency that eliminates differences in price levels between countries to allow meaningful volume comparisons of GDP. The disparities indicator for the EU is calculated as the coefficient of variation of the national figures.
.png)
Source: Eurostat (sdg_10_10)
.png)
Source: Eurostat (sdg_10_10)

Source: Eurostat (NAMA_10R_2GDP)
Disparities in household income per capita

The adjusted gross disposable income of households reflects the purchasing power of households and their ability to invest in goods and services or save for the future, by accounting for taxes and social contributions and monetary in-kind social benefits. The disparities indicator for the EU is calculated as the coefficient of variation of the national figures in PPS per capita.
.png)
Source: Eurostat (sdg_10_20)
.png)
Source: Eurostat (sdg_10_20)
Asylum applications

This indicator shows the number of first-time asylum applicants per million inhabitants and the number of positive first instance decisions per million inhabitants. A first-time applicant for international protection is a person who lodged an application for asylum for the first time in a given Member State. First-instance decisions are decisions granted by the respective authority acting as a first instance of the administrative or judicial asylum procedure in the receiving country. The source data are supplied to Eurostat by the national ministries of interior and related official agencies.
.png)
Source: Eurostat (sdg_10_60)
.png)
Source: Eurostat (sdg_10_60)
Presentation of additional multi-purpose indicators
Urban–rural gap for risk of poverty or social exclusion

Statistics on the degree of urbanisation classify local administrative units as ‘cities’, ‘towns and suburbs’ or ‘rural areas’ depending on population density and the total number of inhabitants. This classification is used to determine the difference in the shares of people at risk of poverty or social exclusion between cities and rural areas. Data presented in this section stem from the EU Statistics on Income and Living Conditions (EU-SILC).
.png)
Source: Eurostat (sdg_01_10a)
.png)
Source: Eurostat (sdg_01_10a)
Citizenship gaps between non-EU citizens and citizens of reporting EU countries
This section provides data for different indicators by citizenship. Data are shown for non-EU citizens, referring to citizens of non-EU Member States, and for citizens of the reporting countries, referring to citizens of EU Member States that reside in their home country. Data presented in this section stem from the EU Statistics on Income and Living Conditions (EU-SILC) and from the EU Labour Force Survey (EU-LFS).

.png)
Source: Eurostat (sdg_01_20a)

.png)
Source: Eurostat (sdg_04_10a)
,_by_citizenship_evaluation_2023.PNG)
,_by_citizenship,_EU,_2006-2022_(%25_of_population_aged_15_to_29).png)
Source: Eurostat (sdg_08_20a)

.png)
Source: Eurostat (sdg_08_30a)
Direct access to
More detailed information on EU SDG indicators for monitoring of progress towards the UN Sustainable Development Goals (SDGs), such as indicator relevance, definitions, methodological notes, background and potential linkages, can be found in the introduction of the publication ’Sustainable development in the European Union — Monitoring report on progress towards the SDGs in an EU context — 2023 edition’.
Further reading on inequalities
- Eurofound (2021), Monitoring convergence in the European Union: Looking backwards to move forward – Upward convergence through crises, Challenges and prospects in the EU series, Publications Office of the European Union, Luxembourg.
- Eurofound (2019), A more equal Europe? Convergence and the European Pillar of Social Rights, Publications Office of the European Union, Luxembourg.
- European Migration Network (2021), Annual report on Migration and Asylum 2020, European Commission.
- European Commission (2023), Atlas of Migration 2022, Publications Office of the European Union, Luxembourg.
- European Commission (2022), Employment and Social Developments in Europe, Annual Review 2022.
- European Commission, Common European Asylum System.
- OECD (2022), International Migration Outlook 2022.
- [OECD (2021), Does Inequality Matter? How People Perceive Economic Disparities and Social Mobility, OECD Publishing, Paris.
- OECD (2019), Under Pressure: The Squeezed Middle Class.
- OECD (2018), A Broken Social Elevator? How to Promote Social Mobility.
- World Inequality Lab (2022), World Inequality Report 2022.
Further data sources on inequalities
- Eurostat, Gini coefficient of equivalised disposable income (online data code: ilc_di12).
- How's Life? Well-Being - OECD Statistics database.
- OECD Income (IDD) and Wealth (WDD) Distribution Databases.
- European Border and Coast Guard Agency (Frontex) (2020), Risk analysis for 2020.
- OECD (2019), Settling in 2018 ¬— Indicators of Immigrant Integration.
- World Inequality Database.
Notes
- ↑ OECD (2017), Understanding the socio-economic divide in Europe. Background report.
- ↑ Darvas, Z. and Wolff, B. (2016), An Anatomy of Inclusive Growth in Europe, pp.14–15.
- ↑ Income data collected for SILC refer to the situation in the previous year, meaning that data labelled as 2021 refer to people’s incomes in 2020.
- ↑ The change in data collection methods in several countries, in particular Germany and France, between 2019 and 2020 affected also the EU total but not the direction of change from 2020 to 2021.
- ↑ European Commission, EU social indicators dataset: Inequality of opportunity — income dimension.
- ↑ European Commission, EU social indicators dataset: Inequality of opportunity — education dimension.
- ↑ Eurochild (2020), Growing up in lockdown. Europe’s children in the age of COVID-19.
- ↑ European Platform for Investing in Children (EPIC) (2020), The Childcare Gap in EU Member States, Publications Office of the European Union, Luxembourg.
- ↑ Volonteurope (2016), Rural isolation of citizens in Europe.
- ↑ European Union Agency for Fundamental Rights (2022), Roma in 10 European Countries. Main results, Vienna.
- ↑ Oxfam (2020), Confronting Carbon Inequality in the European Union.
- ↑ See: World Inequality Database, https://wid.world/data/.
- ↑ Source: Eurostat (online data code: (MIGR_ASYAPPCTZA)).
- ↑ Source: Eurostat (online data code: (MIGR_ASYDCFSTA)).
- ↑ European Asylum Support Office (2021), Asylum Trends 2020 preliminary overview.
- ↑ Source: Eurostat (online data code: (migr_asytpsm)) and Eurostat (2022), Statistics Explained: Temporary protection for persons fleeing Ukraine — monthly statistics.
- ↑ The income quintile share ratio looks at the two ends of the income distribution. Other indicators, such as the Gini index, measures total inequality along the whole income distribution.