SDG 17 - Partnerships for the goals
Strengthen the means of implementation and revitalise the global partnership for sustainable development
Data extracted in April 2023.
Planned article update: June 2024.
Highlights

This article is a part of a set of statistical articles, which are based on the Eurostat publication ’Sustainable development in the European Union — Monitoring report on progress towards the SDGs in an EU context — 2023 edition’. This report is the seventh edition of Eurostat’s series of monitoring reports on sustainable development, which provide a quantitative assessment of progress of the EU towards the SDGs in an EU context.
SDG 17 calls for a global partnership for sustainable development. It highlights the importance of macroeconomic stability and of mobilising financial resources for developing countries. It also stresses the importance of trade and equitable rules for governing it. The goal also emphasises the importance of access to science and technology, in particular internet-based information and communications technology.
Full article
Partnerships for the goals in the EU: overview and key trends
Partnership is at the essence of the EU and an overarching principle to approach the SDGs within and beyond the EU boundaries. Monitoring SDG 17 in an EU context focuses on global partnership, financial governance, and access to technology. Over the assessed five-year period, the EU’s progress in the area of global partnership was mixed. While imports from developing countries have grown, financing to these countries has decreased, and the EU is still behind on its path towards its official development assistance target. Moreover, financial governance within the EU remains a challenge, as exemplified by a falling share of environmental taxes in total tax revenues and high levels of general government gross debt. Meanwhile, access to technology in the EU progressed, with a significant increase in the share of households connected to high-speed internet.
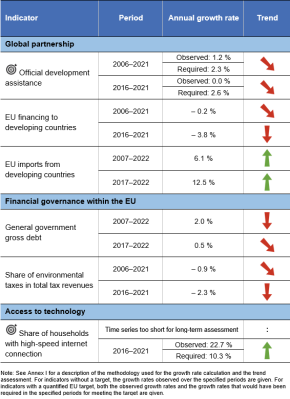
Table 1: Indicators measuring progress towards SDG 17, EU
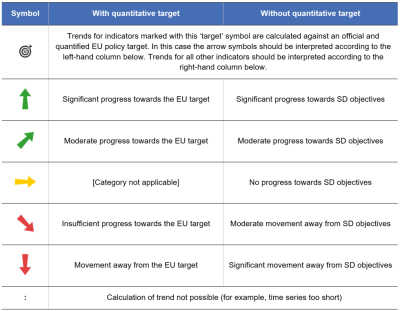
Table 2: Explanation of symbols for indicating progress towards SD objectives and targets


Global partnership
To achieve the SDGs, partnerships are necessary between governments, the private sector, civil society and other parties. Wealthier economies such as the EU can support the implementation of the 2030 Agenda in developing countries through public and private, domestic and international resources. These resources can be both financial and non-financial [1]. This article focuses on the former. Overall, the global partnership indicators show a mixed picture for the EU over the past few years.
The EU supports country-led development through a range of financial support mechanisms
In 2015, in the Addis Ababa Action Agenda, all countries recognised that international public finance plays an important role in complementing countries’ domestic efforts to mobilise public resources, especially in the poorest and most vulnerable countries. Official development assistance (ODA), other official flows (OOFs), private flows, such as foreign direct investment (FDI), grants by non-governmental organisations (NGOs) and officially supported export credits [2] are some of the financial flows from the EU and its Member States to developing countries.
Regarding the total volume of financial flows from the EU to developing countries, the Organisation for Economic Co-operation and Development (OECD) estimates that total public and private EU financing to developing countries amounted to EUR 111.3 billion in 2021. When accounting for inflation, this is about the same level as the financial flows provided by the EU fifteen years earlier, and is – in part substantially – lower than the amounts provided between 2014 and 2019. While OOFs and grants by NGOs have remained rather marginal, ODA and private flows combined have accounted for 95 % or more of total estimated EU financing for development since 2014. Overall, ODA has been the most reliable and steady financial flow from the EU to developing countries, while private flows have varied strongly over the years.
Official development assistance: a long struggle to meet targets
The idea that donor countries should contribute 0.7 % of their gross national income (GNI) to ODA has been on the international agenda for half a century. The EU is committed to reaching the 0.7 % target by 2030, as affirmed in the New European Consensus on Development. Member States that joined the EU after 2002 have committed to provide 0.33 % of their GNI for ODA. As a whole, the EU spent 0.49 % of its GNI on ODA in 2021, slowly descending from 0.50 % in 2020. The peak of 2020 in the EU’s ODA to GNI ratio reflected a global trend, with worldwide ODA having reached an overall high as a result of donor efforts in the context of the COVID-19 pandemic [3]. In the EU, the decrease in the ODA to GNI ratio from 2020 to 2021 is a result of GNI growing faster (by 8.6 %) than ODA (by 6.3 %) [4].
Only four EU countries – Luxembourg, Sweden, Germany and Denmark – achieved the 0.7 % target in 2021, meaning additional efforts will be needed to meet the collective EU target by 2030.
The EU remains the world’s biggest ODA donor
In 2021, the EU maintained its position as the biggest ODA donor globally, providing about EUR 71.6 billion. This figure refers to the combined ODA provided by the 27 EU Member States and EU institutions. Moreover, with 0.49 % in 2021, the EU’s overall ODA/GNI ratio was significantly higher than for most other Development Assistance Committee’s (DAC) donors such as Canada, Japan or the United States. At the same time, aid from emerging donors is gaining in relevance. For example, Saudi Arabia and Türkiye spent about 1 % of their GNI on ODA in 2021 [5].
The EU seeks to support least developed countries in particular
To direct resources where they are most needed — least developed countries (LDCs) and countries in states of fragility and conflict — the EU has a target to collectively provide 0.15–0.20 % of GNI to LDCs in the short term, reaching 0.20 % within the timeframe of the 2030 Agenda. In 2021, the EU’s collective official development assistance to LDCs accounted for 0.11 % of GNI, following a period of stagnation around this value since 2012. The EU has thus not progressed towards its 0.20 % target over the past few years. In 2021, only three Member States – Luxembourg, Sweden and Denmark – exceeded the targeted GNI ratio of ODA to LDCs. In addition, Finland exceeded the short-term target, with a ratio of 0.16 %.
ODA is only a part of several financing mechanisms
The EU seeks to ensure that developing countries can combine aid, investment and trade with domestic resources and policies to build capacity and become self-reliant. ODA, for example, can be used as a catalyst to mobilise other financial resources such as domestic tax revenues or resources from the private sector. Other innovative instruments have been developed, such as blending grants with loans, guarantees or equity from public and private financiers.
EU financial support, combined with domestic and private revenues, can provide a basis for achieving the 2030 Agenda’s goals, allowing for investment in social services, clean energy, infrastructure, transport and information and communications technologies. In the best case, developing countries could leapfrog some of the unsustainable modes of production and consumption that industrialised countries use.
EU imports from developing countries reached a new record high in 2022
Trade’s potential contribution to sustainable development has long been acknowledged. This is reflected in the EU's 2021 Trade Policy Review, along with the European Green Deal which stresses the contribution that trade policy can make to achieving the EU’s ambition on sustainable development.
Exports can create domestic jobs and allow developing countries to obtain foreign currency, which they can use to import necessary goods. Better integration of developing countries into world markets may reduce the need for external public flows. Several of the SDGs refer to the importance of trade for sustainable development. However, it needs to be noted that the EU’s trade-related indicators do not provide insights on whether the products in question are produced in an environmentally and socially sustainable manner.
Between 2007 and 2022, EU imports from developing countries more than doubled from EUR 617 billion to EUR 1 508 billion. Over this period, EU imports from developing countries grew by 6.1 % per year on average. Over the short term, since 2017, imports have grown even more strongly, by 12.5 % a year. Both trends were largely driven by a considerable increase in imports from developing countries by almost 40 % in 2022 compared with 2021. Growth was particularly strong for least-developed countries, whose imports increased by more than 84 % from 2021 to 2022.
Imports from developing countries to the EU as a share of imports from all countries outside the EU increased from 43.2 % in 2007 to 50.2 % in 2022. Similar to 2021, developing countries (including China) thus accounted for half of all extra-EU imports in 2022. China (excluding Hong Kong) alone accounted for 20.9 % of EU imports in 2022. This is almost twice the share of imports from the United States, which accounted for 11.9 %. Conversely, the almost 50 countries classified as least developed by the UN accounted for just over 2 % of all EU imports in 2022 [6].
‘Aid for trade’ is a part of ODA that is targeted at trade-related projects and programmes. It aims to build trade capacity and infrastructure in developing countries, particularly least developed countries. The EU and its Member States were the leading global providers of aid for trade in 2020, providing EUR 23 billion, or 47 % of global aid for trade. Just three donors — the EU institutions as well as Germany and France — provided 90 % of this overall sum. The share of aid for trade to LDCs was 13 % of overall aid for trade in 2020, two percentage points lower than in the three years before [7].
Financial governance within the EU
To help other countries to advance their economies, the EU’s own economies must also remain on a sustainable development path. Macroeconomic stability in the EU is therefore one pillar of the Union’s contribution to implementing the SDGs. In addition, the EU seeks to make its economy greener. In a global context, where consumption patterns in one region can severely impact production patterns elsewhere, it is particularly important that prices reflect the real costs of consumption and production. They should include payments for negative externalities caused by polluting activities or other activities that damage human health and the environment. Moreover, the EU has pointed out that environmental taxes may offer opportunities to reduced taxes in other areas, for example on labour.
Steady progress in reducing government debt as a share of GDP was halted by the COVID-19 pandemic
According to the Treaty on the Functioning of the European Union, government debt should not exceed 60 % of GDP in EU Member States. As a consequence of the COVID-19 crisis and related public spending, the EU’s overall debt-to-GDP ratio rose sharply in 2020 to reach 90.0 %, which is a 12.3 percentage point increase compared with 2019. In 2021 and 2022, the EU’s debt-to-GDP ratio fell by 2.0 and 4.0 percentage points compared with the previous year, respectively. In 2022, the ratio thus stood at 84.0 %, which is 2.1 percentage points higher than five years earlier.
In 2022, Member States’ debt-to-GDP ratios ranged from 18.4 % in Estonia to 171.3 % in Greece. Thirteen EU countries exceeded the 60 % threshold in 2022 and six Member States had debt-to-GDP ratios above 100 %.
‘Greening’ the taxation system remains a challenge
Environmental taxes help to provide the right price signals and incentives to producers, users and consumers to encourage less polluting consumption and to contribute to sustainable growth. They may also provide opportunities to reduce taxes in other areas, for example on labour, and if revenue for adequate social protection is protected, they can offer a win-win option for addressing both environmental and employment issues, as laid out in the EU’s Action Plan for Fair and Simple Taxation. Environmental taxes support the transition to a climate-neutral economy [8]. As indicated in the Communication on Business taxation for the 21st century as regards the EU tax mix, behavioural taxes, such as environmental and health taxes, continue to be of growing importance for EU tax policies. Well-designed environmental taxes help to support the green transition by sending the right price signals, as well as implementing the polluter pays principle. They also generate revenue that could compensate some of the needed labour tax cuts.
In 2021, environmental taxes accounted for only 5.5 % of total tax revenues in the EU, while labour taxes accounted for 53.5 % in 2020 [9]. Energy taxes constituted the main part of environmental taxes, accounting for 4.3 % of tax revenues in 2021, followed by transport taxes with a share of 1.0 %. In comparison, taxes on pollution and resources – the third component of environmental taxes – remained negligible, accounting for only 0.2 % of total tax revenues in 2021 [10]. The share of total environmental taxes has fallen considerably since 2016 in parallel to an increase in the share of labour taxes, meaning that in the EU the tax burden is shifting from environment to labour instead of the other way round. Across Member States, the share of environmental taxes in total tax revenues ranged from 3.8 % in Luxembourg to 10.0 % in Greece in 2021. Compared with 2016, their share has further decreased in almost all EU countries. Only Greece – the country with the highest share of environmental taxes in 2021 – reported a 0.2 percentage point increase over this period.
The ratio of labour to environmental taxes shows how much higher a country’s share of labour tax revenues is than its share of environmental taxes. In 2020, this ratio ranged from 3.8 to 14.0 across Member States. The ratio has also increased in the majority of countries since 2015, indicating a relative shift in taxation from environment to labour across the EU.
EU Member States spend on average 2 % of their GDP to protect the natural environment
The decline in the prioritisation of environmental taxation is partly reflected in national environmental expenditures. National expenditure on environmental protection measures the amount of resources a country uses to protect the natural environment. It includes current expenditure on environmental protection activities, investments in these activities and net transfers to other parts of the world.
At EU level, environmental protection expenditure has stagnated at about 2 % of GDP since 2010, amounting to EUR 292 billion in 2021. Across EU Member States, in 2019 expenditure ranged from 3.5 % of GDP in Austria to 0.7 % in Ireland. In the majority of Member States, these shares have decreased or remained stable since 2014. Only seven countries increased their environmental protection expenditure relative to GDP between 2014 and 2019, with the strongest growth reported by Poland (1.0 percentage points increase) and Austria (0.4 percentage points) [11].
Access to technology
In today’s economies and societies, digital connections are crucial. Instant communication between individuals, bank transfers, office work, public dissemination of information and data analysis are only some of the activities that depend on the internet. Regions without fast internet connections have serious social and economic disadvantages in a digitalised world. As a result, making Europe fit for the digital age is one of the six Commission priorities for 2019 to 2024. The aim is to make the digital transformation work for people and businesses while helping to achieve the target of a climate-neutral Europe by 2050.
Considerable progress has been made in rolling out high-speed internet coverage across the EU
Data collected by the European Commission services for the key dimensions of the European information society [12] shows that in the EU the uptake of high-speed internet coverage — referring to fibre connections or other networks offering similar bandwidth — has improved considerably over the past few years. While only 25.2 % of EU households enjoyed such connectivity in 2016, this share has risen considerably, reaching 70.2 % in 2021. If high-speed internet roll-out continues at this pace, the EU will reach 100 % coverage well ahead of 2030. Connectivity has also improved in rural areas [13]. Between 2016 and 2021, the share of rural households with fixed high-speed internet connection increased from 7.7 % to 37.1 % across the EU.
At Member State level, Malta had already achieved a 100 % fixed high-speed internet connectivity for all households in 2021, followed by Luxembourg, Denmark and Spain with around 95 % of households each. In contrast, fixed high-speed internet connections were the least widespread in Greece, with only 19.8 % of households enjoying such connectivity. All remaining Member States had connection rates to high-speed internet above 40 % in 2021.
Presentation of the main indicators
Official development assistance

Official development assistance (ODA) is provided by governments and their executive agencies to support economic development and welfare in developing countries. ODA must be concessional in character, having a grant element that varies in proportion depending on the recipient. Eligible countries are included in the Organisation for Economic Development and Cooperation’s (OECD) Development Assistance Committee (DAC) official list of ODA recipients. ODA disbursements and their purpose are reported by donors to the OECD. A new methodology to calculate the ODA value of concessional loans is applied from 2018 data onwards and affects the comparability of data with previous years. Additionally, a new methodology for calculating total ODA to LDCs is applied from 2020 data onwards, by including regional ODA known to benefit LDCs (on top of the bilateral net ODA to LDCs and imputed multilateral ODA to LDCs).
.png)
Source: OECD, Eurostat (sdg_17_10)
.png)
Source: OECD, Eurostat (sdg_17_10)
.png)
Source: European Commission services calculations based on OECD data.
EU financing to developing countries

EU financing to developing countries takes a number of forms. These, as documented by the OECD, include: Official development assistance (ODA) (public grants or concessional loans with the aim of supporting economic development and welfare); other official flows (OOFs) (public flows that are not focused on development or with a grant element of less than 25 %); private flows (direct investment, bonds, export credits and multilateral flows); grants by non-governmental organisations (from funds raised for development assistance and disaster relief); and officially supported export credits. Data stem from the OECD (DAC).
.png)
Source: OECD, Eurostat (sdg_17_20)
EU imports from developing countries

This indicator is defined as the value (at current prices) of EU imports from the countries on the DAC list of ODA beneficiaries. It indicates to what extent products from these countries access the EU market. Information for this indicator is provided by enterprises with a trade volume above a set threshold and is collected on the basis of customs declarations. This information is then adjusted by Member States to account for the impact of trade under this threshold.
.png)
Source: Eurostat (sdg_17_30)
.png)
Source: Eurostat (sdg_17_30) and (ext_lt_maineu)
General government gross debt

The Treaty on the Functioning of the European Union defines this indicator as the ratio of general government gross debt at the end of the year to gross domestic product at current market prices. For this calculation, general government gross debt is defined as the total consolidated gross debt at nominal (face) value in the following categories of government liabilities, as defined in ESA 2010: currency and deposits, debt securities and loans. The general government sector comprises central government, state government, local government and social security funds.
.png)
.png)
Source: Eurostat (sdg_17_40)

Environmental taxes are defined as taxes based on a physical unit (or proxy of it) of something that has a proven, specific negative impact on the environment. There are four types of environmental taxes: energy taxes, transport taxes, and pollution taxes and resource taxes.
.png)
Source: Eurostat (online data codes: (sdg_17_50) and (env_ac_tax))
.png)
Source: Eurostat (sdg_17_50)

The indicator measures the share of households with fixed very high capacity network (VHCN) connection. Very high capacity network means either an electronic communications network that consists entirely of optical fibre elements at least up to the distribution point at the serving location, or an electronic communications network capable of delivering, under usual peak-time conditions, similar network performance in terms of available downlink and uplink bandwidth, resilience, error-related parameters, and latency and its variation. The data are collected for the Broadband Coverage in Europe studies published by the European Commission. Data until 2018 refer to fibre to the premises (FTTP) only, while data from 2019 onwards refer to both FTTP and Data Over Cable Service Interface Specification (DOCSIS) 3.1. DOCSIS allows adding high-bandwidth data transfer to existing cable television systems.
_new.png)
Source: European Commission services, Eurostat (sdg_17_60)
_new.png)
Source: European Commission services, Eurostat (sdg_17_60)
Direct access to
More detailed information on EU SDG indicators for monitoring of progress towards the UN Sustainable Development Goals (SDGs), such as indicator relevance, definitions, methodological notes, background and potential linkages, can be found in the introduction of the publication ’Sustainable development in the European Union — Monitoring report on progress towards the SDGs in an EU context — 2023 edition’.
Further reading on partnership for the goals
- European Commission (2021), Trade Policy Review -An Open, Sustainable and Assertive Trade Policy, COM (2021) 66 final.
- European Commission (2022), 2022 annual report on the implementation of the European Union’s external action instruments in 2021, Luxembourg.
- European Commission (2023), EU Aid for Trade Progress Report 2022, Brussels.
- European Commission (2022), Investing in sustainable development : progress report 2018-2020, Publications Office of the European Union, Brussels.
- European Union (2017), The new European Consensus on Development ‘Our World, Our Dignity, Our Future’, Joint statement by the Council and the representatives of the governments of the Member States meeting within the Council, the European Parliament and the Commission, 2017/C 210/01, Official Journal of the European Union, Volume 60.
- Global Partnership for Effective Development Co-operation (2016), Nairobi Outcome Document: Global Partnership for Effective Development Co-Operation.
- Organisation for Economic Co-operation and Development High-Level Forum on Aid Effectiveness (2011), Busan Partnership Agreement, Busan.
- Organisation for Economic Co-operation and Development (OECD) (2023), Development Co-operation Report 2023: Debating the Aid System, OECD Publishing, Paris.
- United Nations Department of Economic and Social Affairs (2015), Addis Ababa Action Agenda of the Third International Conference on Financing for Development (Addis Ababa Action Agenda), UNGA Resolution 69/313 of 27 July 2015.
- United Nations, Inter-agency Task Force on Financing for Development (2022), Financing for Sustainable Development Report 2022, United Nations, New York.
Further data sources on partnership for the goals
Notes
- ↑ Non-financial resources include domestic policy frameworks, effective institutions and support for good governance, democracy, rule of law, human rights, transparency and accountability; see also the Addis Ababa Action Agenda (AAAA).
- ↑ The OECD defines export credits as loans for the purpose of trade and which are not represented by a negotiable instrument. They may be extended by the official or the private sector. If extended by the private sector, they may be supported by official guarantees; see http://www.oecd.org/dac/dac-glossary.htm#Export_Credits.
- ↑ OECD (2021), COVID-19 spending helped to lift foreign aid to an all-time high in 2020.
- ↑ Source: Calculations by DG INTPA based on OECD data.
- ↑ Source: OECD.Stat, Total flows by donor (ODA+OOF+Private) [DAC1].
- ↑ Source: Eurostat (online data code: (ext_lt_maineu)).
- ↑ European Commission (2022), EU Aid for Trade Progress Report 2022.
- ↑ European Environment Agency (2022), The role of (environmental) taxation in supporting sustainability transitions, Briefing.
- ↑ Taxes on labour are generally defined as all personal income taxes, payroll taxes and social contributions of employees and employers that are levied on labour income (both employed and non-employed). Data on labour taxes stem from the DG Taxation and Customs Union (‘Data on Taxation’ webpage).
- ↑ Source: Eurostat (online data code: (env_ac_tax)).
- ↑ Eurostat (ten00135)
- ↑ See European Commission, Key Indicators.
- ↑ In the context of the EU’s digital agenda scoreboard indicators, rural areas are defined as those with less than 100 people per square kilometre.