Environment statistics at regional level
Data extracted in April 2023.
Planned article update: September 2024.
Highlights
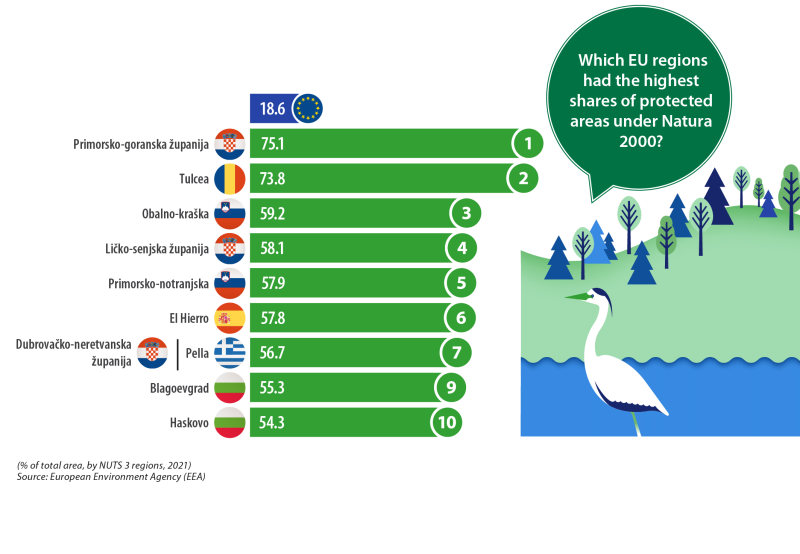
In 2021, Natura 2000 protected areas accounted for approximately three quarters of the land area in the Croatian region of Primorsko-goranska županija and the Romanian region of Tulcea.
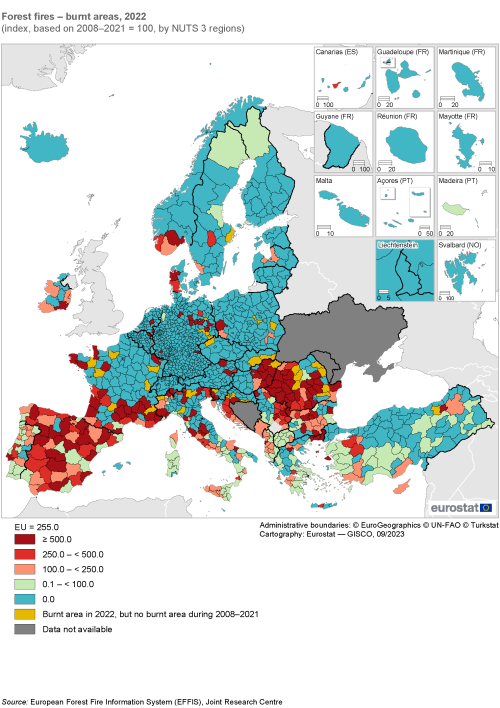
Compared with historical patterns there was an increase in the area burnt by forest fires during 2022; this was particularly true across large areas of Spain, southern France, Romania and western Slovenia.
Historically, many people held a common belief that nature could restore or replenish itself. The identification of certain phenomena – rising temperatures, increases in the frequency and severity of extreme weather-related events, species loss or growing marine and terrestrial pollution – have contributed towards increasing awareness of long-term environmental damage.
Climate change and environmental degradation are two of the most serious threats to the European Union (EU) and the world and represent major global risks. They are interrelated: climate change affects biodiversity, while healthy ecosystems provide services that are critical for climate change mitigation (carbon sinks and stocks) and adaptation (water retention, protection against floods and desertification, urban heat reduction, protection against air pollution, and so on). The United Nations (UN’s) 2030 Agenda for Sustainable Development is a long-term strategy that aims to achieve a range of socioeconomic and environmental goals. From an environmental perspective, the aim is to protect the Earth from environmental degradation, for example by supporting sustainable consumption and production, combined with urgent action on climate change, amongst others. The agenda introduced a set of 17 Sustainable Development Goals (SDGs); to monitor progress towards these goals the UN has adopted a list of indicators. The European Green Deal is the EU’s response to the three interlinked environmental crises (climate change, biodiversity loss and pollution, all driven by natural resources depletion). It contributes to achieving the climate and environmental objectives of the 2030 Agenda.
SDG 14 and SDG 15 concern ‘life below water’ and ‘life on land’. They seek to conserve and sustainably use the oceans, seas and terrestrial ecosystems. The EU Biodiversity Strategy for 2030 – Bringing nature back into our lives (COM(2020) 380 final) sets legally binding nature restoration targets to protect a minimum of 30 % of the EU’s land and sea area, with specific commitments to protect nature and reverse the degradation of ecosystems. The Birds and Habitats Directive are the oldest environmental laws in the EU: they provide a legal basis for Natura 2000, which is designed to ensure the long-term survival of Europe’s most valuable and threatened species and habitats. The infographic above and the first section in this chapter provide statistics on protected areas under Natura 2000.
Forests are the most biologically diverse ecosystems on land. They play a crucial role in mitigating and adapting climate change through carbon sequestration and other ecosystem services. Forest fires have human consequences (fatalities and injuries/illnesses), economic costs (asset losses, reduced tourism/forestry/agriculture, control and rehabilitation costs) and ecological impacts. The ecological impact of fires is twofold: controlled fires can promote biodiversity and regeneration, while uncontrolled fires result in biodiversity loss and degradation (with carbon dioxide emissions and the loss of carbon sinks). The second section in this chapter provides information on forest fires and related carbon dioxide emissions.
SDG 11 ‘sustainable cities and communities’ focuses on making cities and human settlements inclusive, safe, resilient and sustainable, reducing their environmental impact by, among other actions, improving air quality as well as municipal and other waste management. Air pollution is a major cause of premature death and disease in the EU, with fine particulate matter (PM2.5) deemed to have the most severe impacts on human health. The EU’s zero pollution action plan sets a goal of reducing the number of premature deaths caused by fine particulate matter by at least 55 % by 2030 (relative to 2005 levels). The third section in this chapter provides statistics on the magnitude of the health impacts of air pollution resulting from exposure to fine particulate matter.
SDG 7 on ‘affordable and clean energy’ seeks to ensure access to affordable, reliable, sustainable and modern energy for all. Most buildings in the EU require heating in the winter months and an increasing number make use of air-conditioning during the summer. Following Russian military aggression against Ukraine, the EU accelerated its plans for an energy transition away from fossil fuels alongside plans for energy efficiency savings (for example, through proposals to renovate millions of buildings so that they waste less energy). In March 2023, the Council and European Parliament adopted new EU legislation setting an energy savings target in the EU, namely, to cut 11.7 % of final energy consumption by 2030 (in addition to reduction targets already agreed in 2020). The use of energy in buildings forms part of final energy consumption. The concept of ‘degree days’ measures how much (in degrees) and for how long (in days) outside temperatures are below/above a fixed room temperature (at which there is no need for heating/cooling); this information can be used to model energy consumption in buildings. The fourth section in this chapter presents statistics on heating and cooling degree days.
Full article
Land
Ecosystems and the services they provide are under pressure from urban sprawl, intensive agriculture, pollution, invasive species and climate change. The EU’s biodiversity strategy for 2030 includes specific commitments and actions to protect nature and reverse the degradation of ecosystems.
The world’s largest network of protected areas – Natura 2000 – was established in 1992 and is made up of 27 000 sites across the EU covering 1.2 million km². This network of protected areas extends over 18.6 % of the EU’s land area and 9 % of its marine territory. It aims to ensure the long-term survival of the EU’s most valuable and threatened species and habitats. While it includes strictly protected nature reserves, most of the land covered by Natura 2000 areas is privately owned. The approach to conservation and sustainable use of these areas is largely centred on people working with nature. EU Member States must ensure that their protected sites are managed in a sustainable manner, both ecologically and economically.
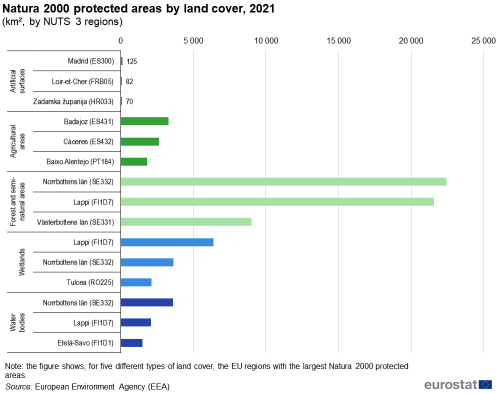
In 2021, the two NUTS level 3 regions with, by far, the largest Natura 2000 protected areas were the Finnish region of Lappi (30 000 km²) and the Swedish region of Norrbottens län (29 700 km²); the protected areas in both of these regions were mainly forest and semi natural areas, but they also had quite large wetlands and water bodies. The next largest protected areas – with between 5 000 km² and 11 000 km² – were observed in Västerbottens län and Jämtlands län (Sweden), Cáceres, Badajoz and Jaén (Spain) and Tulcea (Romania).
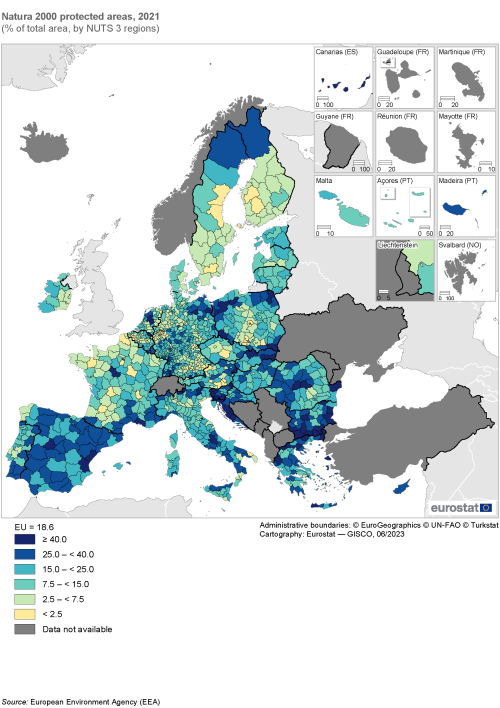
The figures above reflect, to a large extent, the size of various administrative units – with the relatively sparsely populated regions of northern Finland and Sweden being particularly large when measured in terms of area. Map 1 provides an alternative analysis, detailing the share of Natura 2000 protected areas in each NUTS level 3 region. Among the 1 148 regions for which data are available, there were 67 where at least 40.0 % of the total area was protected (as shown by the darkest shade of blue in the map). Natura 2000 sites covered approximately three quarters of the total area of Primorsko-goranska županija in Croatia (75.1 %) and Tulcea in Romania (73.8 %): in the former, most of the protected areas were forest and semi natural areas; in the latter, a relatively large share of the protected area was composed of wetlands. These were, by far, the highest regional shares: Natura 2000 sites covered around three fifths (59.2 %) of the total area in the eastern Slovenian region of Obalno-kraška, which was the third highest share.
The regional distribution of protected sites was relatively skewed insofar as close to one third of NUTS level 3 regions – or 417 out of 1 148 regions – reported that the share of Natura 2000 sites in their total area was higher than the EU average of 18.6 %. There were three regions that had the same share and 728 regions where a lower than average share was recorded. At the bottom end of the distribution, there were 76 (mainly urban) regions where less than 2.5 % of the total area was designated as a Natura 2000 site (they are shown in a yellow shade in Map 1); the lowest regional shares were recorded in Graz (Austria) and Gliwicki (Poland).
Figure 1 presents further information on Natura 2000, listing the largest protected areas across NUTS level 3 regions for five different land cover categories. As noted above, this information reflects, at least to some degree, the size of individual administrative units. Forest and semi-natural areas was the most common type of land cover for Natura 2000 sites. In 2021, the two regions that had the largest overall protected areas – Norrbottens län in Sweden and Lappi in Finland – also had the largest protected areas covered by forest and semi-natural areas, both with more than 21 000 km². Their protected areas covered by forest and semi-natural areas were more than twice as large as in Västerbottens län (also in Sweden), where forest and semi-natural areas covered 9 000 km² of protected area. Lappi and Norrbottens län also recorded the largest Natura 2000 protected areas covered by wetlands and by water bodies. In the case of the former, Tulcea in Romania had the third largest area, while Etelä-Savo in Finland had the third largest area covered by water bodies.
The situation was different for the other two categories shown in Figure 1. Three Iberian regions – Badajoz and Cáceres in Spain and Baixo Alentejo in Portugal – recorded the largest Natura 2000 protected areas covered by agricultural areas in 2021, while the largest protected areas covered by artificial surfaces were reported in the Spanish capital region of Madrid, followed by Loir-et-Cher in France and Zadarska županija in Croatia.
Forests
Forests are biologically diverse ecosystems that play a considerable role in reducing the risk of natural disasters, including floods, droughts, landslides and other extreme events. Globally, forests are essential in the fight to mitigate climate change given their function as a carbon sink. However, forests are not only important for the health of the planet, they also promote the health and well-being of individuals, as well as providing a recreational escape.
A New EU Forest Strategy for 2030 (COM(2021) 572 final) is a flagship initiative of the European Commission that forms part of the European Green Deal. It builds on the EU’s biodiversity strategy and includes objectives/targets for reforestation and afforestation of biodiverse forests, including a pledge to plant an additional 3 billion trees by 2030, ensuring the right mix of tree species not only in forests, but also in agroforestry, agricultural and urban areas.
In recent years, forest fires have repeatedly blazed across large swathes of many EU Member States, particularly in southern Europe. While controlled fires can maintain biodiversity and promote regeneration (for example, clearing underbrush and creating open spaces for new growth), severe and uncontrolled fires lead to extreme degradation and biodiversity loss, killing or displacing wildlife and destroying habitats. These large fires may also pollute the air and water, alter the local climate and/or contribute to global warming.
Since 2000, the European Forest Fire Information System (EFFIS) has been recording fires detected with the use of satellite images; this service is since 2017 part of the EU Copernicus observation program. This information can be used to analyse the scale and magnitude of burnt areas. The EFFIS time series identifies all fires that are larger than 30 hectares for the period 2000–2022.
Statistics on forest fires vary considerably from one year to the next, reflecting seasonal meteorological and drought conditions, as well as other factors. According to the EFFIS, there were 8 813 km² of burnt areas by wildfires across the EU in 2022; the second highest area since records began. Of particular concern was the fact that 44 % of area burnt by wildfires in 2022 concerned Natura 2000 sites and therefore had a direct impact on biodiversity.
Map 2 presents information on forest fires, detailing burnt areas for NUTS level 3 regions; it compares the burnt area in 2022 with the average burnt area during the period 2008–2021 (which is the base value for an index = 100). Across the EU, the burnt area from forest fires in 2022 was 2.55 times as high (index of 255) as the average level recorded during the period 2008–2021. The considerable area covered by wildfires in 2022 was principally concentrated in southern and south-eastern EU Member States – in particular, across Spain and Romania – as well as in southern France and areas close to the Mediterranean Sea. The skewed nature of the distribution was such that there were 177 NUTS level 3 regions where the index of burnt areas was higher than the EU average in 2022, compared with 989 regions which had lower indices.
The danger of forest fires is linked to a range of climatic factors, although weather conditions alone cannot predict where wildfires will be ignited. Other than weather conditions, other factors such as the type of forests and fuel types (monoculture plantations of eucalyptus or pines are more prone to forest fires than primary and old-growth forests) and topography also determine the conditions of fire spread, while the vast majority of fires are linked to human actions. The weather – particularly high temperatures, low relative humidity and strong winds, as well as the type of forest – may however be used to predict the potential spread and intensity of fires.
The average number of days with high to extreme fire danger can be computed by using the Canadian forest fire weather index system to derive a fire weather index (FWI) that estimates weather-driven fire danger. This combines temperature, wind speed, relative humidity and precipitation to give a quantitative value of fire danger on a certain day. Daily projections for a spatial grid of approximately 20 km by 28 km are summarised according to six different classes of fire danger (from low danger up to extreme danger).
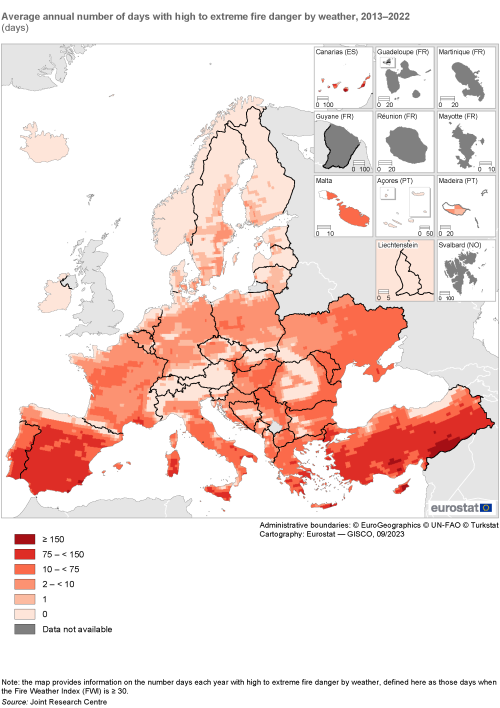
Map 3 presents information on the average annual number of days with high to extreme fire danger (based on those days when the FWI was greater than or equal to 30) for the period 2013–2022. The data from this model confirm that the highest risk of fire danger is generally recorded on the Iberian Peninsula, as well as in southern Italy and Greece.
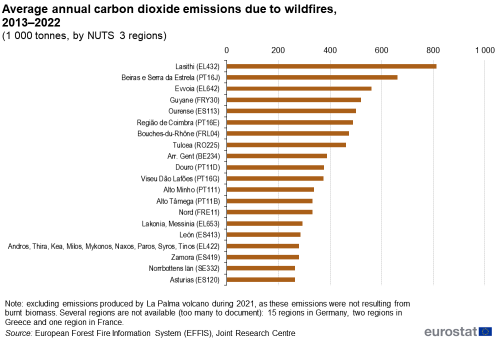
The final part of this section looks at a related issue, namely, carbon dioxide emissions resulting from wildfires. This information is sourced from the European Forest Fire Information System (EFFIS). Emissions data for wildfires are derived from the Copernicus Atmosphere Monitoring Service, Global Fire Assimilation System, operated by the European Centre for Medium-Range Weather Forecast (ECMWF). It produces daily estimates of wildfire and biomass burning emissions by assimilating observations from the Terra and Aqua satellites. Note that the information presented excludes emissions produced by La Palma volcano during 2021 (as these emissions did not result from burnt biomass).
Figure 2 shows those NUTS level 3 regions with the highest annual carbon dioxide emissions due to wildfires. During the period 2013–2022, there were five EU regions that reported, on average, more than 500 000 tonnes of carbon dioxide emissions each year. Unsurprisingly, given the location of most wildfires, the highest quantities were predominantly recorded in southern EU Member States. A peak was observed in the southern Greek region of Lasithi (812 000 tonnes of carbon dioxide emissions due to wildfires), followed by Beiras e Serra da Estrela in Portugal, Evvoia in Greece, Guyane in France and Ourense in Spain.
Air pollution
Air pollution harms both human health and the environment. It concerns the release into or the presence in the air of pollutants (particles or gases). Human-induced activities can lead to a considerable deterioration in air quality, for example, through industrial processes (including electricity generation), the burning of any solid fuel – whether of fossil or biogenic origin – transport, agriculture and the generation or treatment of waste. Naturally occurring air pollution can result, among other sources, from volcanic eruptions, desert dust or forest fires.
Fine particulate matter covers particles with a diameter of 2.5 micrometres or less (otherwise referred to as PM2.5). The WHO established new global air quality guidelines to protect public health in September 2021: 5 µg/m³ for PM2.5, measured as an annual mean, reflecting new scientific evidence showing that air pollution harms human health even at relatively low concentrations.
Air pollution can cause serious illnesses as fine particulate matter can be carried deep into the lungs where it can cause inflammation. Some of the most common causes of premature death attributed to air pollution include heart disease, stroke, lung disease, lung cancer, and asthma; note these illnesses also have an associated economic cost through lost working days and healthcare expenditure.
While air quality in the EU has generally improved in recent decades, some urban populations remain exposed to high concentrations of air pollutants, for example, as a result of residential combustion, industrial and transport activities. An increasingly ageing and urbanised European population counteracts some of the health gains associated with reductions in ambient air pollution concentrations. Firstly, older people and children are more sensitive to air pollution. Secondly, a higher rate of urbanisation typically means that more people are exposed to PM2.5 concentrations, which tend to be higher in cities.
The EEA estimates that across the EU around 238 000 premature deaths can be attributed to fine particulate matter in 2020. To tackle air pollution and achieve the EU’s zero pollution vision for 2050, the European Commission has set an intermediate target to reduce premature deaths from exposure to air pollution by at least 55 % by 2030 (as compared with 2005) and has proposed a revision (COM(2022) 542 final) of its air quality standards to align them more closely with the recommendations of the WHO.
Unsurprisingly, the highest absolute counts of premature deaths associated with fine particulate matter were often observed in some of the most populous (predominantly urban) NUTS level 3 regions; many of these were located in southern and south-eastern EU Member States. In each of these, anthropogenic emissions, meteorological and other conditions (such as orography) favour the accumulation of air pollutants in the atmosphere. In 2020, the highest number of premature deaths attributed to fine particulate matter was recorded in the northern Italian region of Milano (4 537), followed – at some distance – by Barcelona in Spain (3 320) and two more Italian regions –Roma (3 309) and Torino (3 163). There were relatively few regions at the upper end of the distribution, with only five more regions where 2 000–3 000 premature deaths were attributed to air pollution. Four of these were capital regions – Bucureşti in Romania, Sofia (stolitsa) in Bulgaria, Madrid in Spain and Miasto Warszawa in Poland – the other region in this group was Napoli in Italy.
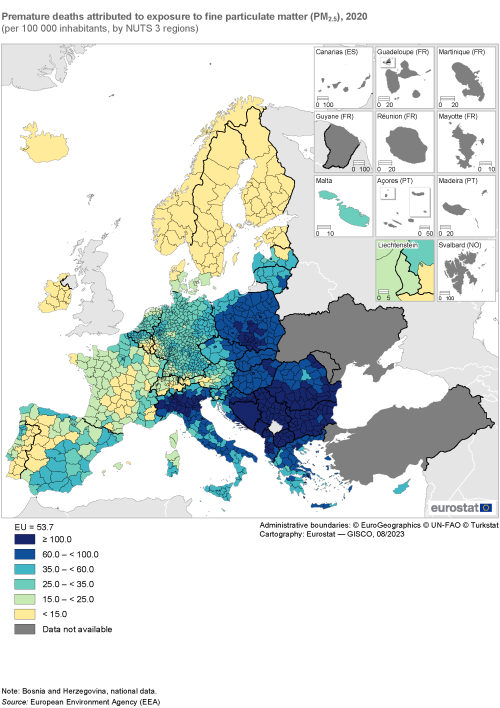
In 2020, the number of premature deaths attributed to exposure to fine particulate matter averaged 53.7 per 100 000 inhabitant across the EU. The regional distribution was skewed: of the 1 152 NUTS level 3 regions for which data are available (no information for Canarias in Spain, the French outermost regions, or the Portuguese Regiões Autónomas da Madeira é dos Açores), there were 825 – or 71.6 % of all regions – where the number of premature deaths attributable to air pollution per 100 000 inhabitants was below the EU average.
While the absolute number of premature deaths attributed to exposure to fine particulate matter was highest in some of the most populous NUTS level 3 regions of the EU, the most significant impacts of air pollution when normalised by population were generally observed in eastern EU Member States. When expressed per 100 000 inhabitants, Sofia (stolitsa) and Vidin in Bulgaria were the only regions to record a rate of more than 200 premature deaths in 2020. There were 19 regions where the number of premature deaths per 100 000 inhabitants was within the range of 150–176: this group included eight additional regions located in Bulgaria, as well as four in Romania, three in Poland and two from each of Italy and Croatia. Extending the analysis, there were 113 NUTS level 3 regions across the EU where the number of premature deaths attributable to air pollution was at least 100.0 per 100 000 inhabitants (these regions are shown in the darkest shade of blue in Map 4).
At the other end of the range, there were 116 NUTS level 3 regions where the number of premature deaths attributed to exposure to fine particulate matter was less than 15.0 per 100 000 inhabitants in 2020 (as shown by the yellow shade). This group – where air pollution had a very low impact on human health – included every region of Finland and (20 out of 21) regions in Sweden (Hallands län was the exception). At the bottom end of the distribution, there were 32 regions with rates that were less than 1.0 premature death per 100 000 inhabitants; this group was principally composed of regions located in Finland and Sweden, with the Portuguese regions of Alto Alentejo and Beiras e Serra da Estrela the only exceptions.
Energy
In recent decades, changes in the weather and better insulated housing have modified the demand for heating and cooling. While warmer temperatures reduce the need for heating in winter, very hot summers lead to greater use of air conditioning, especially in southern Europe and increasingly in south-eastern Europe. Heating and cooling degree days are indices based on the weather: they are designed to describe heating/cooling energy requirements in buildings. The indices are derived from meteorological observations of air temperature, interpolated to regular grids at 25 km resolution. The results are subsequently aggregated to a regional level, based on the NUTS classification. Heating degree days are evaluated when the daily mean air temperature is equal to or below 15°C, while cooling degree days are evaluated when the daily mean air temperature is equal to or above 24°C.
Heating degree days have decreased over time: across the EU, values fell overall by 14 % between 1982 and 2022. By contrast, cooling degree days in 2022 were almost three times as high in 2022 (140 degree days) as they were in 1982 (48 degree days), suggesting that the demand for air conditioning increased at a rapid pace. As may be expected the highest numbers of heating degree days were recorded in northern regions of the EU, while the highest numbers of cooling degree days were recorded in southern regions of the EU. In 2022, the peak values across NUTS level 2 regions were recorded in:
- Övre Norrland and Mellersta Norrland in northern Sweden and Pohjois- ja Itä-Suomi in Finland for heating degree days;
- Malta, Cyprus and Extremadura in Spain for cooling degree days.
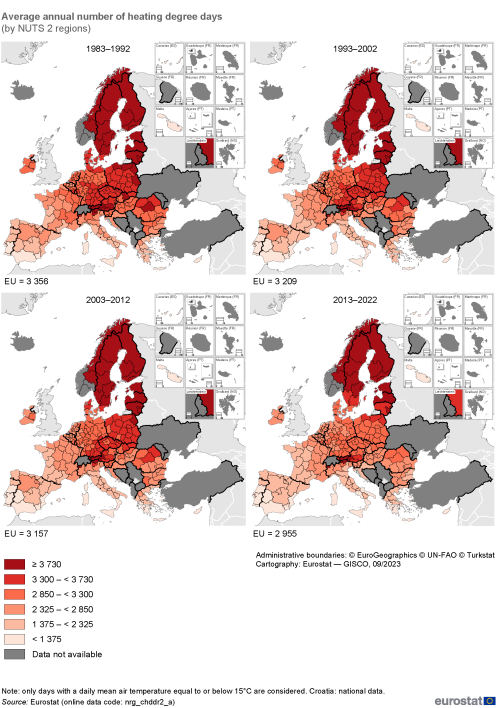
Map 5 provides an analysis of developments for heating degree days during the period 1983–2022. It is split into four separate parts to show developments over recent decades, with the number of heating degree days falling in every NUTS level 2 region during this period. The largest reductions between 1983 and 2022 were recorded in southern EU Member States (Greece, Spain, Italy, Cyprus, Malta and Portugal). The number of heating degree days fell overall by more than 30.0 % in Canarias, Ciudad de Ceuta, Illes Balears and Andalucía (all in Spain), as well as Área Metropolitana de Lisboa and Algarve (both in Portugal).
Map 6 shows a similar analysis for the development of cooling degree days (again for the period 1983–2022). The largest relative increases in cooling degree days between 1983 and 2022 were recorded in Vidurio ir vakarų Lietuvos regionas (Lithuania); Latvia (a single region at this level of detail) and three regions located in Poland – Pomorskie, Świętokrzyskie and Lubelskie; in all five regions, the overall number of cooling degree days remained relatively low. In absolute terms, the number of cooling degree days increased by a very large margin – more than 300 additional cooling degree days across six regions of Spain, five regions in each of Greece and Italy, as well as Cyprus and Malta (both single regions at this level of detail). The highest increases were recorded in Illes Balears (Spain) and Ionia Nisia (Greece), where the number of cooling degree days increased by more than 400 during the period under consideration.
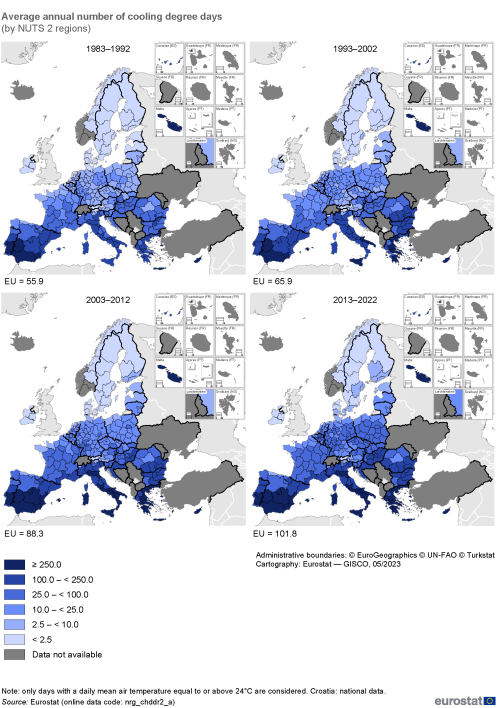
(by NUTS 2 regions)
Source: Eurostat (nrg_chddr2_a)
Source data for figures and maps
Data sources
The European Commission has set up a sustainable development monitoring system – the EU SDG Indicator set 2023 – which is led by Eurostat. It contains a set of 100 indicators that are reviewed on an annual basis. These indicators are used to monitor progress towards the SDGs in an EU context and also form the basis for an annual publication Sustainable development in the European Union – Monitoring report on progress towards the SDGs in an EU context.
European Environment Agency (EEA)
The European Environment Agency (EEA) provides data on a broad range of environmental topics. Within this chapter, EEA data have been used for the following indicators:
- Natura 2000 protected areas;
- air pollution.
Natura 2000 protected areas
SDG 14 and SDG 15 concern ‘life below water’ and ‘life on land’. Among their goals, they seek to conserve and sustainably use the oceans, seas and terrestrial ecosystems, halting land degradation and biodiversity loss. Natura 2000 is a network of areas that have been designated as protected sites under the Birds Directive and the Habitats Directive. The objective is to contribute to ensuring the favourable conservation status of the habitats and species they have been set up to protect. The Birds Directive establishes a protection regime for all bird species naturally occurring in the EU. It includes the designation by EU Member States of special protection areas (SPA) for particularly threatened bird species and for all migratory birds. This approach was extended through the Habitats Directive, which provides for the designation of sites of community importance (SCI), as well as the strict protection of certain species; it aims to support the conservation of habitat types and species listed in its annexes.
Natura 2000 protected areas are compiled for five different types of Corine land cover classes: artificial surfaces; agricultural areas; forest and semi-natural areas; wetlands; and water bodies. Along with their area in absolute terms, derived indicators can also be produced to show – for a particular region or country – the proportion of land and inland water areas covered as protected sites.
For more information on Natura 2000 see:
- Natura 2000 sites designation – European Commission, Directorate-General for Environment
- The Natura 2000 protected areas network – European Environment Agency (EEA)
Air pollution
Air quality is assessed by the concentration of various pollutants in ambient air. The EEA is the source for statistics presented on air pollution from particulate matter (PM). Based on the size of the particles, various categories of particulate matter can be defined: the statistics presented here concern fine particulate matter – PM2.5, in other words, particles with a diameter of 2.5 micrometres (μm) or less.
Directive (EU) 2016/2284 of the European Parliament and of the Council of 14 December 2016 on the reduction of national emissions of certain atmospheric pollutants which entered into force on 31 December 2016 sets national emission reduction commitments for PM2.5 (and four other transboundary air pollutants that have a significative negative impact on human health and the environment) for each EU Member State. The EU set exposure reduction targets and limit values for various air pollutants in the Ambient Air Quality Directives. For PM2.5, Directive 2008/50/EC of the European Parliament and of the Council of 21 May 2008 on ambient air quality and cleaner air for Europe set an annual average of 25 µg/m³ as the annual limit value and an annual average of 20 µg/m³ as an indicative limit value. In 2021, the WHO published new air quality guidelines, whereby annual average concentrations of PM2.5 should not exceed 5 µg/m³ in order to protect human health. As part of the European Green Deal, the EU is revising its air quality standards to align them more closely with the recommendations of the WHO. In October 2022, the European Commission made a proposal to revise the Ambient Air Quality Directives, including a new target, whereby annual average concentrations for PM2.5 should not exceed 10 µg/m³.
The indicator presented on premature deaths attributed to exposure to fine particulate matter is expressed in absolute numbers and more generally per 100 000 inhabitants. The latter is one of the indicators used to monitor SDG 11. Under the European Green Deal’s zero pollution action plan, the European Commission set a goal to reduce the number of premature deaths caused by PM2.5 by at least 55 % by 2030 (compared with 2005). The revision of the Ambient Air Quality Directives, coupled with stricter requirements to tackle air pollution at source (such as from agriculture, industry, transport, buildings and energy) should assist in reaching this target.
Premature deaths are deaths that occur before a person reaches an expected age. This expected age is typically the life expectancy of a country, stratified by sex and age. Premature deaths are considered preventable if their cause can be eliminated.
Joint Research Centre
The European Commission’s Joint Research Centre (JRC) contributes to wildfire disaster risk reduction through the development and operation of the European forest fire information system (EFFIS). It provides continuous monitoring from satellites of the fire situation in Europe and the Mediterranean basin, supporting civil protection operations by detailing wildfires and issuing timely warnings about potential wildfire hazards.
The development of a pan-European approach arose from a series of EU regulations requiring the European Commission to have an overview of wildfire risks in Europe. The fire database is an important component of the EFFIS, presenting data for a wide range of countries in Europe, the Middle East and North Africa. Data on wildfires are collected for the burnt area, the number of fires, and the average size of fires as well as fire causality. Currently, burnt areas mapped in EFFIS represent, on average, about 95 % of the total area burnt by wildfires. Note also that the total area burnt may include agricultural and urban areas that were burnt during wildfires, which are not strictly considered forest fires.
After a test phase, the EFFIS adopted the Canadian forest fire weather index system as a method to assess fire danger levels. It provides a numerical rating of the fire danger based on various weather and fuel conditions, taking account of the moisture content of surface litter and organic layers as well as the rate at a which a fire will spread after ignition. The index can range from 0 to over 100, with the results mapped to six fire danger classes that are the same for all countries. This results in a harmonised picture of the spatial distribution of fire danger levels (with higher values indicating more severe fire conditions):
- very low fire danger: < 5.2;
- low fire danger: 5.2 – < 11.2;
- moderate fire danger: 11.2 – < 21.3;
- high fire danger: 21.3 – < 38.0;
- very high fire danger: 38.0 – < 50.0;
- extreme fire danger: ≥ 50.0
For more information on forest fires, see:
- San-Miguel-Ayanz, J., Durrant, T., Boca, R., Maianti, P., Libertá, G., Oom, D., Branco, A., de Rigo, D., Ferrari, D., Rolglia, E., Scionti, N. (2023) Advance Report on Forest Fires in Europe, Middle East and North Africa 2022, EUR 31479 EN, Publications Office of the European Union, Luxembourg, 2023, ISBN 978-92-68-02143-9, doi:10.2760/091540, JRC133215
- San-Miguel-Ayanz, J., Schulte, E., Schmuck, G., Camia, A. (2013), The European Forest Fire Information System in the context of environmental policies of the European Union, Forest Policy and Economics 29, p.19–25.
Eurostat
Heating degree days and cooling degree days
Indices for heating and cooling degree days are weather-based indices designed to describe the need for heating/cooling energy requirements in buildings. The information is derived from meteorological observations of air temperature, interpolated to regular grids that are 25 km by 25 km.
Heating degree days (HDD) index: measures the severity of the cold in a specific time period taking into consideration outdoor and average room temperatures (in other words, the need for heating in a building). The calculation of HDD relies on a base temperature, defined as the lowest daily mean air temperature for which heating is not required. The value of the base temperature depends in principle on several factors associated with the building and the surrounding environment. By using a general climatological approach, the base temperature is set to a constant value of 15°C (below which, it is assumed heating is required). The HDD index is evaluated for each day the temperature falls below this threshold, and is computed as 18°C minus the mean air temperature of the day in question. In other words, if the daily mean air temperature is 12°C, the value of the HDD index is 6 (18°C minus 12°C).
Cooling degree days (CDD) index: measures the severity of the heat in a specific time period taking into consideration outdoor and average room temperatures (in other words, the need for cooling in a building). As for the HDD, the calculation of CDD relies on a base temperature – the highest daily mean air temperature for which cooling is not required. The base temperature is set to a constant value of 24°C (above which, it is assumed cooling is required). The CDD index is evaluated for each day the temperature rises above this threshold, and is computed as the mean air temperature of the day in question minus 21°C. In other words, if the daily mean air temperature is 26°C, the value of the HDD index is 5 (26°C minus 21°C).
The source dataset is monthly data published by the JRC, available on the AGRI4CAST Resources Portal. Eurostat republishes the data and calculates annual figures by summing the monthly data. The results can be aggregated and presented at different NUTS levels or for individual EU Member States.
Context
Broad environmental policies and actions
The EU is fully committed to implementing the 2030 Agenda for Sustainable Development and has embarked on a transition towards a low-carbon, climate-neutral, resource-efficient and circular economy; the European Commission adopted the first EU Voluntary Review on progress in the implementation of the 2030 Agenda for Sustainable Development (COM(2023) 700 final) in May 2023. In particular, the EU’s 2030 climate and energy framework set out several objectives: a 40 % cut in greenhouse gas emissions; a 32 % share of energy from renewable sources; and a 32.5 % improvement in energy efficiency (compared with 1990 levels).
The European Green Deal is the EU’s growth strategy to become a ‘modern, resource-efficient and sustainable economy’ – the first climate-neutral continent by 2050 – it is fully consistent with the SDGs that are concerned with the environment. The European Green Deal seeks to turn climate and environmental challenges into opportunities, for example, by undertaking to reduce net emissions of greenhouse gases to zero by 2050, ensuring economic growth is decoupled from resource use with no person and no place left behind, cutting pollution, and restoring biodiversity.
In September 2020, the European Commission proposed a new EU target to reduce net emissions by at least 55 % by 2030; this was endorsed by European leaders in December 2021. In July 2021, the European Commission presented a package of legislative initiatives with the goal of making the European Green Deal a reality. This included, among others, proposals for:
- a Directive on energy efficiency;
- a revision to the EU’s emission trading system;
- an initiative to support the development of sustainable aviation fuels;
- a revision to the Energy Tax Directive;
- a revision to the Directive on deployment of the alternative fuels infrastructure;
- proposals to support the development of FuelEU Maritime – green European maritime space;
- a Communication ‘Fit for 55’ – delivering the EU’s 2030 climate target (reducing net emissions by 55 %) on the way to climate neutrality by 2050.
In July 2023, the European Committee of the Regions (CoR) adopted an opinion on Fostering the potential and synergies of the EU Green Deal initiatives for regions and cities. The opinion suggests a set of concrete actions to be undertaken by the European Commission, with the ambition to increase the impact of many EU initiatives, such as the mission on climate-neutral and smart cities, the Green Capital and Green Leaf Awards, and the Green City Accord.
In May 2022, Decision (EU) 2022/591 of the European Parliament and of the Council of 6 April 2022 on a General Union Environment Action Programme to 2030 (otherwise referred to as the 8th Environment Action Programme (EAP)) entered into force; it provides a legally agreed common agenda to guide the EU’s environmental policy until 2030. The 8th EAP calls for active engagement of all stakeholders at all levels of governance to ensure that EU climate and environment laws are effectively implemented. It forms the basis for the EU to achieve the UN’s 2030 Agenda and its SDGs. It has six priority objectives:
- achieving the greenhouse gas emission reduction target for 2030 and climate neutrality by 2050;
- enhancing adaptive capacity strengthening resilience and reducing vulnerability to climate change;
- advancing towards a regenerative growth model, decoupling economic growth from resource use and environmental degradation, and accelerating the transition to a circular economy;
- pursuing a zero-pollution ambition for air, water and soil and protecting the health and well-being of Europeans;
- protecting, preserving and restoring biodiversity;
- reducing environmental and climate pressures related to production and consumption (particularly in the areas of energy, industry, buildings and infrastructure, mobility, tourism, international trade and the food system).
The European Commission will monitor progress towards these objectives with the 8th EAP monitoring framework adopted in July 2022.
Circular economy
In March 2020, the European Commission adopted a circular economy action plan. It includes initiatives along the entire life cycle of products, targets how products are designed, promotes circular economy processes, encourages sustainable consumption, and aims to ensure that waste is prevented and that resources used are kept in the EU economy for as long as possible. It is one of the central building blocks of the European Green Deal, as the transition to a circular economy should help reduce pressure on natural resources, create sustainable growth and jobs, achieve the EU’s 2050 climate neutrality target, and halt biodiversity loss.
Biodiversity
The European Commission has identified five main issues contributing to the loss of biodiversity: changes in land and sea use, overexploitation, climate change, pollution, and invasive alien species. The EU Biodiversity Strategy for 2030 – Bringing nature back into our lives aims to ensure that the EU’s biodiversity will be on the path to recovery by 2030 for the benefit of people, the planet, the climate and the economy. As part of the strategy, the EU has introduced the following targets: legal protection for at least 30 % of its land and sea area as part of a trans-European nature network; the protection of all remaining EU primary and old-growth forests; that at least 10 % of agricultural area is under high-diversity landscape features; that three billion new trees are planted in the EU; that at least 25 000 km of free-flowing rivers are restored.
In June 2022, the European Commission adopted proposals for damaged ecosystems as part of a Nature Restoration Law designed to restore wetlands, rivers, forests, grasslands, marine ecosystems, urban environments and the species they host through measures such as rewilding, the planting of additional trees, greening cities and infrastructure, or removing pollution to allow nature to recover. One specific area concerns measures to mitigate the unavoidable impact of wildfires, with calls for managing vegetation and avoiding the accumulation of fuels on the ground.
Forests
A New EU Forest Strategy for 2030 is a flagship initiative that forms part of the European Green Deal. It builds on the EU’s Biodiversity Strategy for 2030 recognising the central and multifunctional role of forests, and the contribution the forest-based value chain can make to help achieve a sustainable and climate neutral economy by 2050 while preserving livelihoods and prosperous rural areas. Three of its key proposals concern:
- restoring Europe’s forests, soils, wetlands and peatlands, with the goal to increase absorption of carbon dioxide;
- setting new targets for natural carbon removals – 310 million tonnes;
- recognising the role that bioenergy can play in the phasing-out of fossil fuels, while introducing strict new rules to protect areas of high biodiversity and to avoid harvesting unsustainable forests.
One specific area concerns measures to mitigate the unavoidable impact of wildfires, with calls for managing vegetation and avoiding the accumulation of fuels on the ground.
Air pollution
The long-term objective of EU policymaking on air is to achieve levels of air quality that do not result in unacceptable impacts on, and risks to, human health and the environment. In 2021, the European Commission adopted, as part of the European Green Deal, an EU Action Plan: ‘Towards zero pollution for air, water and soil’ (COM(2021) 400 final). The EU aims to improve air quality to protect human health and the environment. More specifically, EU policies aim to reduce the number of premature deaths and sicknesses caused by air pollution and to reduce pollution pressure on ecosystems and biodiversity. The European Commission proposed EU targets to reduce, by 2030, the number of premature deaths attributed to particulate matter by 55 % (as compared with 2005).
Direct access to
- Energy, transport and environment statistics – 2020 edition
- Eurostat regional yearbook – 2023 edition
- Sustainable development in the European Union – Monitoring report on progress towards the SDGs in an EU context – 2023 edition
- Sustainable development in the European Union – Statistical annex to the EU voluntary review – 2023 edition
Online publications
Manuals and further methodological information
- Environment statistics – methodology
- EU statistics on income and living conditions (EU-SILC) methodology
- Methodological manual on territorial typologies – 2018 edition
- Statistical regions in the European Union and partner countries – NUTS and statistical regions 2021 – 2020 edition
Metadata
- Air pollutants by source sector (ESMS metadata file – env_air_emis_esms)
- The EU SDG indicator set 2023
- Directive (EU) 2016/2284 of the European Parliament and of the Council of 14 December 2016 on the reduction of national emissions of certain atmospheric pollutants, amending Directive 2003/35/EC and repealing Directive 2001/81/EC
- Directive 2008/50/EC of the European Parliament and of the Council of 21 May 2008 on ambient air quality and cleaner air for Europe
- Summaries of EU legislation: cleaner air for Europe
- Summaries of EU legislation: national emission limits for certain air pollutants
Copernicus
European Commission
- 8th Environment Action Programme
- 8th Environment Action Programme – Communication on the monitoring framework
- A European Green Deal
- Biodiversity – Information System for Europe
- Biodiversity strategy for 2030
- EU Voluntary Review on the Implementation of the 2030 Agenda for Sustainable Development
- Knowledge Centre for Biodiversity
- Natura 2000
- New EU Forest Strategy for 2030
- Zero pollution action plan
- First ‘zero pollution’ monitoring and outlook
European Environment Agency (EEA)
- Air quality health risk assessments
- Air quality in Europe – 2022 report
- Air quality index
- European Climate Adaptation Platform (Climate-ADAPT)
- The Forest Information System for Europe (FISE)
- Natura 2000 network viewer
- Zero pollution monitoring assessment
Joint Research Centre
- EU Biodiversity Strategy dashboard
- European Forest Fire Information System (EFFIS)
- Global Wildfire Information System (GWIS)
- Zero Pollution Outlook 2022
United Nations
Maps can be explored interactively using Eurostat’s statistical atlas (see user manual).
This article forms part of Eurostat’s annual flagship publication, the Eurostat regional yearbook.
