Archive:SDG 7 - Affordable and clean energy (statistical annex)
This Statistics Explained article has been archived - for recent articles on sustainable development in the European Union see here.
Ensure access to affordable, reliable, sustainable and modern energy for all
Data extracted in April 2022.
Planned article update: June 2023.
Highlights
This article is a part of a set of statistical articles, which are based on the Eurostat publication ’Sustainable development in the European Union — Monitoring report on progress towards the SDGS in an EU context — 2022 edition’. This report is the sixth edition of Eurostat’s series of monitoring reports on sustainable development, which provide a quantitative assessment of progress of the EU towards the SDGs in an EU context.
SDG 7 calls for ensuring universal access to modern energy services, improving energy efficiency and increasing the share of renewable energy. To accelerate the transition to an affordable, reliable and sustainable energy system that fulfils these demands, countries need to facilitate access to clean energy research and technology and to promote investment in resource- and energy-efficient solutions and related infrastructure.
Full article
Context
Everyday life and the workings of the economy depend on reliable and affordable energy services, such as electricity supply, heating and cooling, and transport services. Energy enables the smooth functioning of all economic sectors, from micro-enterprises to large business, from agriculture to mining, manufacturing, construction and services. The EU still relies heavily on fossil fuels for its energy and faces a number of challenges to securing affordable, reliable and sustainable energy supplies. Reducing total energy consumption and using renewable energies, while ensuring security of supply, competitiveness and access to affordable energy for all its citizens, are some of the ways the EU can contribute to achieving SDG 7. As reflected in the ‘Delivering on the European Green Deal’ package, increased energy efficiency and a shift towards renewable energy production are crucial for the EU, especially in light of the climate crisis.
Affordable and clean energy in the EU: overview and key trends
Monitoring SDG 7 in an EU context involves looking at developments in energy consumption, energy supply and access to affordable energy. As shown in Table 1, good progress has been made in almost all areas over the past few years. The largest progress was observed in energy consumption. The measures taken in response to the COVID-19 pandemic and the related restrictions on public life and lower economic activity remarkably reduced consumption in 2020. Thus, the EU was able to reach its 2020 target and, based on the progress achieved so far, including the pandemic’s effects in 2020, appears to be on track towards its 2030 target. The reduction in energy consumption also helped with progress on energy supply. The EU met its 2020 renewable energy target and similarly appears to be on track to meeting its 2030 target. Moreover, energy import dependency saw a small improvement in 2020, although overall it has moved away from the SDG objective over the past five years. In contrast, access to affordable energy has been improving over the past few years, even though 2020 saw an increase in the number of people unable to keep their home adequately warm. It is important to note that the most recent data presented in this chapter refer to 2020 and therefore do not yet reflect the recent developments related to the rise in energy prices and the effects of Russia’s invasion of Ukraine.
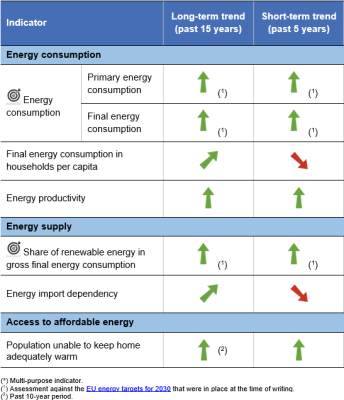
Table 1: Indicators measuring progress towards SDG 7, EU
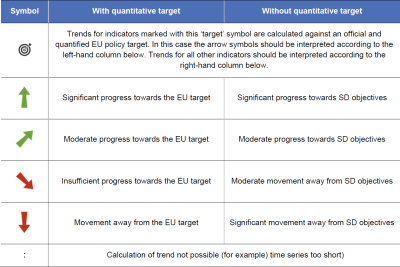
Table 2: Explanation of symbols for indicating progress towards SD objectives and targets


Energy consumption
Increasing energy efficiency is one of the main pillars for reaching an affordable, reliable, sustainable and modern energy system as envisaged in SDG 7. Efficient energy systems reduce consumption and costs, decrease energy dependencies and diminish the environmental and climate impacts linked to energy supply and use. The EU consequently aims to improve energy efficiency along the whole energy supply chain.
Measures against the COVID-19 pandemic have helped to put the EU on track towards its 2030 energy efficiency target
The EU aims to increase its energy efficiency by at least 20 % by 2020 and 32.5 % by 2030. Because these targets were set in relation to business-as-usual projections of energy consumption, they have been translated into absolute levels of energy consumption for monitoring purposes. This means that by 2020, the unofficial milestone for the EU without the UK was that energy consumption should not exceed 1 312 million tonnes of oil equivalent (Mtoe) of primary energy and 959 Mtoe of final energy [1]. By 2030, the EU should not consume more than 1 128 Mtoe of primary and 846 Mtoe of final energy [2]. The proposed new 2030 target would mean that the EU should consume no more than 1 023 Mtoe of primary and 787 Mtoe of final energy [3].
The EU’s primary energy consumption has seen a general downward trend since 2005, reaching 1 236.5 Mtoe in 2020. Over the whole period, primary energy consumption fell by 261.0 Mtoe or 17.4 %. In comparison, final energy consumption fell by 133.9 Mtoe or 12.9 %, reaching 906.8 Mtoe in 2020. Long-term progress on both fronts was due to various factors, including a structural transition towards less energy-intensive industries in many Member States and improvements in end-use efficiency in the residential sector. However, increases in energy consumption between 2014 and 2017 partly reflect a return to average heating demand after an exceptionally warm 2014 and stronger year-on-year economic growth, which could not be offset by energy savings [4]. Small reductions in primary energy consumption and stabilisation of final energy consumption in 2018 and 2019 may be traced back to a general increase in energy efficiency. However, this improvement was partly offset by higher consumption in the service sector, rising industrial production and growth in the number of households [5].
The remarkable drop in energy consumption of more than 8 % from 2019 to 2020 was mainly a result of measures taken to tackle the COVID-19 pandemic and the related restrictions on public life and lower economic activity. In addition, long-term trends such as the further increase in energy efficiency and of renewable energies in the energy mix [6], as well as comparatively mild weather in 2020, may have further helped to reduce energy consumption [7]. As a result, the EU met its 2020 energy efficiency target. If the short-term trend observed between 2015 and 2020 continues, the EU would also meet its 2030 reduction targets for primary and final energy consumption. However, it can be expected that the economic recovery in 2021 has led to an increase in energy consumption (see the article on COVID-19 impacts), although it might remain below 2019 levels as the pandemic continues to shape energy and economic activities [8]. Therefore, additional energy efficiency improvements seem necessary to ensure the EU meets its 2030 target.
EU citizens’ energy consumption at home remained stable
Households account for about a quarter of final energy consumption. At home, people use energy in particular for heating, cooling, cooking, lighting, sanitary purposes and appliances. The level of household energy consumption mainly depends on outdoor temperatures, energy performance of buildings, use and efficiency of electrical appliances, and behaviour and economic status of inhabitants (for example, their desired or affordable level of thermal comfort, frequency of clothes washing, use of TV-sets, games and lighting preferences).
Household energy consumption appears to have stagnated over the past five years. In 2020, the average household energy consumption was 555 kilograms of oil equivalent (kgoe) per EU inhabitant, which is just about 0.5 % more than in 2015.
When viewed over the longer term, efficiency improvements, in particular in space heating, seem to have balanced the effect of population growth and increases in the number and size of dwellings. Since 2005, energy consumption per EU inhabitant has fallen by 9.3 %, with a slight downward trend in total household energy consumption offsetting a 2.8 % or 12.0 million [9] increase in the population over the same period.
The EU has increased its productivity
Recent trends in Europe point to a decoupling of economic growth from energy consumption, which is measured here using gross domestic product (GDP) and gross available energy (GAE) respectively. Between 2005 and 2020, GAE fell by 16.5 % with half of the reduction taking place in 2020. Over the same period, GDP grew by 13.1 % with a dip in 2009 during the economic crisis [10]. As a result, energy productivity — which measures GDP per unit of energy input — has continuously increased from EUR 6.3 per kgoe in 2005 to EUR 8.6 per kgoe in 2020.
Energy supply
To achieve the SDG 7 aim of ensuring an affordable, clean and secure energy system, the EU is seeking to increase the share of renewable energy in gross final energy consumption to at least 32 % by 2030 [11]. Most renewable energy sources are considered to be practically inexhaustible or renew within a human lifetime. In contrast, fossil energy sources regenerate over millions of years and are the main source of man-made greenhouse gas (GHG) emissions, thus contributing significantly to the climate crisis. In addition, fossil fuels such as natural gas and crude oil are mainly imported from outside the EU, exposing consumers to significant costs and to the risk of supply shortages, for example due to geopolitical conflicts. The risks increase as dependency on a single country grows. Therefore, the EU seeks to increase domestic energy production in particular from renewable energy sources, reduce its energy consumption, and build and update infrastructure which will allow clean energy to be distributed across the EU.
The share of renewables has kept rising, putting the EU on track to meeting its 2030 target
Use of renewable energy has grown continuously in the EU, with its share doubling since 2005 when renewables covered only 10.2 % of gross final energy consumption. By 2020, this figure had reached 22.1 %. Reductions in investment costs, more efficient technologies, supply chain improvements and support schemes for renewable energy sources have driven this increase [12]. Due to this steady growth, the EU met its 2020 target of increasing the share of renewable energy to 20 %. The EU appears furthermore on track to meeting the 32 % target (and the proposed 40 %) in 2030. However, the measures taken against the COVID-19 pandemic reduced final energy consumption in 2020, increasing the share of renewables in gross final energy consumption by 11.1 % from 2019 to 2020 (from 19.9 % in 2019 to 22.1 % in 2020). This rapid increase is exceptional and might partly be reversed with final energy consumption partially returning to pre-pandemic times.
The share of renewable energy grew in all of the three areas monitored here, namely electricity, heating and cooling, and transport. In 2020, the share of renewables was highest in electricity generation at 37.5 %, followed by heating and cooling at 23.1 %, and transport at 10.2 %. Since 2005, the share of renewable energy in transport has increased more than five-fold, up from only 1.8 %. If the trend continues at this pace, the EU will meet its 2030 target for renewables to supply at least 14 % of the energy consumed in road and rail transport [13]. The second largest increase was realised in electricity generation where renewables doubled their share. Both the share of renewables in electricity and in transport energy consumption saw a significant increase in 2020 compared with 2019 due to the reduction of energy consumption in both sectors. The progress in the share of renewables in heating and cooling was in line with former years while energy consumption in buildings remained relatively stable.
In 2020, the share of renewable energy in gross final energy consumption varied widely across Member States, due to differences in the availability of renewable sources and financial and regulatory support. Sweden had a substantial lead with a share of 60.1 % followed by Finland and Latvia with shares of 43.8 % and 42.1 %, respectively. These particularly high shares were reached through the use of hydropower and solid biofuels, which are considered to be more ecologically friendly than conventional energy sources but can still negatively impact other SDGs such as those on health, water and marine and terrestrial ecosystems [14]. Still, wind and solar energy have also increasingly contributed to the growth of renewable energy in final energy consumption in most EU countries.
Imports of fossil fuels still cover more than half of the EU’s energy demand
Despite continuous growth in renewable energy sources over the past decade, fuel imports from non-EU countries remained an important source for meeting the EU energy needs, contributing 57.5 % of gross available energy (GAE) — as measured by net imports (imports minus exports) — in 2020. This is almost the same share as in 2005, when imports covered 57.8 %. This stagnation can be explained by two opposing developments. On the one hand, the EU reduced its energy consumption and increased the use of domestic renewables. On the other hand, however, the EU saw a reduction in the primary production of fossil fuel because of exhausted or uneconomical domestic sources, particularly natural gas [15]. Therefore, in 2020, net imports were highest for oil and petroleum products (97.0 % imported), followed by natural gas (83.6 % imported) and solid fuels (predominantly coal) (35.9 % imported). Net imports of renewable energy including biofuels accounted for 8.5 % of gross available renewable energy in 2020 and just 1.7 % of total net imports [16].
Russia continued to be the main supplier of energy to the EU in 2020, accounting for 43.6 % of gas, 28.9 % of petroleum product and 53.7 % of solid fuel imports from outside the EU. The next largest suppliers of gas and petroleum products were European countries that are not part of the EU (mainly Norway and the UK), delivering 25.4 % of gas and 16.5 % of petroleum imports. The second largest source for solid fuels was North America at 18.8 % [17]. All percentages reported here refer to shares of total imports from outside the EU only, so do not account for energy traded between Member States.
In 2020, all Member States were net importers of energy, with 16 importing more than half of their total energy consumption from other countries (EU countries and non-EU countries). Countries with the highest shares of imports in 2020 were the island countries Malta (97.6 %) and Cyprus (93.1 %) as well as Luxemburg (92.5 %), all of which covered virtually all of their energy needs with imports.
Access to affordable energy
SDG 7 emphasises the need for affordable energy for reasons of social equality and justice. The European Pillar of Social Rights also places energy among the essential services everyone should have access to. The inability to keep the home adequately warm is a survey-based indicator used to monitor access to affordable energy throughout the EU. A lack of access to affordable energy is strongly associated with low levels of income in combination with high expenditure on energy and poor building efficiency standards [18].
Access to affordable energy was improving until the onset of the pandemic
The EU has made some progress on improving access to affordable energy over the past few years. Between 2012 and 2019, the share of people unable to afford to keep their homes adequately warm fell steadily, reaching 6.9 % in 2019. However, in 2020 the share rose again to 8.2 %. This increase was likely to have been caused by the COVID-19 pandemic and a change in the German EU-SILC survey’s methodology (see also the article on SDG 1 ‘No Poverty’). This change resulted in the share of people unable to afford to keep their homes adequately warm in Germany growing from 2.5 % in 2019 to 9.0 % in 2020. Only nine other Member States saw an increase from 2019 to 2020, but mostly of less than one percentage point.
In 2020, 20.0 % of people with an income below the poverty threshold reported an inability to keep their home adequately warm, which is 1.8 percentage points higher than in 2019. This means that around a fifth of the poorer EU population suffered from energy poverty. In contrast, only 5.8 % of people with an income above the poverty threshold couldn’t afford to keep their homes adequately warm — an increase of 1.2 percentage points when compared with 2019.
In 2020, 20 Member States indicated that less than 10 % of their population reported an inability to keep their homes adequately warm. Northern and most western European countries, with particularly cold winters, had the lowest shares of people without affordable access to heating. In contrast, the lack of adequate warmth appeared to be a problem particularly in southern and south-eastern Europe. This distribution can be traced mainly to poor building energy efficiency, including the lack of suitable heating systems and insulation, leading to higher heating costs. In addition, the generally lower income levels in these regions affect housing standards and the ability to pay for fuel. The existence and design of financial interventions by the respective governments might also play an important role in alleviating energy poverty and helping to keep homes adequately warm [19].
Presentation of the main indicators
Definitions of energy terms/concepts
There are a variety of energy indicators to measure energy consumption at different stages of the supply chain and to measure progress towards the EU energy targets. The following list explains the indicators and the differences between them.
Gross available energy (GAE): represents the total energy demand of a country. It is defined as: primary production + recovered/recycled products + imports – exports + stock changes.
Gross inland energy consumption (or gross inland consumption; GIC): represents energy demand including international aviation but excluding maritime bunkers. It is defined as: gross available energy – international maritime bunkers.
Total energy supply: represents the total energy delivered and/or consumed in a country excluding deliveries to international aviation and international marine bunkers. It is defined as: gross inland energy consumption – international aviation.
Primary energy consumption (PEC): represents a country’s total energy demand including consumption of the energy sector itself, losses during transformation and distribution, and the final consumption by end users. This means it excludes, for example, natural gas used in non-energy products, such as chemicals. It is defined as: gross inland energy consumption – non-energy use of energy carriers.
Primary energy consumption (2020–2030): measures the progress towards the EU’s 2020 and 2030 energy efficiency targets. It deviates from primary energy consumption only in that it excludes ambient heat. It is defined as: primary energy consumption – gross inland consumption of ambient heat (heat pumps).
Gross final energy consumption (or gross energy consumption): is the basis for measuring the share of renewable energies according to Directive 2009/28/EC on the promotion of renewable energies. It represents the energy commodities delivered for energy purposes to industry, transport, households, services including public services, agriculture, forestry and fisheries, the consumption of electricity and heat by the energy branch for electricity, heat and transport fuel production, and losses of electricity and heat in distribution and transmission.
Final energy consumption (FEC) (or final consumption – energy use): measures a country’s energy use by end users, such as households, industry and transport. It excludes the energy used by the energy sector itself and losses incurred during energy transformation and distribution and any non-energy use of energy carriers. It is defined as: primary energy consumption – consumption by the energy sector – transformation/distribution losses – statistical differences.
Final energy consumption (2020–2030): measures the progress towards the EU’s 2020 and 2030 energy efficiency targets. It deviates from final energy consumption by excluding ambient heat and including international aviation and energy consumption of blast furnaces. It is defined as: final energy consumption – final energy consumption of ambient heat (heat pumps) + international aviation + transformation input blast furnaces (all products) – transformation output blast furnaces (all products) + energy sector blast furnaces (all fossil fuels).
Energy consumption

This indicator measures a country’s total energy needs excluding all non-energy use of energy carriers (such as natural gas used for producing chemicals rather than for combustion). Primary energy consumption represents a country’s total energy demand before of any energy transformation, excluding energy carriers used for non-energy purposes. In comparison, final energy consumption covers the energy consumed by end users, such as industry, transport, households, services and agriculture.
).png)
Compound annual growth rate (CAGR) assessed against the EU energy targets for 2030 that were in place at the time of writing: primary energy consumption: – 1.3 % per year (observed) and – 1.1 % per year (required to meet the 2030 target) in the period 2005–2020; – 1.8 % per year (observed) and – 1.2 % per year (required to meet the 2030 target) in the period 2015–2020; final energy consumption: – 0.9 % per year (observed) and – 0.8 % per year (required to meet the 2030 target) in the period 2005–2020; – 1.1 % per year (observed) and – 0.8 % per year (required to meet the 2030 target) in the period 2015–2020.
Source: Eurostat (sdg_07_10) and (sdg_07_11)
.png)
Source: Eurostat (sdg_07_10)
.png)
Source: Eurostat (nrg_bal_c)
.png)
Source: Eurostat (nrg_bal_c)
Final energy consumption in households per capita

This indicator measures how much energy each citizen consumes at home, excluding transport. Data are not temperature-adjusted, so variations from year to year are due in part to weather.
.png)
Compound annual growth rate (CAGR): – 0.6 % per year in the period 2005–2020; 0.1 % per year in the period 2015–2020.
Source: Eurostat (sdg_07_20)
.png)
Source: Eurostat (sdg_07_20)
Energy productivity

This indicator measures the amount of economic output produced per unit of gross available energy. Gross available energy represents the quantity of energy products needed to satisfy all demand of entities in the geographical area under consideration. Economic output is either given as euros in chain-linked volumes to the reference year 2010 at 2010 exchange rates (Figure 7) or in the unit PPS (purchasing power standards) (Figure 8).
.png)
Compound annual growth rate (CAGR): 2.0 % per year in the period 2005–2020; 2.0 % per year in the period 2015–2020.
Source: Eurostat (sdg_07_30)
.png)

This indicator is defined as the share of renewable energy consumption in gross final energy consumption, according to the Renewable Energy Directive [20]. The gross final energy consumption is the energy used by end consumers (final energy consumption) plus grid losses and power plants’ own consumption.
.png)
Compound annual growth rate (CAGR) for the total assessed against the EU renewable energy target for 2030 that was in place at the time of writing: 5.3 % per year (observed) and 4.7 % per year (required to meet the 2030 target) in the period 2005–2020; 4.4 % per year (observed) and 4.0 % per year (required to meet the 2030 target) in the period 2015–2020.
Source: Eurostat (sdg_07_40)
.png)
Source: Eurostat (sdg_07_40)
Energy import dependency

Energy import dependency shows the share of a country’s total energy needs that are met by imports from other countries. It is calculated as net imports divided by the gross available energy. Energy import dependency = (imports – exports) / gross available energy.
.png)
Compound annual growth rate (CAGR) for the total: – 0.04 % per year in the period 2005–2020; 0.5 % per year in the period 2015–2020.
Source: Eurostat (sdg_07_50)
.png)
Source: Eurostat (sdg_07_50)
Population unable to keep home adequately warm

This indicator monitors access to affordable energy throughout the EU. It measures the share of people unable to afford to keep their home adequately warm. The data are collected as part of the EU Statistics on Income and Living Conditions (EU-SILC) to monitor the development of poverty and social inclusion in the EU. Data collection is based on a survey, which means that indicator values are self-reported.
.png)
Compound annual growth rate (CAGR): – 1.9 % per year in the period 2010–2020; – 3.1 % per year in the period 2015–2020.
Source: Eurostat (sdg_07_60)
.png)
Source: Eurostat (sdg_07_60)
Direct access to
More detailed information on EU SDG indicators for monitoring of progress towards the UN Sustainable Development Goals (SDGs), such as indicator relevance, definitions, methodological notes, background and potential linkages, can be found in the introduction of the publication ’Sustainable development in the European Union — Monitoring report on progress towards the SDGs in an EU context — 2022 edition’.
Notes
- ↑ Eurostat (2021), Energy saving statistics: Energy efficiency targets for 2020 and 2030 — Statistics Explained.
- ↑ European Parliament and Council of the European Union (2019), Decision amending directive 2012/27/EU on energy efficiency for the withdrawal of the United Kingdom from the EU.
- ↑ European Commission (2021), Proposal for a Directive of the European Parliament and of the Council on energy efficiency (recast), COM/2021/558 final, Brussels.
- ↑ European Commission (2019), Energy efficiency progress report, COM(2019) 224 final, Brussels.
- ↑ Eurostat (online data code: (nrg_bal_c)); European Commission (2020), 2020 assessment of the progress made by Member States towards the implementation of the Energy Efficiency Directive 2012/27/EU and towards the deployment of nearly zero-energy buildings and cost-optimal minimum energy performance requirements in the EU in accordance with the Energy Performance of Buildings Directive 2010/31/EU, COM(2020) 954 final.
- ↑ The substitution of fossil energy by renewable energies leads to a reduction of PEC via a statistical definition. The physical energy content method basically means fossil and biogenic fuel input quantities are multiplied by their calorific value. Wind, hydropower or photovoltaics produce energy with an efficiency of 100 %, geothermal energy with 10 % and nuclear energy with 33 %. This means that PEC decreases disproportionately with increasing substitution of fossil and nuclear fuels by renewable energies.
- ↑ See, for example, for Germany (key energy consuming country in the EU): AGEB e.V. (2020), Energieverbrauch in Deutschland im Jahr 2020. For the EU with preliminary data see European Commission (2020), 2020 assessment of the progress made by Member States towards the implementation of the Energy Efficiency Directive 2012/27/EU and towards the deployment of nearly zero-energy buildings and cost-optimal minimum energy performance requirements in the EU in accordance with the Energy Performance of Buildings Directive 2010/31/EU, COM(2020) 954 final.
- ↑ See, for example, the trend in monthly energy data (Eurostat online data code: (nrg_quantm)) or analysis from Germany (key energy consuming country in the EU): AGEB e.V. (2022), Energieverbrauch zieht wieder an.
- ↑ Source: Eurostat (demo_gind).
- ↑ Source: Eurostat (nrg_bal_c) and (nama_10_gdp).
- ↑ European Parliament and the Council of the European Union (2018), Directive (EU) 2018/2001 on the promotion of the use of energy from renewable sources.
- ↑ European Commission (2019), Renewable energy progress report, COM(2019) 225 final, Brussels, p. 4.
- ↑ European Parliament and the Council of the European Union (2018), Directive (EU) 2018/2001 on the promotion of the use of energy from renewable sources.
- ↑ See e.g. Sayed, E. T. et al. (2021), A critical review on environmental impacts of renewable energy systems and mitigation strategies: Wind, hydro, biomass and geothermal. Science of the total environment, Volume 766 or Best, A., et al. (2021), Assessment of resource nexus-related challenges and opportunities in the context of the European Green Deal. Background report for the EEA Briefing "Applying a 'resource nexus' lens to policy: opportunities for increasing coherence".
- ↑ Source: Eurostat (online data code: (nrg_bal_c)).
- ↑ Source: Eurostat (online data code: (nrg_bal_c)).
- ↑ Source: Eurostat (online data codes: (nrg_ti_sff), (nrg_ti_oil) and (nrg_ti_gas)). Import shares for natural gas were calculated in cubic meters; solid fuel and oil import shares were calculated in tonnes.
- ↑ COM (2020). Commission Recommendation on Energy Poverty, COM(2020) 1563, Brussels.
- ↑ Bouzarovski, S. and Tirado-Herrero, S. (2017), The energy divide: Integrating energy transitions, regional inequalities and poverty trends in the European Union. European Urban and Regional Studies; 24: pp. 69–86.
- ↑ European Parliament and Council of the European Union (2009), Directive 2009/28/EC on the promotion of the use of energy from renewable sources.