Archive:SDG 2 - Zero hunger (statistical annex)
This Statistics Explained article has been archived - for recent articles on sustainable development in the European Union see here.
End hunger, achieve food security and improved nutrition and promote sustainable agriculture (statistical annex)
Data extracted in May 2021.
Highlights

This article provides an overview of statistical data on SDG 2 ‘Zero hunger’ in the European Union (EU). It is based on the set of EU SDG indicators for monitoring of progress towards the UN Sustainable Development Goals (SDGs) in an EU context.
This article is part of a set of statistical articles, which are based on the Eurostat publication ’Sustainable development in the European Union — Monitoring report on progress towards the SDGS in an EU context — 2021 edition’. This report is the fifth edition of Eurostat’s series of monitoring reports on sustainable development, which provide a quantitative assessment of progress of the EU towards the SDGs in an EU context.
Full article
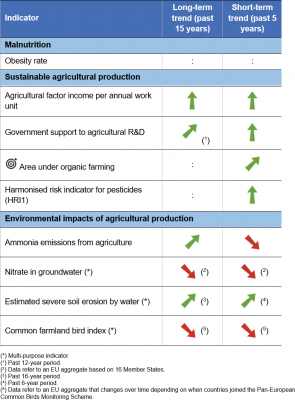
Table 1: Indicators measuring progress towards SDG 2, EU
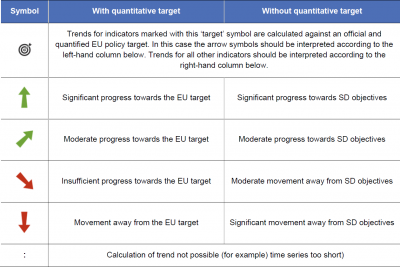
Table 2: Explanation of symbols for indicating progress towards SD objectives and targets


Obesity rate

This indicator is derived from the body mass index (BMI), which is defined as the weight in kilograms divided by the square of the height in metres. People aged 18 years or over are considered obese if their BMI is equal to or greater than 30. The category ‘pre-obese’ refers to people with a BMI between 25 and less than 30. The category ‘overweight’ (BMI equal or greater than 25) combines the two categories pre-obese and obese. The data presented in this section stem from the European Health Interview Survey (EHIS) and the EU Statistics on Income and Living Conditions (EU-SILC).
,_sex,_age_group_and_educational_attainment,_EU,_2017_(%25_of_population_aged_18_or_over).png)
Source: Eurostat (ilc_hch10)
.png)
Source: Eurostat (sdg_02_10)
Agricultural factor income per annual work unit
_evaluation_2021.png)
Agricultural factor income measures the income generated by farming, which is used to remunerate borrowed or rented factors of production (capital, wages and land rents) as well as own production factors (own labour, capital and land). Annual work units (AWUs) are defined as full-time equivalent employment (corresponding to the number of full-time equivalent jobs), which is calculated by dividing total hours worked by the average annual number of hours worked in full-time jobs within the economic territory. This can be interpreted as a measure of labour productivity in the agricultural sector. The data stem from the Economic Accounts for Agriculture (EAA), which provide detailed information on agricultural sector income.
,_EU,_2005-2020_(index_2010%3D100).png)
Compound annual growth rate (CAGR): 3.1 % per year in the period 2005–2020; 2.9 % per year in the period 2015–2020.
Source: Eurostat (sdg_02_20)
,_by_country,_2013_and_2018_(EUR,_chain_linked_volumes_(2010)).png)
Source: Calculations made by the Directorate-General for Agriculture and Rural Development (DG AGRI) based on Eurostat data (sdg_02_20)
Government support to agricultural R&D

This indicator refers to Government Budget Appropriations or Outlays on R&D (GBAORD). GBAORD data measure government support to research and development (R&D) activities or, in other words, how much priority governments place on the public funding of R&D. GBAORD data are built up using the guidelines laid out in the proposed standard practice for surveys of research and experimental development, the OECD’s Frascati Manual from 2015.
.png)
Compound annual growth rate (CAGR): 0.5 % per year in the period 2007–2019; 2.7 % per year in the period 2014–2019.
Source: Eurostat (sdg_02_30)
.png)
Source: Eurostat (sdg_02_30)
Area under organic farming

This indicator is defined as the share of total utilised agricultural area (UAA) occupied by organic farming (existing organically farmed areas and areas undergoing conversion). Organic farming is a production method that puts the highest emphasis on environmental protection and animal welfare considerations. It avoids or largely reduces the use of synthetic chemical inputs such as fertilisers, pesticides, additives and medical products.
.png)
Compound annual growth rate (CAGR): 6.9 % per year (observed) and 9.2 % per year (required to meet target) in the period 2014–2019.
Source: Eurostat (sdg_02_40)
.png)
Source: Eurostat (sdg_02_40)
Harmonised risk indicator for pesticides (HRI1)
_evaluation_2021.png)
The harmonised risk indicator (HRI1) estimates the trends in risk from pesticide use in the EU and its Member States. Unsustainable use of pesticides entails risks and impacts on human health and the environment. The indicator is based on statistics on the quantity of active substances in plant protection products placed on the market under Regulation (EC) No 1107/2009. Those data are multiplied by risk-weighting factors for different groups of active substances as categorised in Commission Directive (EU) 2019/782. The weighting factors reflect pesticide policy, which supports the sustainable use of pesticides and promotes alternative approaches to protecting crops. The indicator is presented as an index relative to the average results for the period 2011 to 2013.
,_by_groups_of_active_substances,_EU,_2011-2018_(index_2011-2013_%3D_100).png)
Compound annual growth rate (CAGR) for HRI1: – 2.2 % per year in the period 2013–2018.
Source: Eurostat (sdg_02_51)
,_by_country,_2013_and_2018_(index_2011-2013_%3D_100).png)
Source: Eurostat (sdg_02_51)
Ammonia emissions from agriculture

The indicator measures the amount of ammonia (NH3) emissions as a result of agricultural production. These emissions result from manure management, applications of inorganic nitrogen fertilisers and animal manure applied to soil, as well as urine and dung deposited by grazing animals. Data for this indicator come from the EU inventory on air pollution compiled by the European Environment Agency (EEA) under the Convention on Long-range Transboundary Air Pollution (LRTAP) and are fully consistent with national air pollution inventories compiled by EU Member States. Data on the utilised agricultural area (UAA) stem from Eurostat’s annual crop statistics. The definition of this indicator is based on the CAP indicator C45 Emissions from agriculture.
.png)
Compound annual growth rate (CAGR): – 0.6 % per year in the period 2003–2018; 0.2 % per year in the period 2013–2018.
Source: Eurostat (sdg_02_60)
.png)
Source: Eurostat (sdg_02_60)
Direct access to
More detailed information on EU SDG indicators for monitoring of progress towards the UN Sustainable Development Goals (SDGs), such as indicator relevance, definitions, methodological notes, background and potential linkages, can be found in the introduction of the publication ’Sustainable development in the European Union — Monitoring report on progress towards the SDGS in an EU context — 2021 edition’.