Archive:GDP and household accounts at regional level
This Statistics Explained article is outdated and has been archived - for recent articles on regional GDP see here.
- Data from March 2012. Most recent data: Further Eurostat information, Main tables and Database.
Maps can be explored interactively using the Eurostat Statistical Atlas (see User's manual).
Gross domestic product (GDP) is a key measure of economic development and growth: the first part of this article presents a regional analysis of European Union (EU) GDP, based upon the level of GDP per inhabitant, as well as how this measure has changed in recent years. Economic accounts provide important information that may be used to make a regional analysis of the economy. These statistics (which are only available in current price terms) are also used for the allocation of expenditure under the EU’s cohesion policy (see Regional policies within the introductory article). Every region in the EU is covered by cohesion policy: however, most structural funds are directed to NUTS level 2 regions whose GDP per inhabitant is less than 75 % of the EU-27 average (on the basis of a three-year average).
The second part of this article looks at regional household incomes (also only available in current price terms). This provides information in relation to primary income (for example, income from work) as well as disposable income that results from redistribution (taxes, social benefits and other transfers) by the state. Note that the data on regional household incomes refer to 2008 whereas the analysis of GDP is based on reference year 2009.
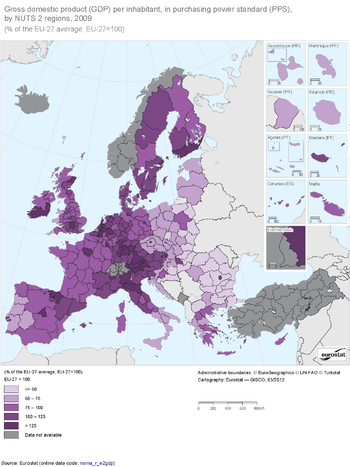
(% of the EU-27 average, EU-27=100) - Source: Eurostat (nama_r_e2gdp)
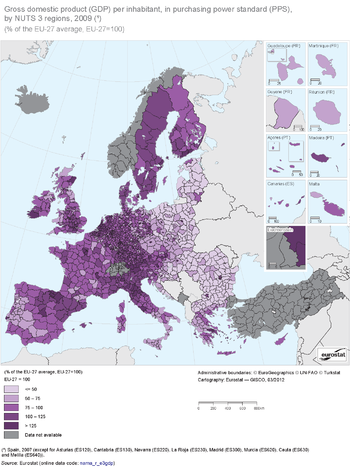
(% of the EU-27 average, EU-27=100) - Source: Eurostat (nama_r_e3gdp)
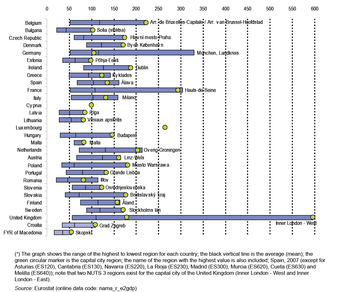
(% of the EU-27 average, EU-27=100) - Source: Eurostat (nama_r_e2gdp)
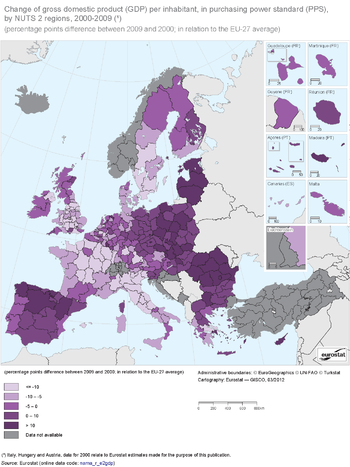
(percentage points difference between 2009 and 2000; in relation to the EU-27 average) - Source: Eurostat (nama_r_e2gdp)

(%) - Source: Eurostat (nama_r_e0digdp), (nama_r_e2gdp) and (demo_r_d3avg)
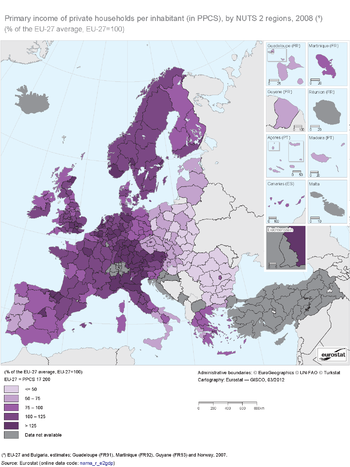
(% of the EU-27 average, EU-27=100) - Source: Eurostat (nama_r_ehh2inc)
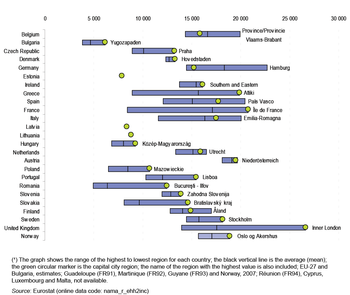
(PPCS per inhabitant) - Source: Eurostat (nama_r_ehh2inc)
Main statistical findings
GDP and household incomes are initially calculated in national currencies, and then converted by purchasing power parities (PPPs) which take account of different price levels between Member States, allowing for a more accurate comparison. For GDP a general parity is used, whereas for household income a specific purchasing power parity for final consumption expenditure is used.
By using PPPs (rather than market exchange rates) these indicators are converted into an artificial common currency called a purchasing power standard (PPS), or in the case of household income a purchasing power consumption standard (PPCS). The use of PPSs and PPCSs makes it possible to compare purchasing power across the regions of Member States that use different currencies and where price levels are different. For more information about the use of PPPs please refer to the data sources and availability section below.
Regional GDP per inhabitant
Map 1 shows GDP per inhabitant in each NUTS level 2 region as a percentage of the EU-27 average, which in absolute terms was 23 500 PPS in 2009, down from 25 000 PPS in 2008. Among the NUTS level 2 regions in the EU, GDP per inhabitant ranged from 6 400 PPS (27 % of the EU-27 average) in Severozapaden in Bulgaria to 78 000 PPS(332 % of the EU-27 average) in the capital city region of Inner London in the United Kingdom; between the two ends of the distribution there was a factor of 12.2 to 1. Luxembourg (266 % of the EU-27 average), the Belgian capital city region (223 %) and the German region of Hamburg (188 %) occupied positions two to four in terms of a ranking of regions with the highest GDP per inhabitant, followed by the Slovakian, French and Czech capital city regions with 178 %, 177 % and 175 % of the EU-27 average respectively. Many of the regions with high GDP per inhabitant were capital city regions or neighbouring regions — this was the case in Belgium, the Czech Republic, Denmark, Ireland, Spain, France, Luxembourg (which is just one region), the Netherlands, Austria, Slovakia, Finland, Sweden and the United Kingdom. In addition, there were several regions with an average GDP per inhabitant more than 25 % above the EU-27 average in southern Germany, around major cities in western Germany, northern Spain and Italy, western Austria, several regions of the Netherlands, and the Belgian region around Antwerpen, the island region of Åland (Finland) and North Eastern Scotland (United Kingdom). As such, the Slovakian and Czech capital city regions of Praha and Bratislavský kraj were the only regions in the Member States that joined the EU in 2004 or 2007 among the 39 regions where the average GDP per inhabitant was more than 25 % above the EU-27 average. The next most prosperous region (by this measure) in the Member States that joined the EU in 2004 or 2007 was a long way behind, namely Bucuresti - Ilfov in Romania at 111 % of the EU-27 average. The Slovenian region of Zahodna Slovenija and the Hungarian region of Közép-Magyarország were the only other regions in the Member States that joined the EU in 2004 or 2007 that had an average GDP per inhabitant (in PPS) that was above the EU-27 average.
Overall, there were 68 regions with an average GDP per inhabitant that was 25 % or more below the EU-27 average. A total of 20 regions were concentrated in six of the EU-15 Member States: Italy (five southern regions), France (four overseas regions), Greece and Portugal (four regions each), the United Kingdom (two regions) and Spain (the region of Extremadura). The remaining 48 regions were in Member States that joined the EU in 2004 or 2007: all of these 12 Member States had at least one region below this level except for Cyprus and Malta. Among these regions there were 22 regions where the average GDP per inhabitant was at most half the EU-27 average, and these regions were found in Bulgaria, Hungary, Poland, Romania and Slovakia. Around 38.5 million people lived in the 22 regions whose GDP per inhabitant in PPS was 50 % of the EU-27 average or less, equivalent to 7.7 % of the EU-27 population.
Generally low average GDP per inhabitant was also recorded in the former Yugoslav Republic of Macedonia and Croatia, although the region of Sjeverozapadna Hrvatska (the capital city region of Croatia) recorded a level equivalent to 78 % of the EU-27 average.
Table 1 presents an analysis of the proportion of the population in 2009 living in regions that had an average GDP per inhabitant (in PPS) below 75 % of the EU-27 average and the proportion above 125 % of the average. In 2009 the proportion of the population living in regions where the average GDP per inhabitant was less than 75 % of the EU-27 average was 23.3 %, while the proportion living in regions where this value was greater than 125 % of the EU-27 average was 19.0 %; the proportion of the population in the mid-range (GDP per inhabitant between 75 % and 125 %) was 57.7 %. The three Baltic Member States, each with just one NUTS level 2 region, had all of their population living in regions with an average GDP per inhabitant below 75 % of the EU-27 average; this was also the case in the former Yugoslav Republic of Macedonia (also just one region). In Romania, Slovakia, Poland, the Czech Republic, Bulgaria, Hungary, Portugal and Slovenia, more than half of the population lived in regions with an average GDP per inhabitant lower than 75 % of the EU-27 average; this was also the case in Croatia.
By contrast, in Luxembourg (one NUTS level 2 region) the entire population lived in a region with an average GDP per inhabitant of more than 125 % of the EU-27 average; in Ireland, the Netherlands and Finland, more than half of the population lived in such regions. On the two island Member States of Cyprus and Malta (each just one NUTS level 2 region) the entire population lived in regions with a mid-range average GDP per inhabitant (between 75 % and 125 % of the EU-27 average), as did the majority of the population in the United Kingdom (86.8 %), France (78.8 %), Sweden (78.5 %), Greece (78.3 %), Spain (77.9 %), Germany (70.5 %), Denmark (69.7 %), Belgium (64.0 %) and Austria (60.6 %).
A more detailed regional analysis
While Map 1 is focused on NUTS level 2 regions, which are particularly important in terms of defining eligibility for structural funds, Map 2 provides a more detailed analysis of regional economies, based on NUTS level 3 regions. Understandably the overall analysis is similar to that for the NUTS level 2 regions, although there are a number of NUTS level 3 regions that are atypical for the higher level (NUTS level 2) regions to which they belong. This phenomenon may often result from commuting inflows into central NUTS level 3 regions from surrounding areas, resulting in a concentration of economic activity in the most built-up areas. For example, in the Bulgarian capital NUTS level 2 region of Yugozapaden the average GDP per inhabitant (in PPS terms) was 75 % of the EU-27 average, but at the more detailed NUTS level 3, the region Sofia (stolitsa) recorded a value of 104.3 % for this indicator while the remaining four NUTS level 3 regions had values below 50 %. A similar situation occurred in the Polish capital city NUTS level 2 region of Mazowieckie where the NUTS level 3 regions of Ostrolęcko-siedlecki and Radomski recorded an average GDP per inhabitant (in PPS) that was less than half the average for Mazowieckie, the latter being pulled up by a relatively high level for the NUTS level 3 region of Miasto Warszawa.
Within the German region of Oberbayern (NUTS level 2) there was a very large range in the values recorded for this indicator between the NUTS level 3 regions: Fürstenfeldbruck recorded an average GDP per inhabitant (in PPS) that was 79.6 % of the EU-27 average whereas München Landkreis recorded a ratio of 330.2 %. In a similar manner in Rheinhessen-Pfalz (NUTS level 2) the NUTS level 3 region Südwestpfalz recorded an average GDP per inhabitant (in PPS) that was 52.3 % of the EU-27 average whereas Ludwigshafen am Rhein (Kreisfreie Stadt) recorded a value of 215.3 %. The German NUTS level 3 regions of Regensburg, Schweinfurt, Wolfsburg, Düsseldorf and Koblenz (all Kreisfreie Städte) recorded an average GDP per inhabitant that was more than double the average for the NUTS level 2 regions of which they were part, namely Oberpfalz, Unterfranken, Braunschweig, Düsseldorf and Koblenz respectively. In a similar vein, the NUTS level 3 region of Oost-Groningen in the Netherlands recorded an average GDP per inhabitant (in PPS) that was 72.8 % of the EU-27 average, which was less than half the level (170 %) recorded in Groningen (NUTS level 2) as a whole.
Major regional differences within countries
Whereas Map 2 highlights a number of cases where there were large differences in GDP per inhabitant between NUTS level 3 regions within the same NUTS level 2 region; Figure 1 provides an analysis of the substantial regional differences within countries. Note that Cyprus and Luxembourg consist of only one region at the NUTS level 3.
In 2009, the highest level of regional average GDP per inhabitant was less than twice the lowest level in Denmark, Malta and Sweden, whereas in the remaining countries shown in Figure 1 the difference was greater, exceeding a factor of 5 to 1 in Germany, France, Poland and Romania and reaching a factor of 10.5 to 1 in the United Kingdom.
In many Member States the capital city region (at the NUTS level 3) had the highest GDP per inhabitant (in PPS): this situation occurred in Belgium, Bulgaria, the Czech Republic, Denmark, Estonia, Ireland, Latvia, Lithuania, Hungary, Malta, Poland, Portugal, Slovenia, Slovakia, Sweden and the United Kingdom (note that there are two NUTS level 3 regions that make up the capital city of the United Kingdom), as well as in Croatia and the former Yugoslav Republic of Macedonia. As such, the capital city region had the highest average GDP per inhabitant in all of the Member States that joined the EU in 2004 or 2007 except for Romania where the highest level was recorded in the region surrounding the capital city region. A similar situation occurred in France where the NUTS level 3 region with the highest average GDP per inhabitant was a region neighbouring the capital city region. Germany was the only Member State where the capital city region at the NUTS level 3 had an average GDP per inhabitant that was below the national average.
Convergence
Map 3 shows the extent to which GDP per inhabitant changed between 2000 and 2009, compared with the EU-27 average (expressed in percentage points of the EU-27 average). It should be noted that the period studied covers several years in which the EU as a whole recorded relatively strong growth followed by the beginnings of the financial and economic crisis. Furthermore, as the analysis is based on a comparison with the EU average, a negative value for an individual region may still reflect actual growth, albeit less than the EU-27 average where growth (in current prices) of 23.0 % was recorded over this period. The analysis compares the situation in two years and does not reflect the movements of individual years between the beginning and the end, but reflects the overall result of these years combined. This overall result may reflect periods when the rate of change for GDP per inhabitant in a region was positive (expansion) combined with periods where there was a negative rate of change (contraction).
Regions that expanded relatively fast, whose GDP per inhabitant increased by more than 10 percentage points compared with the EU-27 average, are shown in the darkest shade of purple. By contrast, regions which experienced lower rates of expansion or even contraction (those with a fall of more than 10 percentage points in GDP per inhabitant compared with the EU-27 average) are shown in the lightest shade of purple.
Several capital city regions recorded large increases, particularly among the Member States that joined the EU in 2004 or 2007. The highest growth rates relative to the EU-27 average were recorded in the capital city regions of Slovakia (+69 percentage points), Romania (+55), Bulgaria (+38) and the Czech Republic (+36), followed by the capital city regions of Greece (+29) and the United Kingdom (+28). Capital city regions also occupied the first two positions at the other end of the range, with the Belgian capital city region (Région de Bruxelles-Capitale/Brussels Hoofdstedelijk Gewest) recording a fall of 33 percentage points relative to the EU-27 average, followed by the Austrian region of Wien (-25 percentage points).
The map shows that this measure of economic performance was above the EU-27 average in the south-western and eastern peripheral areas of the EU, particularly in the regions of the Baltic Member States, Poland, the Czech Republic, Slovakia, Hungary, Romania, Bulgaria, Greece and Cyprus in the east, and Spain in the west. Apart from Spain and Greece, other EU-15 Member States that had one region with growth of more than 10 percentage points relative to the EU-27 average included Luxembourg, the Netherlands, Portugal, Finland and the United Kingdom.
In Bulgaria, the Czech Republic, Poland, Romania, Slovenia and Slovakia every region achieved growth in GDP per inhabitant (in PPS) between 2000 and 2009 that was above the EU-27 average growth rate; this was also the case in the Baltic Member States, Cyprus and Luxembourg all of which are just one region at the NUTS level 2.
By contrast, every region in Denmark, Ireland, Italy, Austria and Sweden recorded a lower increase in GDP per inhabitant (in PPS) than the EU-27 average growth rate, as was the case for Malta (which is just one region). There were 53 regions where GDP per inhabitant fell back 10 percentage points or more relative to the EU-27 average, and none of these were in Member States that joined the EU in 2004 or 2007. These regions were mainly in the United Kingdom (16 regions), France or Italy (11 regions each), while there were four such regions in Sweden, three each in Belgium and Germany and one each in Denmark, Greece, Spain, the Netherlands and Austria.
Overall increase in convergence within the EU
Regional convergence of GDP per inhabitant (in PPS) can be assessed in various ways. The simplest approach is to measure the ratio between the highest and lowest values. By this method, among the EU-27 regions the gap closed from a factor of 17.1 in 2000 to 12.2 in 2009, mainly because of faster growth in Bulgaria and Romania. However, this approach uses only the extreme values and does not take account of the vast majority of regions. A comprehensive evaluation of regional convergence is provided by an indicator of the dispersion of regional GDP: more information about the method of calculation is given below under the heading 'Data sources and availability'. This measure takes account of divergences in GDP per inhabitant in each NUTS level 2 region from the national average, weighted by regional population. Table 1 compares the national values of dispersion (compiled from NUTS level 2 data) for 2000 with those for 2009. In 2009 most of the EU-15 Member States had a lower level of dispersion than the Member States that joined the EU in 2004 or 2007, although this was not the case in Slovenia or Poland. Furthermore, the level of dispersion generally increased between 2000 and 2009 in the Member States that joined the EU in 2004 or 2007: by far the greatest increase was recorded in Bulgaria, while the smallest increases were recorded in Slovenia and Poland. It would therefore appear that the process of economic catch-up taking place in many of the Member States that joined the EU in 2004 or 2007 has been accompanied by increasing regional disparities.
There was a more mixed picture among EU-15 Member States. In Greece the level of dispersion increased considerably, while there were smaller increases in Sweden, the United Kingdom, France, Ireland and Portugal. The level of dispersion declined between 2000 and 2009 within Austria (Eurostat estimates), Finland, Spain, Italy (also Eurostat estimates), Germany, Belgium and Denmark, while it was unchanged (and low) in the Netherlands.
On balance, the increasing convergence within several EU-15 Member States and an increasing convergence between Member States outweighed the increasing divergence within other Member States and as a result Eurostat estimates suggest that there was an increase in regional convergence for the EU-27 as a whole.
A comparison between the data for 2000 and 2009 reveals that six regions managed to pass from a position below the 75 % threshold used for structural funds in the course of this period to reach 75 % or higher: Yugozapaden (Bulgaria), Voreio Aigaio (Greece), Andalucía (Spain), Mazowieckie (Poland), the Região Autónoma dos Açores (Portugal) and Bucuresti – Ilfov (Romania). These regions were home to 18.2 million people in 2009, or around 3.6 % of the population of the EU-27. At the same time, however, GDP per inhabitant (in PPS) in the region of West Wales and The Valleys (United Kingdom) fell from 75 % of the EU-27 average to below this threshold, while in the southern Italian region of Puglia the level of this indicator fell from a position above 75 % of the EU-27 average to a level below this threshold.
Private household income: 2008 results
In market economies with state redistribution mechanisms, a distinction is made between two stages of income distribution. Primary distribution relates to the income of private households generated directly from market transactions, in other words the purchase and sale of factors of production and goods. In particular this includes the income from paid work and self-employment, as well as income received in the form of interest, dividends and rents. Interest and rents payable are recorded as negative items and the balance of all these transactions is known as the primary income of private households.
The second concept is that of disposable income, this is derived from primary income by adding all social benefits and monetary transfers (from state redistribution) and subtracting taxes on income and wealth as well as social contributions and similar transfers — as such, it reflects ‘in-pocket’ income that people can spend or save.
Map 4 provides an overview of primary income per inhabitant in the NUTS level 2 regions for 24 of the Member States: unlike GDP, household income data are not available at NUTS level 3. The average primary income per inhabitant in the EU-27 was 17 200 PPCS in 2008. Primary income ranged from a high of 36 800 PPCS per inhabitant in Inner London (United Kingdom) down to 3 600 PPCS in Severozapaden (Bulgaria), a factor of 10.2 to 1.
One of the most striking features of Map 4 is the relatively high level of income per inhabitant that is registered in regions around capital cities. The highest level of income per inhabitant in the Czech Republic, Denmark, Ireland, Greece, France, Hungary, Poland, Portugal, Romania, Slovenia, Slovakia, Sweden and the United Kingdom was recorded in the NUTS level 2 region containing the capital city; note that six other Member States do not have any regional breakdown available at the level of NUTS level 2 regions. Lisboa (Portugal) and Berlin (Germany) were the only EU-15 regions containing capital cities to report primary income per inhabitant below the EU-27 average, while Bratislavský kraj (Slovakia) was the only capital city region among those Member States that joined the EU in 2004 or 2007 to report primary income per inhabitant above the EU-27 average.
Of the 51 NUTS level 2 regions that reported primary income per inhabitant more than 25 % higher than the EU-27 average in 2008, 19 were in Germany, seven each in Italy and the United Kingdom, six in Austria, four in Belgium, three each in Spain and the Netherlands, and one each in France and Sweden. Centres of high average income per inhabitant were apparent throughout Austria, in southern England and North Eastern Scotland in the United Kingdom, as well as in north eastern Spain. Furthermore, there was a clear north–south divide apparent in Italy (higher incomes in the north) and an east–west divide in Germany and the Netherlands (higher incomes in the west).
There were 28 NUTS level 2 regions with primary income per inhabitant that was 50 % of the EU-27 average or less — all of these regions were located in those Member States that joined the EU in 2004 or 2007 — 10 were in Poland, seven in Romania (all except the capital city region of Bucuresti – Ilfov), six in Bulgaria (every Bulgarian region), four in Hungary and one in Slovakia.
EU-27 primary income was reduced by 13.3 % as a result of state intervention (redistribution), resulting in an average disposable income of 14 900 PPCS per inhabitant in 2008. Inner London (26 600 PPCS per inhabitant) had the highest level of disposable income per inhabitant (as was the case for primary income), while Severozapaden (Bulgaria) reported the lowest level (3 800 PPCS). As such, the ratio between the highest and lowest regional levels was 6.9 to 1 (compared with 10.2 to 1 for primary income).
A comparison between primary income and disposable income shows the levelling influence that state intervention generally plays. Redistribution resulted in considerably higher relative incomes in southern Italy, western Spain and the west of the United Kingdom, as well as in the eastern regions of Bulgaria, Germany, Hungary, Poland and Romania. Although most NUTS level 2 regions reported that disposable income per inhabitant was lower than primary income per inhabitant, there were nevertheless 30 regions which benefited from social benefits and other transfers to such a degree that their disposable income per inhabitant was higher; seven of these regions were in Poland, five each in Portugal and Romania, four each in Greece and the United Kingdom, three in Bulgaria, and one each in Germany and Italy.
Figure 2 shows the variation in disposable income per inhabitant across the EU Member States in 2008 and Norway in 2007. Most capital city regions reported the highest level of disposable income per inhabitant across the regions within their country; this was the case for 14 of the 21 Member States which have more than one NUTS level 2 region. Among the remaining seven Member States with multiple regions (Belgium, Germany, Spain, Italy, the Netherlands, Austria and Finland), disposable income per inhabitant for the capital city region generally remained above the national average; however, this was not the case for the Région de Bruxelles-Capitale/Brussels Hoofdstedelijk Gewest (Belgium) or Berlin (Germany).
Disposable income per inhabitant was 2.5 times as high in Bucuresti – Ilfov as in the Nord-Est region of Romania, the highest ratio between regions in the same country; there was also a relatively wide range in disposable income per inhabitant between the highest and lowest regions of France, Greece, the United Kingdom and Slovakia. At the other end of the range, disposable income per inhabitant was quite homogeneous in Denmark (where the uppermost average regional income was 1.08 times as high as in the lowest region), Austria (1.09), Slovenia (1.16) and Ireland (1.17).
Data sources and availability
The European system of national and regional accounts (ESA) provides the methodology for regional accounts in the EU. ESA95 is fully consistent with worldwide guidelines for national accounts, the 1993 system of national accounts (1993 SNA). Following international agreement on an updated version of the SNA in 2008, the ESA is also being revised.
GDP is the central measure of national accounts, summarising the economic position of a country or region. It can be calculated using different approaches: the output approach; the expenditure approach; and the income approach.
Regional data on the income categories of private households are collected for the purposes of the regional accounts at NUTS level 2. The data on the income of private households for 2008 in Bulgaria (and hence, also the EU-27) are estimates.
Comparisons between where people work and where they live
A regional comparison of the level of economic output can be made by comparing regional GDP with the population of the region in question; this is where the distinction between place of work and place of residence becomes significant. GDP measures the economic output achieved within national or regional boundaries, regardless of whether this was attributable to resident or non-resident employed persons. As a result, regional GDP per inhabitant is based upon a numerator that reflects the place-of-work (the GDP produced in the region) which is divided by a denominator whose value reflects the place-of-residence (the population living in the region). This drawback is particularly relevant when there are significant net commuter flows into or out of a region. Areas that are characterised by a considerable number of inflowing commuters often display regional GDP per inhabitant that is extremely high (when compared with surrounding regions). This is particularly the case for economic centres such as the regions of London (United Kingdom), Wien (Austria), Hamburg (Germany), Praha (Czech Republic) or Luxembourg. Because of this anomaly, high levels of GDP per inhabitant that are recorded for some regions with net commuter inflows do not necessarily translate into correspondingly high levels of income for the people living in the same region.
By contrast, private household income, regardless of whether it is based on primary or disposable income, reflects the income of persons resident in a region. As such, private household income can be directly compared with the resident population in the same region. Apart from commuter flows, other factors can also cause the regional distribution of income not to correspond to the distribution of GDP, these include income from rent, interest or dividends received by the residents of a certain region, but paid by residents of other regions.
Purchasing power parities
Regional GDP is calculated in the local currency of the region (and therefore the country) in question. GDP can be converted into a common currency to make it more easily comparable — for example, converting into euros or dollars.
Exchange rates reflect many factors relating to supply and demand in currency markets, such as international trade, inflation forecasts and interest rate differentials. However, exchange rates do not reflect all the differences in price levels between countries. To compensate for this, GDP can be converted using conversion factors known as purchasing power parities (PPPs) to an artificial common currency, called a purchasing power standard (PPS); this makes it possible to compare the purchasing power of different national currencies. Even within a currency union, such as the euro area, a single currency continues to display different purchasing power across countries, depending on national price levels. In broad terms, the use of PPS series rather than the euro-based series tends to have a levelling effect, as those regions with very high GDP per inhabitant in euro terms also tend to have relatively high price levels (for example, the cost of living in central Paris or London is generally higher than the cost of living in rural areas of France or the United Kingdom).
Calculations for GDP per inhabitant that are based on PPS series instead of euro series can result in considerable differences when ranking regions. For example, in 2009, the Swedish region of Östra Mellansverige was recorded as having a GDP per inhabitant of EUR 26 600, ranking above the Italian region of Marche, with EUR 25 600. However, in PPS terms, Marche, at 24 600 PPS per inhabitant, was above Östra Mellansverige, at 23 800 PPS.
Dispersion of regional GDP per inhabitant
Since 2007, Eurostat has calculated a derived indicator which summarises the differences in GDP per inhabitant across the regions of the same country. The dispersion ‘D’ of regional GDP for NUTS level 2 regions is defined as the sum of the absolute differences between regional and national GDP per inhabitant, weighted according to the regional share of population and expressed as a percentage of national GDP per inhabitant:
In the above equation:
- yi is the regional GDP per inhabitant of region i;
- Y is the national average for GDP per inhabitant;
- pi is the population of region i;
- P is the national population;
- n is the number of regions in the country.
The value of this dispersion indicator is zero if the values of regional GDP per inhabitant are identical in all regions of a country. The level of dispersion will increase, all other things being equal, if the differences in GDP per inhabitant between the regions grow. A value of 30 % means that the GDP per inhabitant of each region, weighted on the basis of regional population, differs from the national value by an average of 30 %.
Context
Economic development is commonly expressed in terms of GDP, which in the regional context may be used to measure macroeconomic activity and growth, as well as providing the basis for comparisons between regions. GDP is also an important indicator from the policy perspective, as it is crucial in determining the extent to which each Member State should contribute to the EU’s budget, while three-year averages of GDP are used to decide which regions should be eligible to receive support from the EU’s structural funds programme.
GDP has also come to be regarded as a proxy indicator for overall living standards. However, by design and purpose, it cannot be relied upon to inform policy debates on all issues. GDP does not measure, for example, environmental sustainability or social inclusion, and these limitations need to be taken into account when using GDP for analysis. Indeed, it is increasingly recognised that GDP alone should not be used to measure economic, social and environmental priorities.
A number of international initiatives have focused on this issue and in August 2009, the European Commission adopted a communication called ‘GDP and beyond: measuring progress in a changing world’ (COM(2009) 433 final), which outlined a range of actions to improve and complement GDP measures. The European Commission noted that there was a clear case for complementing GDP with statistics covering other economic, social and environmental issues, on which individuals’ well-being critically depends. The communication proposed five actions for better measurement of progress in a changing world:
- Action 1: complementing GDP with environmental and social indicators (a comprehensive environmental index, quality of life and well-being);
- Action 2: near real-time information for decision-making (more timely environmental and social indicators);
- Action 3: more accurate reporting on distribution and inequalities;
- Action 4: developing a European sustainable development scoreboard (coordinated by the Directorate-General for the Environment);
- Action 5: extending national accounts to environmental and social issues.
See also
- Economy and finance statistics introduced
- European sector accounts - background (background article)
- GDP per capita, consumption per capita and price level indices
- Household financial assets and liabilities
- National accounts and GDP
- Update of the SNA 1993 and revision of ESA95 (background article)
Further Eurostat information
Publications
- Convergence and disparities in regional Gross Domestic Product - Statistics in focus 46/2011
- Eurostat regional yearbook 2011 - chapter 7
- Eurostat regional yearbook 2011 - chapter 8
- Over-indebtedness of European households in 2008 - Statistics in Focus 61/2010
- Regional discrepancies in private household income continue to narrow in 2008 - Statistics in Focus 59/2011
Main tables
- Regional economic accounts - ESA95 (t_reg_eco)
- Disposable income of private households, by NUTS 2 regions (tgs00026)
- Primary income of private households, by NUTS 2 regions (tgs00036)
Database
- Regional economic accounts - ESA95 (reg_eco)
- Household accounts - ESA95 (reg_ecohh)
- Allocation of primary income account of households at NUTS level 2 (nama_r_ehh2p)
- Secondary distribution of income account of households at NUTS level 2 (nama_r_ehh2s)
- Income of households at NUTS level 2 (nama_r_ehh2inc)
- Household accounts - ESA95 (reg_ecohh)
Dedicated section
Methodology / Metadata
- Gross domestic product (GDP) at current market prices (ESMS metadata file - nama_r_e2gdp_esms)
- Household accounts - ESA95 (ESMS metadata file - reg_ecohh_esms)
- Household Budget Surveys in the EU - Methodology and recommendations for harmonisation – 2003
