Archive:EU-ASEAN cooperation - key labour market statistics
This Statistics Explained article is outdated and has been archived - for recent articles on non-EU countries see here.
Data extracted in March and April 2017. No update planned for this article.
Highlights

(% of persons aged 15–64)
Source: Eurostat (lfsi_emp_a) and the International Labour Organisation (ILOSTAT)
This article is part of a set of statistical articles based on Eurostat’s publication 40 Years of EU–ASEAN Cooperation — Key statistics. It provides a selection of statistics on the European Union (EU) and its Member States in comparison with the Association of Southeast Asian Nations (ASEAN) and its Member States. It focuses on labour market data and covers key indicators concerning the labour force, employment and unemployment.
Full article
Labour force and employment
The labour force — also referred to as the workforce — is made up of economically active persons, in other words people who are employed or unemployed. The activity rate is the share of the labour force in the working-age population, while the employment rate is the share of employed persons in the working-age population. The difference between the two rates reflects the level of unemployment relative to the working-age population. There are many reasons for low activity rates, including a large proportion of the working-age population that is still studying, in early retirement, or not available for employment through long-term sickness, invalidity or caring for family members.
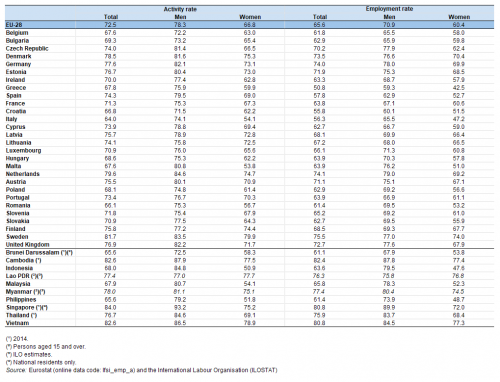
Activity and employment rates for men in 2015 were consistently higher than those for women in all EU Member States as well as all ASEAN Member States except for Lao PDR (see Table 1). Activity rates for women ranged from 50–55 % in Indonesia, the Philippines, Malta, Malaysia and Italy, rising to close to 80 % in Vietnam and Sweden. Activity rates for men were lowest in Brunei Darussalam (2014 data), Croatia, Belgium and Bulgaria (in the range of 72–73 %) and highest in several ASEAN Member States, notably Singapore where this rate reached 93.2 % (2014 data).

(% of persons aged 15–64)
Source: Eurostat (lfsi_emp_a) and the International Labour Organisation (ILOSTAT)
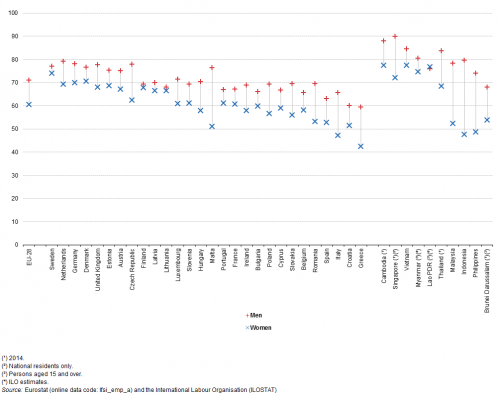
Among the EU Member States, the largest difference between employment rates for men and women in 2015 was in Malta, followed by Italy, Greece, Romania and the Czech Republic (see Figure 1). For the EU-28 as a whole this employment gender gap was 10.5 percentage points in 2015. In a small majority of the ASEAN Member States the gap was greater than in the EU-28, with particularly large differences (as large as or larger than in Malta) in Indonesia, Malaysia and the Philippines; these three countries recorded the lowest employment rates for women among ASEAN Member States, while among the EU Member States the lowest rates for women were observed in Croatia, Malta, Italy and Greece.

(% of persons aged 15–64)
Source: Eurostat (lfsi_emp_a) and the International Labour Organisation (ILOSTAT)
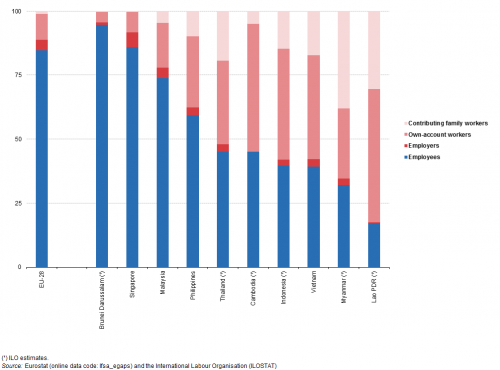
The working status of persons in employment was substantially different in most ASEAN Member States compared with the average situation in the EU-28 as can be seen from Figure 2.
In 2015, Brunei Darussalam had a particularly high proportion of paid employees and consequently fewer self-employed persons — referred to as employers (if having paid employees) or own-account workers — and family workers.
The structure in Singapore was similar to the EU-28 average, albeit with a greater share of employers and a smaller share of own-account workers.
Elsewhere in the ASEAN Member States, the share of contributing family workers was greater than the EU-28 average of 1.1 %, ranging from 4.6 % in Malaysia to 38.1 % in Myanmar. The share of the self-employed was also greater in these other ASEAN countries, particularly for own-account workers. Consequently, the share of paid employees was below the EU-28 average in all ASEAN countries except for Brunei Darussalam and Singapore.

(%)
Source: Eurostat (lfsa_egaps) and the International Labour Organisation (ILOSTAT)
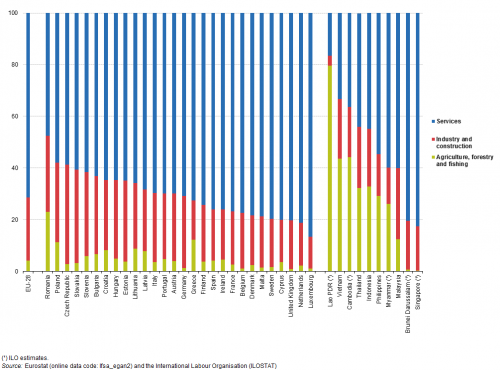
A simplified analysis of the sectoral division of the employed labour force is presented in Figure 3. There are notable differences between the structure in EU Member States and that in most ASEAN Member States, with Brunei Darussalam and Singapore again the exceptions. In 2015, the services share of the labour force in these two Southeast Asian nations was comparable with that in Luxembourg or the Netherlands, whereas in all other ASEAN Member States this share was below the EU-28 average (71.4 %) and in half of the ASEAN Member States it was below the share recorded in Romania (47.5 %), which was the only EU Member State where less than half of the labour force was employed in services. The main counterbalance to the relatively low share of employed persons in services in most ASEAN countries was a relatively high share in agriculture, forestry and fishing: this peaked at 79.6 % in Lao PDR, compared with 4.2 % in the EU-28 and less than 1.0 % in Brunei Darussalam and Singapore.

(%)
Source: Eurostat (lfsa_egan2) and the International Labour Organisation (ILOSTAT)
Unemployment
Unemployed persons are those without work, but actively looking for work. The unemployment rate is calculated as the number of unemployed persons as a proportion of the labour force.
Just prior to the global financial and economic crisis — around 2007 — falling (or at least stable) unemployment rates were witnessed in the EU-28 and all of the ASEAN Member States (see Figure 4). By 2009, this situation had reversed in the EU-28 and to a lesser extent in Singapore, Malaysia, Vietnam and Thailand, while the rate continued to fall in Brunei Darussalam, Cambodia and Indonesia. As the unemployment rate for the EU-28 maintained an upward path through to 2013 (increasing between 2008 and 2013 by 3.9 percentage points), most of the other economies saw their unemployment rates fall in 2010 or 2011; however, unemployment rates moved upwards again in 2013 in most ASEAN countries, but never by more than 0.2 percentage points. After 2013 the unemployment rate fell regularly and quite strongly in the EU-28 (by 0.7–0.9 percentage points each year), whereas unemployment rates in ASEAN initially (in 2014) fell, before rising again in at least half the ASEAN Member States in 2015 and/or 2016.
Between 2009 and 2016 the unemployment rate was lower in all ASEAN Member States than in the EU-28. Among the ASEAN Member States, the lowest unemployment rate during the period from 2006–2016 was generally observed in Cambodia and the highest in Indonesia or the Philippines.

(unemployed persons aged 15 and over as a % of the labour force)
Source: Eurostat (une_rt_a) and the International Labour Organisation (ILOSTAT)
In 2016, unemployment rates were below the EU-28 average (8.4 % for men and 8.8 % for women) in all ASEAN countries. Male and female unemployment rates were quite similar in all of the ASEAN Member States and most of the EU Member States. The main exceptions in 2016 were Greece, Spain and Slovakia where female rates were notably higher and Ireland, Latvia and Lithuania where male rates were clearly higher.

(%)
Source: Eurostat (une_rt_a) and the International Labour Organisation (ILOSTAT)
In 2016, all ASEAN Member States and EU Member States had higher youth unemployment rates (for persons aged 15–24) than their unemployment rates for the total labour force, as can be seen in Figure 6. It should be remembered that these rates are calculated as a percentage of the labour force (not the population) and many people between the ages of 15 and 24 years may be outside of the labour force, for example studying or travelling.
The youth unemployment rate in the EU-28 stood at 18.7 % in 2016, which was around 2.2 times as high as the EU-28’s total unemployment rate. Youth unemployment rates were more than three times as high as overall unemployment rates in Luxembourg, Italy (2015 data) and Romania among the EU Member States, as well as in Brunei Darussalam, Indonesia, Malaysia and Thailand in ASEAN. More than one quarter of the labour force aged 15–24 was without work in a group of principally southern EU Member States — Greece, Spain, Italy, Croatia, Cyprus and Portugal — with most other EU Member States reporting youth unemployment rates between 10 % and 25 %; Germany (7.0 %) was below this range. Among the ASEAN Member States, the highest youth unemployment rates were recorded in Indonesia (18.6 %), the Philippines (13.9 %) and Malaysia (12.1 %), with the other seven ASEAN Member States reporting rates that were consistently below 7.0 %.

(unemployed persons as a % of the labour force)
Source: Eurostat (une_rt_a) and the International Labour Organisation (ILOSTAT)
Source data for tables and graphs
Data sources
The indicators presented are often compiled according to international — sometimes global — standards. Although most data are based on international concepts and definitions there may be certain discrepancies in the methods used to compile the data.
All of the indicators presented for the EU and its Member States have been drawn from Eurobase, Eurostat’s online database.
For ASEAN and its Member States, the data presented have been extracted from the International Labour Organisation (ILO).
For many of the indicators, multiple international statistical sources are available, each with their own policies and practices concerning data management (for example, concerning data validation, the correction of errors, the estimation of missing data, and the frequency of updating). In general, attempts have been made to use only one source for each indicator in order to provide a comparable analysis between the EU Member States or between the ASEAN Member States.
Context
The labour market reflects the supply of labour by individuals and demand from businesses and other employers. Workers offer labour in return for remuneration (pay). The labour market indicators presented here concern the levels of various types of employment and unemployment.
The economically active population is also known as the labour force; it is composed of employed and unemployed persons. Employed persons include employees, the self-employed (employers and own-account workers) and family workers (persons who help another member of the family to run a farm, shop or other form of business). Economically inactive persons are neither employed nor unemployed, for example because they are studying, retired, unable to participate in the labour force or choose not to be a part of the workforce.
Direct access to
- 40 Years of EU-ASEAN Cooperation — Key statistics — online publication
- Asia-Europe Meeting (ASEM) — a statistical portrait — online publication
- South Korea-EU - international trade in goods statistics
- The EU in the world
- LFS main indicators (lfsi)
- Employment and activity - LFS adjusted series (lfsi_emp)
- Employment and activity by sex and age - annual data (lfsi_emp_a)
- Unemployment - LFS adjusted series (une)
- Unemployment by sex and age - annual average (une_rt_a)
- Employment and activity - LFS adjusted series (lfsi_emp)
- LFS series - detailed annual survey results (lfsa)
- Employment - LFS series (lfsa_emp)
- Employment by sex, age and professional status (1 000) (lfsa_egaps)
- Total unemployment - LFS series (lfsa_unemp)
- Unemployment rates by sex, age and educational attainment level (%) (lfsa_urgaed)
- Employment - LFS series (lfsa_emp)
- ASEM partners accounted for 44% of EU28 imports and 30% of exports in 2013 — News release October 2014
- Goods trade with ASEAN countries rebounds from 2009 to 2010 — Statistics in focus 47/2011
- The EU in the world 2013 — A statistical portrait — Statistical book (2013)