Archive:Agriculture - manure storage statistics
This article is outdated and has been archived. For recent articles on Agriculture, see here.
- Data from September 2013. Most recent data: Further Eurostat information, Main tables and Database.
This article presents statistics on manure storage facilities in the European Union (EU). These facilities are found on holdings (almost exclusively) with livestock and are used to store manure before its application on the farm to improve the nutrient content of the land. While manure is a valuable fertiliser if applied correctly and in the right quantities — it can be an environmental risk if applied in surplus or under the wrong conditions (for example, when the land is frozen or there is heavy rainfall).

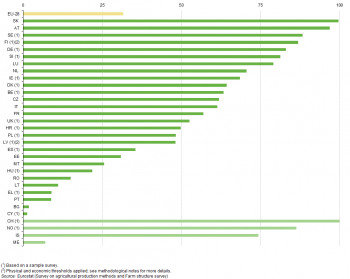
(% share of all livestock holdings) - Source: Eurostat (ef_pmmanstoaa)Source: Eurostat (Survey on agricultural production methods and Farm structure survey)
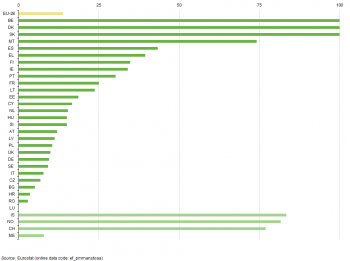
(% share of all holdings with manure storage facilities for solid dung) - Source: Eurostat (ef_pmmanstoaa)
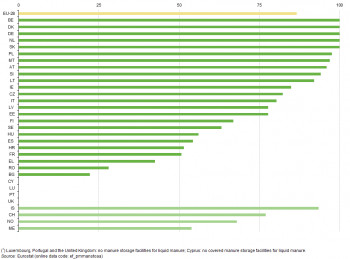
(% share of all holdings with manure storage facilities for liquid manure) - Source: Eurostat (ef_pmmanstoaa)

(% share of all holdings with manure storage facilities for slurry) - Source: Eurostat (ef_pmmanstoaa)
Main statistical findings
The volume of manure produced on a farm relates, among others, to the number, breed, age and gender of livestock, types of feedstuff, climatic conditions and the time of year. Many small livestock farms do not have the land, equipment or time to recycle all of the manure that is generated on-farm. Larger farms also face difficulties in manure management practices, for example, investing in adequate resources for storage. Farmers often choose to apply manure in the spring and early autumn, so their storage facilities might need to be of sufficient size to accommodate manure collected over at least a six-month period.
Manure storage facilities and manure application are closely linked to emissions of ammonia (NH3), nitrous oxides (N2O) and methane (CH4), the latter two both being greenhouse gases — see separate articles on greenhouse gases and ammonia emissions for more details. The level of emissions from manure storage facilities depends on the type of manure storage (manure as a solid, liquid, or slurry) and whether or not the manure storage facility is covered (protected from the elements). When manure is stored or treated as a liquid it decomposes anaerobically (in other words, without the need for oxygen) and can produce a significant quantity of methane; the temperature and the retention time in storage greatly affect the amount of methane produced.
While the storage of manure has environmental consequences, so too does the application of manure. When manure is applied on the land, it tends to decompose under more aerobic conditions and less methane is produced. However, ammonia emissions from manure spreading principally occur during the first 12 hours after the application of manure. Higher levels of emissions tend to be recorded when manure is not incorporated into the soil rapidly. The application of manure during heavy rainfall can result in different environmental risks, such as nitrate losses through leaching and phosphorous losses through sediment that is transported in surface run-off (leading to the pollution of ground and surface waters).
Agricultural holdings with manure storage facilities
There were 2.3 million agricultural holdings in the EU-28 that had manure storage facilities in 2010 (see Table 1). Some 82 % of these holdings had storage facilities for solid dung, 35 % had storage facilities for liquid manure, 26 % had slurry tanks and 5 % had slurry lagoons; note that some agricultural holdings were able to store manure in more than one of these different types of facility. Each type of storage facility has its own characteristics that a farmer must take into consideration: among others these concern differences in storage volume, odour level, potential run-off, retention of nutrient content, potential gas dangers and emissions levels, site requirements and suitability.
There are wide variations in the different types of manure storage facility used across the EU Member States:
- storage facilities for solid dung were found on a majority of holdings that had manure storage facilities in all of the EU Member States in 2010, with the exception of Belgium (just 22 %). Indeed, more than half of the Member States reported that in excess of four fifths of their farm holdings with manure storage facilities had facilities for solid dung: this share rose above 95 % in Bulgaria, Estonia, Slovakia and Romania. In Switzerland, every agricultural holding with manure storage facilities had a storage facility for solid dung and a storage facility for liquid manure;
- liquid manure storage facilities were found on a majority of agricultural holdings with storage facilities in Belgium, Lithuania and Austria (all between 60–64 %), as well as Slovenia (73 %), Poland (78 %) and the Czech Republic (80 %). By contrast, there were no liquid manure storage facilities on agricultural holdings in Luxembourg, Portugal or the United Kingdom;
- slurry tanks were found on a majority of agricultural holdings with storage facilities in Germany, Belgium, Denmark, Ireland and Luxembourg (where the highest proportion was recorded, 82 %) but were uncommon in many of the other EU Member States;
- slurry lagoons were a relatively uncommon option for manure storage in most EU Member States, the highest proportion of holdings with this storage facility being in Spain (31 %) and the Netherlands (40 %).
Livestock holdings with or without manure storage facilities
Some 32 % of agricultural holdings in the EU-28 with livestock had storage facilities for manure in 2010, equivalent to 2.2 million holdings. A relatively low proportion of livestock holdings had manure storage facilities in Cyprus, Bulgaria, Portugal, Greece, Lithuania and Romania (no more than 15 %), while 15 of the EU Member States reported that more than half of their livestock farms had manure storage facilities — this share rising to above 90 % in Austria and Slovakia (see Figure 1).
It is important to consider the overall structure of agriculture in each of the EU Member States when analysing the proportions of livestock farms with and without storage facilities. For example, almost one in five of the EU-28’s livestock farms with manure storage facilities was located in Romania (426 000 holdings in 2010). However, in relation to the total number of livestock holdings in Romania (2.8 million), the proportion of livestock farms with manure storage facilities was relatively low (15 %).
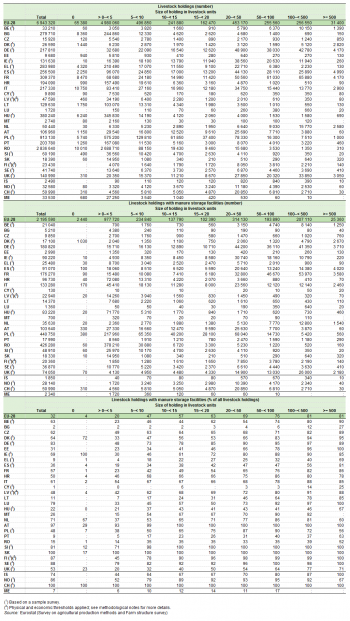
The average size of farms influences these shares too, as the proportion of livestock holdings with manure storage facilities generally rises as a function of increasing farm size: while one in five (20 %) livestock holdings in the EU-28 with very few livestock (>0 – <5 livestock units (LSU)) had manure storage facilities, more than four out of every five (81 %) holdings with more than 100 livestock units had manure storage facilities (see Table 2).
In Slovakia, Austria and Sweden, a high proportion of holdings of all sizes had manure storage facilities in 2010. On the other hand, in Cyprus and Bulgaria the proportion of livestock holdings with manure storage facilities was relatively low for all farm sizes, a pattern that was reproduced (albeit to a lesser degree) in Greece, Hungary, Portugal and Romania, where less than half of all livestock holdings had manure storage facilities, other than for the very largest farms (>500 livestock units).
Whether holdings with livestock but without manure storage facilities present an environmental risk depends, among others, on the number of livestock, the utilised agricultural area (UAA) for manure application, and the possibility for either selling or spreading any manure that is collected. The lack of manure storage facilities on relatively small farms is not thought to pose a considerable environmental threat: for example, less than one in ten of the livestock holdings in Bulgaria, Greece, Cyprus, Lithuania and Portugal with very few animals (>0 – 5 livestock units LSU) had manure storage facilities. On the other hand, around three quarters of the livestock holdings in Bulgaria and Cyprus with more than 500 livestock units did not have any form of manure storage facilities. This lack of facilities for farms with a relatively high number of animals could potentially lead to increased environmental risks.
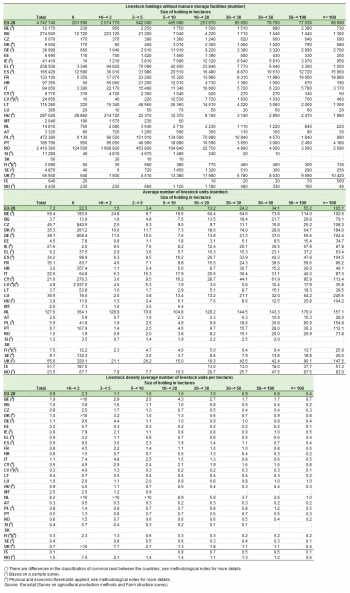
As noted above, other criteria for determining the potential environmental risk associated with the manure from livestock farming include the number of animals and the agricultural area. The relationship between the number of animals and the (potential) agricultural area available for manure spreading/application are combined in an indicator for livestock density (the stock of animals per hectare of utilised agricultural area). More intensive forms of livestock farming, with relatively high livestock density, are more likely to be faced with environmental risks, insofar as they will probably need to either store or export (remove) manure from the farm. As such, agricultural holdings with higher livestock densities might be expected to have a higher propensity for manure storage facilities than those holdings with lower livestock densities. The average livestock density of holdings across the EU-28 with manure storage facilities was, at 1.5 livestock units per hectare of utilised agricultural area in 2010, higher than that for holdings without manure storage facilities (0.9).
Table 3 shows the number of livestock holdings with no manure storage facilities, the average number of livestock units and the livestock density on these holdings. In most of the EU Member States, the average livestock density for all sizes of livestock holding without manure storage facilities was relatively low (<=1 livestock unit per hectare). By contrast, Germany, Italy, Belgium, Malta, Cyprus and the Netherlands each reported livestock densities for holdings with no manure storage facilities above this threshold.
While at first sight these relatively high figures for livestock density in agricultural holdings with no manure storage facilities could be seen as a potential risk to the environment, the Netherlands (as well as, to a somewhat lesser degree, Belgium and Germany) has made considerable efforts (through law) to oblige farmers to adapt their manure management and application techniques — with the aim of minimising emissions and water pollution — for example, through injection or ‘band spreading’ which result in the rapid incorporation of manure into the soil. Furthermore, transport infrastructure systems and pipelines have been developed to remove manure from the farm or redistribute it elsewhere.
Covered manure storage facilities
Covered manure storage facilities prevent, to some degree, ammonia emissions and nutrient leaching or run-off into surface and ground waters. In the EU-28 in 2010, only 14 % of the agricultural holdings with manure storage facilities for solid dung used a covered storage facility, in contrast to 69 % of holdings with manure storage facilities for slurry and 87 % of holdings with manure storage facilities for liquid manure (see Figures 2–4).
In Belgium, Denmark and Slovakia all of the agricultural holdings with manure storage facilities for solid dung used a cover in 2010. By contrast, there were no agricultural holdings in Luxembourg with manure storage facilities for solid dung using a cover.
Belgium, Denmark and Slovakia also reported that all of their agricultural holdings with manure storage facilities for liquid manure used a cover, as did Germany and the Netherlands. By contrast, only about a quarter of the storage facilities for liquid manure in Bulgaria (22 %) and Romania (28 %) used a cover. Note that there were no or very few storage facilities for liquid manure in Cyprus, Luxembourg, Portugal and the United Kingdom.
Almost all (>90 %) of the agricultural holdings with manure storage facilities for slurry used a cover in 2010 in Belgium, Denmark, the Netherlands and Slovakia, as well as Malta and Poland. There were very few storage facilities for slurry in Cyprus, while none of the agricultural holdings with manure storage facilities for slurry used a cover in Romania.
Data sources and availability
Manure management indicators are derived from data collected in the farm structure survey (FSS) and a survey on agricultural production methods (SAPM). The SAPM was carried out together with the FSS census in some of the EU Member States in 2010, while in others it was carried out as a sample survey and data were linked to those from the census at the level of the individual holding to enable cross-comparisons of characteristics collected under the two surveys.
Manure storage is one of 28 agri-environmental indicators established by the European Commission within a Communication titled, ‘Development of agri-environmental indicators for monitoring the integration of environmental concerns into the Common Agricultural Policy’ (COM final 508/2006).
Belgium, Denmark, Germany, Ireland, Greece, Spain, Croatia, Cyprus, Latvia, Hungary, Poland, Slovenia, Finland, Sweden, the United Kingdom, Norway and Switzerland carried out the SAPM as a sample survey; results are extrapolated from the holdings included in the SAPM sample.
Higher thresholds (than the FSS) were used for physical and economic thresholds (five hectares for the UAA, one hectare for permanent crops, 10 head of cattle, 50 head of pigs, 20 head of sheep, 20 head of goats, 1 000 head of poultry; an economic threshold for the standard output (>EUR 4 000) was applied if none of the physical thresholds were met. In Finland a threshold for standard output (>=EUR 1 200) was applied.
When analysing data on livestock units and livestock densities by size of holding (in UAA) there are sometimes considerable differences in the treatment of common land. Livestock density for holdings with livestock by size of UAA will be lower when common land is included in the holding making use of the area than when the area is included in a special holding or in a common land holding.
For more information on the SAPM methodology, refer to: Survey on agricultural production methods.
Context
Through its resource use, agriculture changes rural landscapes and contributes to resource depletion and degradation. Via substance emissions into the wider environment, agriculture may contribute to a complex series of ecological impacts, including human health effects, biodiversity loss and climate change. Policy responses to environmental concerns have included the introduction of: resource use constraints and limits; emission and concentration limits; best available techniques, methods and practices. Nature conservation policies have also been implemented that set various agricultural constraints.
Agri-environmental indicators can be used to analyse, over time, the effects of agriculture on the environment and the interaction between the two, as well as the effectiveness and efficiency of agricultural and environmental policy measures. A Communication from the European Commission to the Council and European Parliament titled, ‘The development of agri-environmental indicators for monitoring the integration of environmental concerns into the Common Agricultural Policy’ (COM(2006) 508) identified 28 agri-environmental indicators (AEIs) to help with this assessment; Eurostat coordinates the work within the EEA on the development of these indicators.
To reduce ammonia and greenhouse gas emissions and nutrient leaching and run-off to ground and surface waters, EU policies address manure storage facilities and the application of manure. The most important policies include the Nitrates Directive (Directive 0676/1991) and the Water Framework Directive 0060/2000, which aim to protect water quality across Europe by preventing nitrates from agricultural sources polluting ground and surface waters. Farmers are also encouraged to adapt their working and management practices: for example, to limit the period of time when fertilisers can be applied to the land (restricting nitrogen availability to periods when crops actually need nutrients, such as at the start of the growing season); or adopting more environmentally friendly procedures for the application of manure (in other words, avoiding the application of manure on steeply sloping ground, frozen or snow covered ground, or near water courses).
See also
- Agri-environmental indicators (online publication)
- Survey on agricultural production methods (background article)
Further Eurostat information
Publications
- Agriculture, forestry and fishery statistics — 2013 edition (Pocketbook)
- Energy, transport and environment indicators — 2012 edition (Pocketbook)
- Environmental statistics and accounts in Europe — 2010 edition
Main tables
- Agriculture (t_agri), see:
- Farm structure: historical data (1990-2007) (t_ef)
Database
- Farm structure (ef), see:
- Farm structure 2010 (ef_2010)
- Survey on agricultural production methods (SAPM, 2010)
- Solid manure application as % of the UAA: number of holdings and UAA by economic size (SO in euros) and agriculture size (UAA) of farm (ef_pmmanapaa)
- Solid manure application as % of the UAA: number of holdings and areas by economic size (SO in euros) and livestock units (LSU) of farm (ef_pmmanaplsu)
- Slurry application as % of the UAA: number of holdings and areas by economic size (SO in euros) and agriculture size (UAA) of farm (ef_pmslurapaa)
- Slurry application as % of the UAA: number of holdings and areas by economic size (SO in euros) and livestock units (LSU) of farm (ef_pmsluraplsu)
- Manure exported from the holding in % of total produced: number of farms and areas by economic size (SO in euros), agriculture size (UAA) of farm and NUTS 2 regions (ef_pmmanexpaa)
- Manure exported from the holding in % of total produced: number of farms and areas by economic size (SO in euros), livestock units (LSU) of farm and NUTS 2 regions (ef_pmmanexplsu)
- Manure storage and treatment facilities: number of farms and areas by economic size (SO in euros), agriculture size (UAA) of farm and NUTS 2 regions (ef_pmmanstoaa)
- Manure storage and treatment facilities: number of farms and areas by economic size (SO in euros), livestock units (LSU) of farm and NUTS 2 regions (ef_pmmanstolsu)
Dedicated section
Methodology / Metadata
- Farm data needed for agri-environmental reporting
- Farm structure (ESMS metadata file — ef_esms)
Source data for tables, figures and maps (MS Excel)
Other information
- Commission Communication COM(2006) 508 - Development of agri-environmental indicators for monitoring the integration of environmental concerns into the common agricultural policy
- Agri-Environmental Indicators, see:
- Legislation: Commission Staff working document accompanying COM(2006)508 final
- Corresponding IRENA Fact sheet:
- Regulation 1166/2008 of 19 November 2008 on farm structure surveys and the survey on agricultural production methods (legal text)
- Regulation 1200/2009 of 30 November 2009 implementing Regulation 1166/2008 on farm structure surveys and the survey on agricultural production methods, as regards livestock unit coefficients and definitions of the characteristics (legal text)