Information on data
Quality of life (QoL) comprises more than just the economic output of a country and living standards of people. It includes a wide range of factors that influence what people value in life, beyond material characteristics.
Factors that can potentially affect quality of life range from job and health status to social relationships, security, and governance.
All these are essential elements to achieve the European Union’s main goal is to ensure the wellbeing of its citizens. To this end, a framework has been set up to complement economic indicators with indicators related to other areas of quality of life.
Measuring quality of life
The Expert Group on QoL indicators recommends in its final report organising a set of QoL indicators for the EU based on the 8+1 dimensions below.
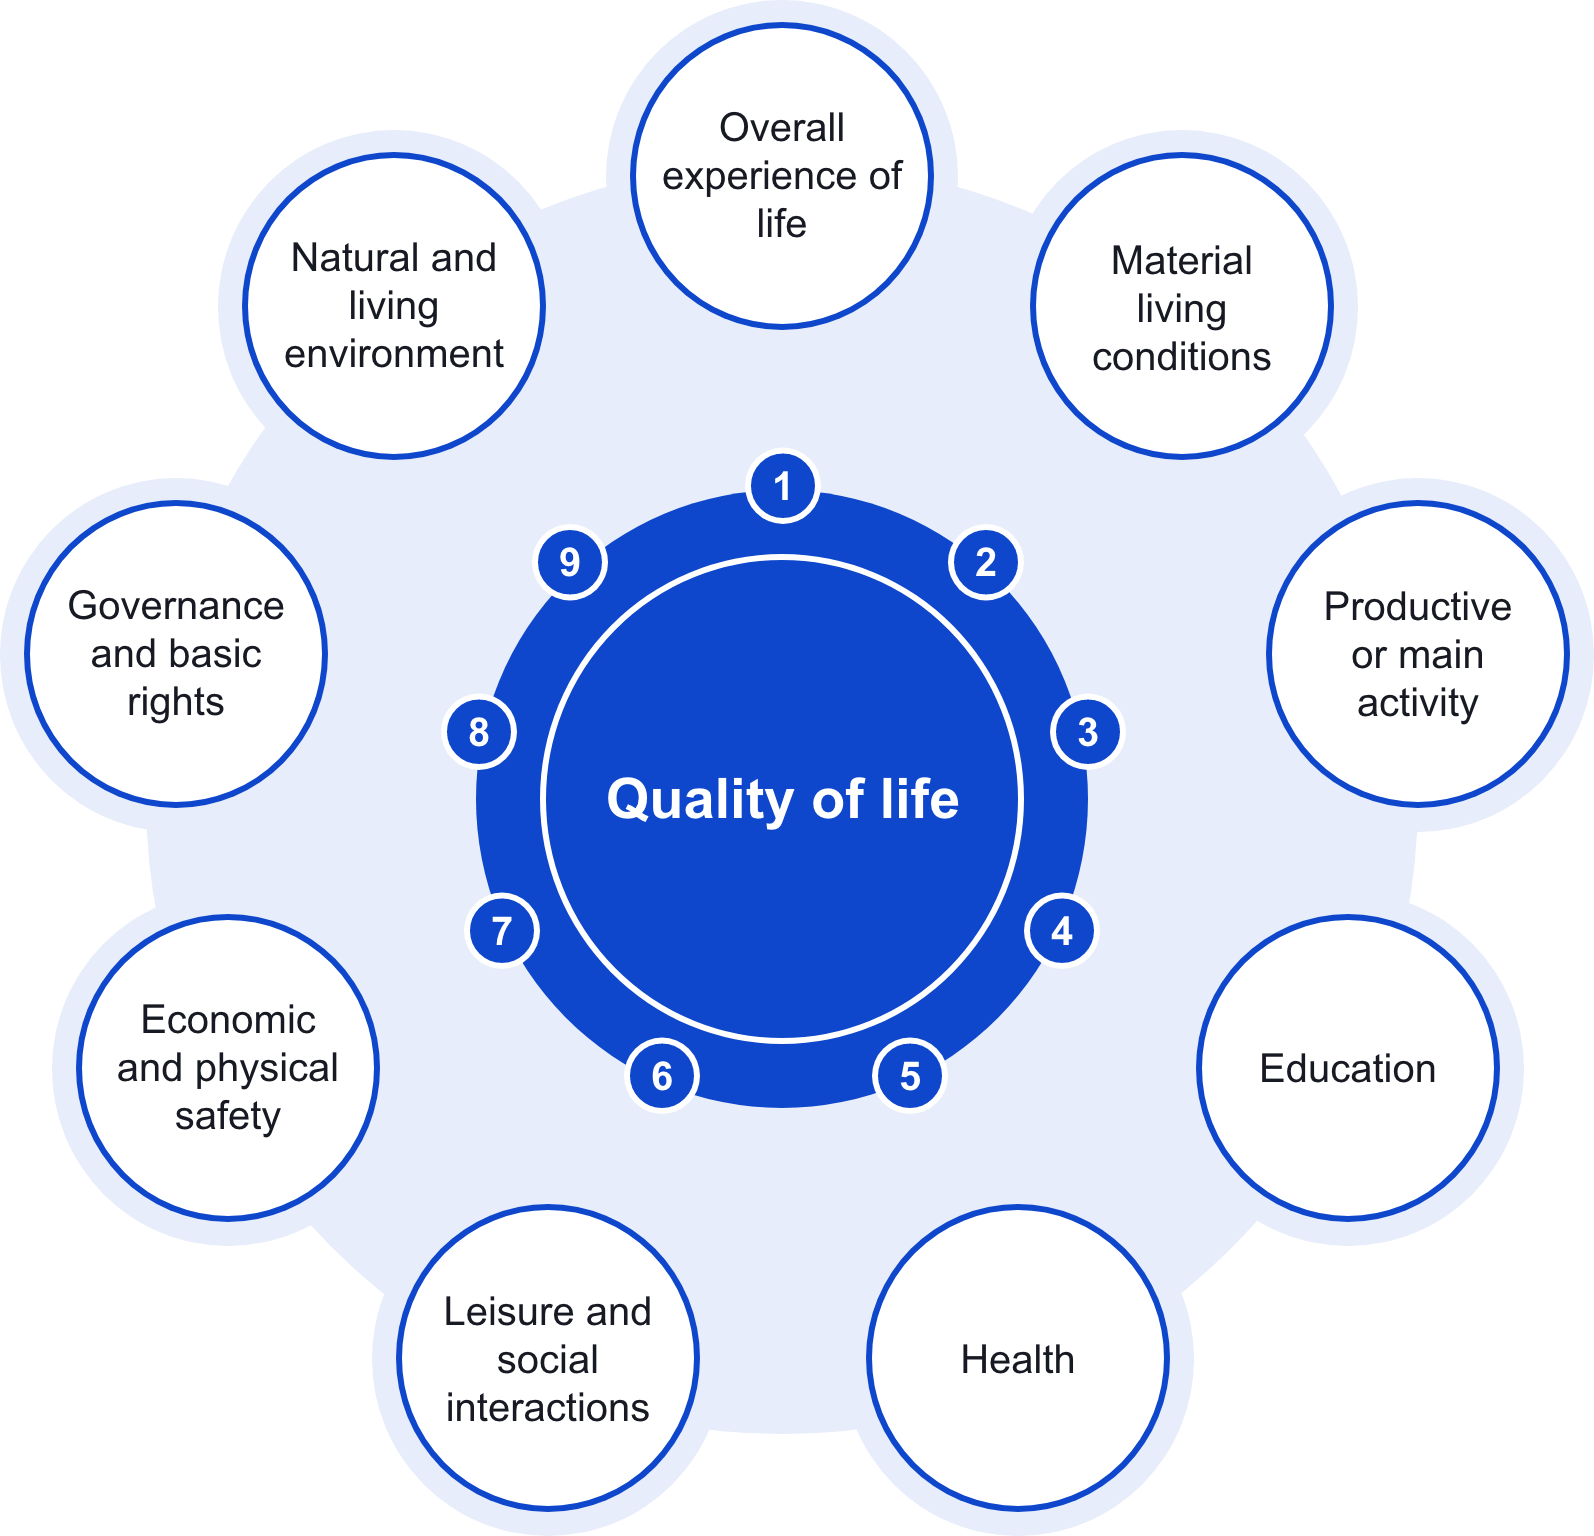
8 of these dimensions relate to people’s capabilities to pursue their self-defined wellbeing according to their own values and priorities. The dimension, ‘overall experience of life’, refers to the personal perception of quality of life, namely life satisfaction, emotions, meaning of life.
Details on the 8+1 dimensions
The 8+1 dimensions are further broken down into topics and subtopics with their related indicators.
| Dimension | Topic | Subtopic |
|---|---|---|
| Material living conditions |
Income |
|
| Consumption | Constrained consumption | |
| Consumption (including non-market consumption and government provided services) | ||
| Material conditions | Material deprivation | |
| Housing conditions | ||
| Productive or other main activity | Quantity of employment | Employment and unemployment |
| Underemployment (quantity) | ||
| Underemployment (quality) | ||
| Quality of employment | Income and benefits from employment | |
| Health and safety at work | ||
| Work/life balance | ||
| Temporary work | ||
| Assessment of the quality of employment | ||
|
Other main activity |
||
| Health | Outcomes | Life expectancy |
| Morbidity and health status | ||
|
Drivers: healthy and unhealthy behaviors |
||
|
Access to healthcare |
||
| Education | Competences and skills | Educational attainment |
| Self-reported skills | ||
| Assessed skills | ||
|
Lifelong learning |
||
|
Opportunities for education |
||
| Leisure and social interactions | Leisure | Quantity of leisure |
| Quality of leisure | ||
| Access to leisure | ||
| Social interactions | Activities with people | |
| Activities for people | ||
| Supportive relationships | ||
| Social cohesion | ||
| Economic and physical safety | Economic security and vulnerability | Wealth (assets) |
| Debt | ||
| Income insecurity (including job) | ||
|
Physical and personal security |
Crime | |
| Perception of physical safety | ||
| Governance and basic rights |
Institutions and public services |
Trust and/or satisfaction in institutions |
| Trust and/or satisfaction in public services | ||
|
Discrimination and equal opportunities |
||
|
Active citizenship |
||
| Natural and living environment |
Pollution (including noise) |
|
|
Access to green and recreational spaces |
||
|
Landscape and built environment |
||
| Overall experience of life |
Life satisfaction |
|
|
Affects |
||
|
Meaning and purpose |
Timeline
- 2021:
- A new framework regulation on producing European statistics on individuals and households, the ‘Integrated European Social Statistics (IESS) regulation’ entered into force in 2021. It has been designed to integrate existing European surveys into a single legal framework, to facilitate standardisation and consistency between sources, in particular of the EU-LFS, EU-SILC and HBS.
- Life satisfaction and trust in others started being collected on a yearly basis. Information on wellbeing and social relations and participation will also be collected on a regular basis, every 6 years for most variables, and every 3 years for others.
- Quarterly data on life satisfaction have been collected on a voluntary basis by eight countries. The results are presented in the online article ‘Living conditions - quarterly statistics’.
- 2018: Eurostat collected another ad-hoc module on subjective wellbeing. The data is available in the database and in a Statistics Explained article on ‘Subjective wellbeing statistics’.
- 2016:
- Eurostat published an analytical report on quality of life. This sought to explain variations in subjective wellbeing using a range of variables included in Eurostat's Quality of Life framework, and has recourse to multivariate regression analysis.
- The ‘Expert Group's final report’, endorsed by the European Statistical System was published. It describes the structure of the framework and the definitions of and rationale for its indicators; it also presents the list of headline indicators. It includes recommendations for future developments in social statistics. It aims to fill the data gaps in quality of life and ensure that the framework established is maintained and updated in line with changing requirements.
- 2015: The results of the EU-SILC ad-hoc module on subjective wellbeing, which was conducted in 2013, were released.
- 2014/2015: A first set of QoL indicators, building mainly on existing data in the ESS, were published. It has been complemented by a series of Statistics Explained articles on Quality of life indicators, which are regularly updated.
- 2012: An expert group representing producers, users and other stakeholders was set up. It started by taking stock of existing data and prioritising data from existing surveys and administrative data within the ESS. It developed the first set of indicators based on these data.
- 2008: The Stiglitz/Sen/Fitoussi Commission report recommended developing QoL indicators covering multidimensional measures of conditions that contribute to people´s life satisfaction.
EU-SILC will be developed further to serve as the core EU instrument linking the quality of life at an individual level and reflecting their interdependencies.