Urban-rural Europe - economy
Data extracted: October 2022.
Planned article update: December 2024.
Highlights
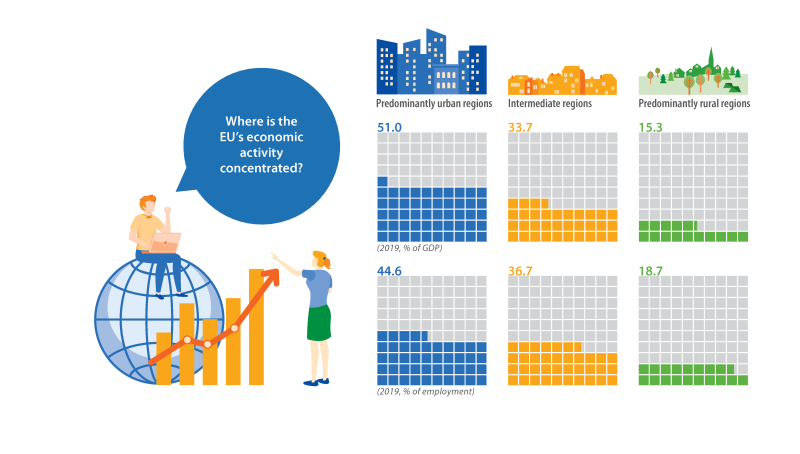
A majority (51.0 %) of the EU’s GDP in 2019 was concentrated in predominantly urban regions.
In 2019, more than one fifth of total value added in the predominantly rural regions of Ileia, Pella (both Greece) and Bjelovarsko-bilogorska županija (Croatia) was accounted for by agriculture, forestry and fishing.
The main focus of the European Union’s (EU’s) cohesion policy is to help regions converge/catch-up. Many of the less-developed and transition regions in the EU are characterised as having relatively low-growth, low-income (primarily in eastern and southern EU Member States) or pockets of poverty, social exclusion and/or industrial decline (regions that have been ‘left-behind’); these regions receive the bulk of the EU’s regional funds.
At the onset of the COVID-19 crisis, the European Commission activated the general escape clause of the Stability and Growth Pact. By relaxing budgetary rules/requirements, national governments had more freedom to support their economies and mitigate the pandemic’s socioeconomic consequences.
This article forms part of Eurostat’s sister publications on Rural Europe and Urban Europe.
Full article
Gross domestic product (GDP)
As the central measure of national accounts, gross domestic product (GDP) summarises the economic position of a country or a region. GDP at market prices in the EU was valued at €14.0 trillion in 2019, equivalent to an average of €31 300 per inhabitant. A majority (51.0 %) of the EU’s GDP was concentrated in predominantly urban regions, while intermediate regions accounted for approximately one third (33.7 %) and the smallest share (15.3 %) was generated in predominantly rural regions. Note these figures cover the period prior to the COVID-19 crisis when there was a considerable reduction in economic activity.
Figure 1 shows the development of GDP in the EU between 2008 and 2019 based on the urban–rural typology; note the time series exclude information for Belgium (incomplete data) and are based on data in current prices (and are therefore influenced by the effects of price inflation). The global financial and economic crisis led to a considerable fall in economic activity in 2009 across the EU, with a somewhat larger contraction in economic activity for intermediate and predominantly rural regions. Thereafter, economic activity rose every year: growth was relatively strong between 2009 and 2011; growth slowed considerably in 2012; thereafter growth accelerated most years. By 2019, GDP in predominantly rural regions was some 28.2 % higher (in current price terms) than in 2008 , while overall growth was slightly less pronounced in predominantly urban regions (up 26.8 %) and intermediate regions (up 24.5 %).
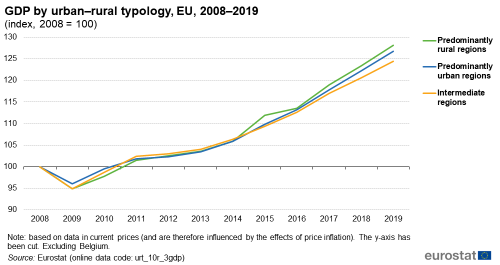
(index, 2008 = 100)
Source: Eurostat (urt_10r_3gdp)
As noted above, a majority (51.0 %) of the EU’s GDP in 2019 was concentrated in predominantly urban regions. These regions are often viewed as being the motors of the EU economy, providing hubs for wealth creation and attracting large numbers of people as a result of the wide range of opportunities they offer in economic, educational or social/cultural spheres.
In 2019, there were 10 EU Member States where more than half of all economic activity took place in predominantly urban regions; an additional six Member States reported their highest share of GDP was derived in predominantly urban regions. Leaving aside the special case of Malta [1], the highest concentrations of GDP within predominantly urban regions were recorded in the Netherlands (78.7 %), Estonia (71.0 %) and Spain (66.9 %).
By contrast, intermediate regions accounted for the highest share of GDP in nine EU Member States in 2019. Leaving aside Cyprus and Luxembourg, the highest concentrations of GDP within intermediate regions were in Lithuania (52.8 %), Slovenia (51.5 %) and Hungary (50.7 %). There were just two Member States where predominantly rural regions accounted for the highest share of GDP: Ireland (50.6 %) and Romania (37.5 %).
Figure 2: GDP by urban–rural typology, 2019
(% share of total GDP)
Source: Eurostat
(urt_10r_3gdp)
GDP per inhabitant is often used as a proxy measure for analysing overall living standards. Note that it does not take account of externalities such as environmental sustainability or issues such as income distribution or social exclusion, which are increasingly seen as important drivers for sustainable development and the overall quality of life.
In order to compensate for price level differences across countries, GDP can be converted using conversion factors known as purchasing power parities (PPPs). The use of PPPs, rather than market exchange rates, results in data being denominated in an artificial common currency unit called a purchasing power standard (PPS). The use of PPS series, rather than euro-based series, tends to have a levelling effect, as countries with very high GDP per inhabitant in euro terms also tend to have relatively high price levels (for example, the cost of living in Luxembourg is much higher than the cost of living in Bulgaria).
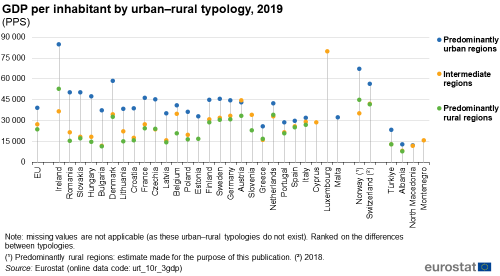
In 2019, GDP per inhabitant in the EU was 39 000 PPS in predominantly urban regions, which was considerably higher than the corresponding ratios for intermediate regions (27 400 PPS) or predominantly rural regions (23 600 PPS). Based on this measure, economic activity in predominantly urban regions may, at least in some cases be influenced/overstated. This is especially the case if a relatively high proportion of a region’s labour is composed of commuters from surrounding regions (net commuter inflows tend to increase GDP per inhabitant in regions where commuters are employed and decrease it in those regions where they are resident). An example, which provides information on cross-border commuters working in Luxembourg, is presented in an article on demographic developments in cities.
Within the EU Member States, the highest levels of GDP per inhabitant were usually recorded by predominantly urban regions. The only exception was Austria, where GDP per inhabitant in 2019 was higher for intermediate regions (44 500 PPS) than it was for predominantly urban regions (43 000 PPS); see Figure 3.
In 2019, GDP per inhabitant in the EU’s predominantly urban regions was 1.7 times as high as in predominantly rural regions. Across the EU Member States:
- in Bulgaria, Romania and Hungary, GDP per inhabitant for predominantly urban regions was more than three times as high as for predominantly rural regions;
- at the other end of the range, GDP per inhabitant for predominantly urban regions was less than 1.5 times as high as for predominantly rural regions in Germany, Portugal, Austria, the Netherlands, Spain and Italy.
Map 1 is based on regional GDP per inhabitant (adjusted for purchasing power and expressed as a percentage of the EU average). Between 2008 and 2019 there were 410 NUTS level 3 regions (out of a total of 1 166) where GDP per inhabitant in relation to the EU average rose at a relatively fast pace (up at least 5.0 percentage points; as shown by the darkest shades in the map), 319 regions where it remained relatively stable, and 437 where it fell at a relatively fast pace in relation to the EU average (down more than 5.0 points; as shown by the lightest shades in the map).
A more detailed analysis based on the urban–rural typology reveals that a majority of the predominantly rural regions in the EU reported an increase in GDP per inhabitant (relative to the EU average); this ratio increased in 224 regions, while it fell in 174. The situation was more balanced for intermediate regions, as there were 247 regions where GDP per inhabitant rose and 249 where it fell. GDP per inhabitant fell in approximately two thirds (155 regions) of the predominantly urban regions of the EU, while it rose in 75. Note however that many of the EU’s major cities – including 15 capital cities – were among the 75 predominantly urban regions where GDP per inhabitant increased.
Between 2008 and 2019, the most rapid increase in GDP per inhabitant (relative to the EU average):
- among predominantly urban regions was recorded in Miasto Wrocław (Poland);
- among intermediate regions was recorded in Ingolstadt, Kreisfreie Stadt (Germany);
- among predominantly rural regions was recorded in South-West (Ireland).
At the other end of the scale, the most rapid fall in GDP per inhabitant (relative to the EU average):
- among predominantly urban regions was recorded in Dytiki Attiki (Greece);
- among intermediate regions was recorded in Chios (Greece);
- among predominantly rural regions was recorded in Ikaria, Samos (Greece).
Map 1: Overall change in GDP per inhabitant by urban–rural typology, 2008–2019
(percentage points, based on index with EU = 100)
Note: Greece, Romania and Albania, break in series.
Source: Eurostat
(nama_10r_3gdp)
Gross value added
When calculated from the output side, the main component of GDP is gross value added. This is defined as output (at basic prices) minus intermediate consumption (at purchaser prices) and is the balancing item of the national accounts’ production account. Value added can be analysed according to the statistical classification of economic activities (NACE).
Figure 4 shows the structure of gross value added in the EU for the three categories of the urban–rural typology. Market services (defined here as NACE Sections G–N) accounted for the highest share of value added for all three categories within the urban–rural typology. The share of market services was particularly pronounced in predominantly urban regions, where it accounted for 58.1 % of total value added in 2019. Unsurprisingly, agriculture, forestry and fishing (NACE Section A) had a relatively high share of total value added in predominantly rural regions (4.2 % in 2019). It is interesting to note that, apart from agriculture, forestry and fishing, a relatively high share of economic activity in predominantly rural regions was accounted for by industry (27.0 %) and by construction (6.7 %).
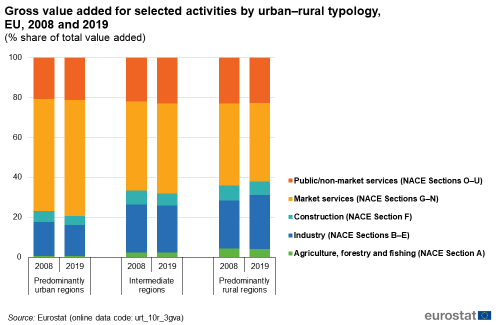
(% share of total value added)
Source: Eurostat (urt_10r_3gva)
In 2019, market services accounted for more than three quarters of regional economic activity in the predominantly urban regions of Hauts-de-Seine (the western suburbs of the French capital), Arr. Halle-Vilvoorde (the northern suburbs of the Belgian capital) and Groot-Amsterdam (the greater region of the Dutch capital); these were the highest shares recorded for any NUTS level 3 regions. By contrast, more than one fifth of total value added in the predominantly rural regions of Ileia, Pella (both Greece) and Bjelovarsko-bilogorska županija (Croatia) was accounted for by agriculture, forestry and fishing.

(% share of regional value added)
Source: Eurostat (nama_10r_3gva)
Figure 6: Gross value added by economic activity and by urban–rural typology, 2019
(%)
Note: within the urban–rural typology, there are no predominantly urban regions for Cyprus, Luxembourg, Slovenia and Montenegro; there are no intermediate regions for Estonia and Malta; there are no predominantly rural regions for Cyprus, Luxembourg, Malta, Montenegro and North Macedonia. Agriculture, forestry and fishing (NACE Section A); Industry (NACE Sections B–E); Construction (NACE Section F); Market services (NACE Sections G–N); Public/non-market services (NACE Sections O–U).
Source: Eurostat
(urt_10r_3gva)
Figure 6 shows the relative contribution made by five aggregated economic activities to total value added in 2019; the information is presented according to the urban–rural typology (use the dropdown list to change the category).
- In predominantly urban regions, market services accounted for more than half of total value added in each of the EU Member States; non-market services had the second highest share in 21 out of 24 Member States, the exceptions being Czechia, Poland and Estonia (where industry recorded the second highest share).
- In Luxembourg, Cyprus and Slovenia, market services accounted for more than half of total value added in intermediate regions; market services had the highest share (although less than 50 %) of total value added in the remaining 22 Member States. Industry had the second highest share of total value added in 14 Member States, while non-market services had the second highest share in the remaining 11 Member States.
- More than half (55.2 %) of the total value added generated in predominantly rural regions of Ireland was accounted for by industry. Ireland hosts a number of the world’s top technology and pharmaceutical companies with a strong presence of multinational enterprises. Their high levels of value added may be atypically high, for example if capital assets (such as technology patents) are domiciled in a region. In Ireland, Bulgaria and Czechia, the highest share of total value added was generated by industry, while market services had the highest share in the remaining 21 Member States.
Employment
National accounts employment estimates measure the overall level of employment in an economy as well as providing an analysis by economic activity. In 2019, there were 209.4 million persons employed in the EU. The highest numbers were employed in predominantly urban regions (93.4 million; 44.6 % of the total), followed by intermediate regions (76.8 million; 36.7 %) and predominantly rural regions (39.1 million; 18.7 %).
While predominantly urban regions accounted for more than half (51.0 %) of the EU’s GDP in 2019 (see Figure 2), their share of employment was lower (44.6 %), suggesting they had higher than average apparent labour productivity. By contrast, intermediate regions and predominantly rural regions had higher shares of employment (than their shares of GDP) and consequently had below average apparent labour productivity.
Figure 7: Employment by urban–rural typology, 2019
(% share of total employment)
Note: within the urban–rural typology, there are no predominantly urban regions for Cyprus, Luxembourg and Slovenia; there are no intermediate regions for Estonia and Malta; there are no predominantly rural regions for Cyprus, Luxembourg, Malta and North Macedonia.
Source: Eurostat
(urt_10r_3emp)
(% share of regional employment)
Source: Eurostat (nama_10r_3empers)
There was a mixed pattern among the EU Member States in terms of how employment was distributed based on the urban–rural typology. Focusing on the 22 Member States for which there are data covering all three categories in the urban–rural typology, the following key points can be noted.
- There were nine Member States where predominantly urban regions recorded the highest share of persons employed in 2021. In three of these – Belgium, Spain and the Netherlands – more than half of the workforce was employed in a predominantly urban region, with this share peaking at 75.5 % in the Netherlands.
- There were eight Member States where intermediate regions recorded the highest share of persons employed in 2021. In four of these – Czechia, Hungary, Lithuania and Bulgaria – more than half of the workforce was employed in an intermediate region, with this share peaking at 61.4 % in Bulgaria.
- There were five Member States where predominantly rural regions recorded the highest share of persons employed in 2021. In two of these – Romania and Ireland – more than half of the workforce was employed in a predominantly rural region, with this share peaking at 53.2 % in Ireland.
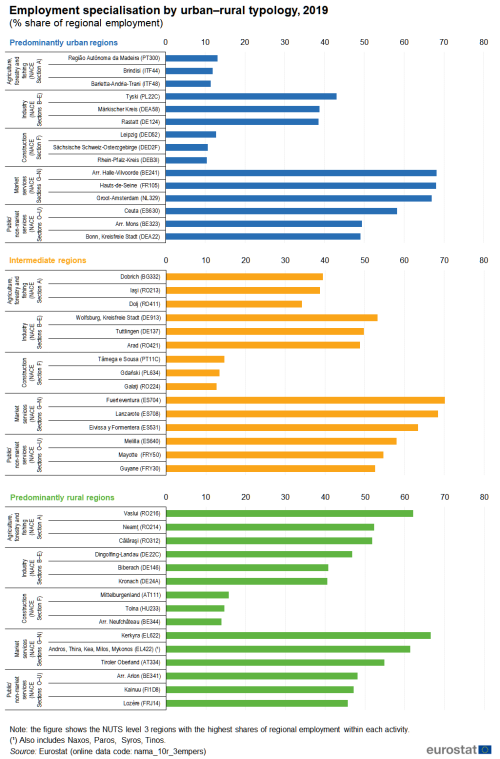
Figure 8 presents information on employment specialisations based on the urban–rural typology. In 2019, more than half of all employed persons in the predominantly rural regions of Călăraşi and Neamţ (both Romania) were working in agriculture, forestry and fishing, with this share peaking in another Romanian region, Vaslui (62.1 %).
Industry accounted for close to half of all persons employed in the intermediate regions of Wolfsburg, Kreisfreie Stadt and Tuttlingen (both in Germany); the former is the location of one of the world’s largest car manufacturing sites, while the latter has a concentration of medical technology enterprises specialised in the manufacture of surgical equipment. By contrast, in the Spanish intermediate regions of Fuerteventura and Lanzarote (both part of Canarias), approximately 7 out of 10 employed persons were working in market services (principally linked to the tourism industry).
Market services accounted for more than two thirds of regional employment in the predominantly urban regions of Arr. Halle-Vilvoorde (Belgium), Hauts-de-Seine (France) and Groot-Amsterdam (the Netherlands), mirroring their high shares of value added.
Figure 9: Annual change in employment by urban–rural typology, 2018–2019
(%)
Note: within the urban–rural typology, there are no predominantly urban regions for Cyprus, Luxembourg and Slovenia; there are no intermediate regions for Estonia and Malta; there are no predominantly rural regions for Cyprus, Luxembourg, Malta and North Macedonia.
Source: Eurostat
(urt_10r_3emp)
It is also interesting to note that non-market services tended to account for a relatively high share of employment in outermost regions, for example, Ceuta in Spain (among predominantly urban regions) or Mayotte in France (among intermediate regions). However, there was also a relatively high share of employment in non-market services in the predominantly urban region of Bonn, Kreisfreie Stadt (which used to be the capital city of Germany until 1990), as the federal government has maintained a substantial number of administrative jobs in the city.
Between 2018 and 2019, the number of employed persons in predominantly urban regions rose by 1.7 % across the EU, which was higher than the rates recorded for either intermediate regions (up 0.9 %) or predominantly rural regions (up 0.1 %); see Figure 9.
Across the 22 EU Member States which have data for all three categories of the urban–rural typology:
- there were 15 that reported their fastest growth in employment for predominantly urban regions, with annual growth rates of more than 3.0 % in Ireland, Spain and Finland;
- there were five where intermediate regions recorded the fastest employment growth, peaking at 1.7 % in Belgium;
- there were two where predominantly rural regions recorded the highest employment growth, peaking at 4.0 % in Croatia.
In 2019, some 152.7 million persons were employed in various service activities across the EU; this was equivalent to almost three quarters (72.9 %) of the total workforce. The highest concentration of services employment was recorded in predominantly urban regions, where services provided work to more than four out of every five employed persons (81.4 %). Lower shares were recorded in intermediate regions (68.9 % of the workforce were employed in services) and predominantly rural regions (60.8 %). By contrast, in predominantly rural regions a relatively high proportion of the workforce were employed in industry (20.0 %) and in agriculture, forestry and fishing (11.6 %).

(% share of total employment)
Source: Eurostat (urt_10r_3emp)
Figure 11: Employment by economic activity and by urban–rural typology, 2019
(%)
Note: within the urban–rural typology, there are no predominantly urban regions for Cyprus, Luxembourg and Slovenia; there are no intermediate regions for Estonia and Malta; there are no predominantly rural regions for Cyprus, Luxembourg, Malta and North Macedonia. Agriculture, forestry and fishing (NACE Section A); Industry (NACE Sections B–E); Construction (NACE Section F); Market services (NACE Sections G–N); Public/non-market services (NACE Sections O–U).
Source: Eurostat
(urt_10r_3emp)
Figure 11 shows the relative contribution made by five aggregated economic activities to total employment in 2019; the information is presented according to the urban–rural typology (use the dropdown list to change the category).
- In predominantly urban regions, market and non-market services accounted for more than four out of five employed persons in a majority of EU Member States, with their share peaking at 90.4 % in Denmark; at the lower end of the range, these services accounted for less than three quarters of employment in Czechia, Estonia and Poland.
- In intermediate regions, market services provided work to the largest share of employed persons in all but one of the EU Member States (the exception being Sweden, where non-market services employed a higher share). Non-market services were generally the second largest employer, although in six eastern Member States – Czechia, Slovakia, Hungary, Poland, Romania and Bulgaria – and in Portugal, a larger proportion of the workforce was employed in industry.
- In predominantly rural regions, the share of persons employed within agriculture, forestry and fishing varied considerably between EU Member States. Shares of less than 4.0 % were recorded in the Netherlands, Slovakia, Belgium and Germany (which had the lowest share, at 3.0 %), while double-digit shares were registered in 10 Member States, reaching 22.5 % in Greece, 30.7 % in Bulgaria and 32.2 % in Romania.
Source data for tables and graphs
Context
With the arrival of a new European Commission, six priorities were identified for the period 2019–2024, including three with a direct impact on the economy: A European Green Deal, A Europe fit for the digital age and An economy that works for people.
The COVID-19 crisis severely disrupted the output of goods and services as well as international trade. Lockdowns closed many plants, and disturbances to trading routes still exist today with very high shipping costs. There were also difficulties concerning the supply of strategic items used in industrial supply chains such as the manufacture of motor vehicles and electronics. As the impact of the pandemic dissipates, the attention of policymakers and economists has turned or returned to a number of longer-term, structural challenges: public finances, population ageing, climate change, security of energy supply, sustainable development, weak productivity growth, rising income and wealth inequality, or territorial disparities within and among EU Member States.
In December 2020, a multiannual financial framework covering the period 2021–2027 was adopted. This provides a budget aimed at kick-starting the EU economy. The plan was reinforced by an emergency European Recovery Instrument (also known as Next Generation EU) to facilitate decisive responses to the most urgent challenges, such as the COVID-19 crisis.
The EU’s regional and cohesion policy supports a broad range of socioeconomic priorities by focusing on five investment priorities. The introduction of this online publication provides more information about cohesion policy.
Notes
Direct access to
Online publications
Methodological publications
- Building the system of national accounts
- Methodological manual on territorial typologies – 2018 edition
Background articles
Statistical publications
- Urban Europe – statistics on cities, towns and suburbs – 2016 edition
Methodological publications
Statistical legislation
- National accounts – legislation
- Regulation (EU) 2017/2391 of the European Parliament and of the Council of 12 December 2017 amending Regulation (EC) No 1059/2003 as regards the territorial typologies (Tercet)
- Consolidated and amended version of Regulation (EC) No 1059/2003 of the European Parliament and of the Council on the establishment of a common classification of territorial units for statistics (NUTS)
Policy legislation
- Commission Delegated Regulation (EU) No 522/2014 of 11 March 2014 supplementing Regulation (EU) No 1301/2013 of the European Parliament and of the Council with regard to the detailed rules concerning the principles for the selection and management of innovative actions in the area of sustainable urban development to be supported by the European Regional Development Fund
- Regulation (EU) No 1305/2013 of the European Parliament and of the Council of 17 December 2013 on support for rural development by the European Agricultural Fund for Rural Development (EAFRD)
- Regulation (EU) No 1310/2013 of the European Parliament and of the Council of 17 December 2013 laying down certain transitional provisions on support for rural development by the European Agricultural Fund for Rural Development (EAFRD)
Visualisations
European Commission – Directorate-General Agriculture and rural development
European Commission – Directorate-General Regional and Urban Policy
- Cities and urban development
- Cohesion in Europe towards 2050; eighth report on economic, social and territorial cohesion
- Territorial cohesion
- Urban–rural linkages
European Committee of the Regions
European networks
United Nations
