Urban-rural Europe - economic activity in capital cities and metropolitan regions
Data extracted: October 2022.
Planned article update: December 2024.
Highlights
As of 1 January 2021, there were 72.7 million people living in the EU’s 27 capital city metropolitan regions; this represented 16.3 % of the total number of inhabitants residing within the EU.
GDP per inhabitant in the capital city metropolitan regions of Bucureşti and Sofia was more than three times as high as it was for the non-metropolitan regions of Romania and Bulgaria.
Capital cities play a crucial role in the economic development of the European Union (EU). Aside from their economic importance, the cultural identity of well-known capitals such as Praha (Czechia), Berlin (Germany), Paris (France) or Roma (Italy) helps to shape opinions of the EU across the globe.
Capital cities in the EU are hubs for competitiveness and employment. They are often seen as drivers of innovation and growth, as well as centres for education, science, social, cultural and ethnic diversity, providing a range of services and cultural attractions to their surrounding areas. Nevertheless, capital cities in the EU also provide examples of the ‘urban paradox’, insofar as they may be characterised by a range of social, economic and environmental inequalities; as such, they are at the heart of efforts to ensure more sustainable and inclusive growth within the EU.
This article examines the relationship between capital cities and the national economies to which they belong. It shows that some capital cities may exert a form of ‘capital magnetism’, through a monocentric pattern of urban development that results in investment/resources being concentrated in the capital. Whether such disparities have a positive or negative effect on the national economy is open to debate, as large capital cities that dominate their national economies may create high levels of income and wealth that radiate to surrounding areas/regions. By contrast, other capital cities are part of a more polycentric pattern of urban development, whereby economic activity and employment is more evenly balanced between the capital and other major cities.
This article forms part of Eurostat’s online publication Urban Europe. Note that an article on demographic developments in cities provides complementary information (including a focus on population developments in EU capital cities).
Full article
Capital cities
As of 1 January 2021, there were 72.7 million people living in the EU’s 27 capital city metropolitan regions; this figure represented 16.3 % of the total number of inhabitants residing within the EU. The relative importance of these regions was greater in terms of their contribution to employment (17.5 % of the EU total in 2021); note however that capital cities also provide work to commuters whose residence may be outside their territorial boundaries. Capital city metropolitan regions made their largest contribution to the EU economy in terms of wealth creation: their combined gross domestic product (GDP) was €3.1 trillion in 2019, which equated to 22.6 % of the EU total.
(% share of national total)
Source: Eurostat (met_pjanaggr3), (met_lfe3emp), (met_10r_3gdp), (demo_pjan), (lfsa_egan) and (nama_10_gdp)
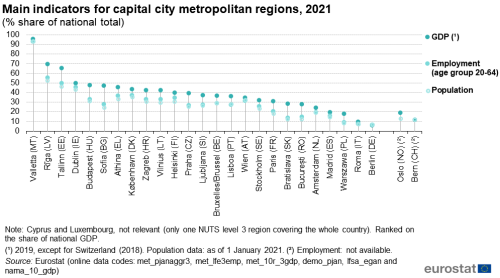
Figure 1 shows the relative importance of capital city metropolitan regions within their respective national economies. Excluding Cyprus and Luxembourg (which are relatively small EU Member States composed of only one NUTS level 3 region), the contribution of capital cities to national GDP in 2019 ranged from 5.9 % in Berlin (Germany) and less than 10.0 % in Roma (Italy) up to more than 60.0 % in Tallinn (Estonia) and Rīga (Latvia) and 95.6 % in Valletta (Malta; where a relatively small share of economic activity took place outside of the main island on Gozo and Comino).
- Berlin (Germany) was the only capital to record a share of national GDP that was lower than its share of national employment.
- Bratislava (Slovakia) was the only capital to record a share of national GDP that was more than twice as high as its share of national employment.
GDP – territorial and residential approaches:
GDP is calculated on the basis of where people work (a territorial approach, rather than a residential approach). Cities that are characterised by high net commuter inflows are likely to witness a level of economic output beyond that which could be produced by their active resident population, and GDP per inhabitant will therefore be relatively high.
Furthermore, cities with apparently high levels of GDP per inhabitant do not necessarily have correspondingly high levels of income, as some of their income will be received by commuters (living in other regions). GDP per inhabitant is an average for a particular territorial entity and does not provide any information on the distribution of wealth among those living in each territory.
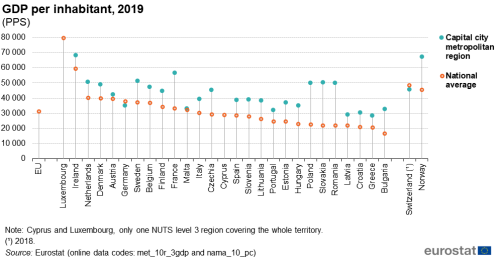
GDP per inhabitant is an alternative indicator for measuring the relative position of capital cities within their national economies; the statistics presented in Figure 2 are expressed in purchasing power standards (PPS) to reflect price level differences between EU Member States.
In 2019, GDP per inhabitant in the EU was 31 300 PPS.
- There were four capital city metropolitan regions that had ratios below the EU average: Zagreb (Croatia; 30 400 PPS), Rīga (Latvia; 28 900 PPS), Cyprus (28 800 PPS; a single region within this typology) and Athina (Greece; 28 200 PPS).
- The highest levels of GDP per inhabitant in PPS were recorded in Luxembourg (79 600 PPS), Dublin (Ireland; 68 200 PPS) and Paris (France; 56 700 PPS), with the capitals of Sweden, the Netherlands, Slovakia, Romania and Poland also recording ratios of at least 50 000 PPS.
- Bucureşti (Romania), Bratislava and Warszawa (Poland) were the only capital city metropolitan regions to report GDP per inhabitant in PPS that was more than twice as high as their respective national averages.
- Berlin (Germany) was the only capital city metropolitan regions to report GDP per inhabitant in PPS that was below the national average.
With growing numbers of relatively young people moving to live in and around some of the EU’s main cities, economic growth has become increasingly dependent on the productivity of the urban workforce. Figure 3 shows GDP per inhabitant for capital city metropolitan regions in 2019 expressed as an index relative to the GDP per inhabitant of non-metropolitan regions (with a base value of 100); these ratios are based on data in PPS.
- GDP per inhabitant was consistently higher in capital city metropolitan regions than it was for non-metropolitan regions – this pattern was repeated in all of the EU Member States.
- GDP per inhabitant in the capital city metropolitan regions of Bucureşti and Sofia was more than three times as high as it was for the non-metropolitan regions of Romania and Bulgaria, respectively; it was also relatively high in Warszawa and Bratislava (Slovakia).
- GDP per inhabitant in Paris was 2.4 times as high as in non-metropolitan regions of France; this ratio was considerably higher than in the other large EU Member States – Madrid and Roma had GDP per inhabitant that was 1.5 times as high as in the non-metropolitan regions of Spain and Italy, while GDP per inhabitant in Berlin was 1.1 times as high.

(index, GDP per inhabitant for non-metropolitan regions = 100, based on data in PPS)
Source: Eurostat (met_10r_3gdp)
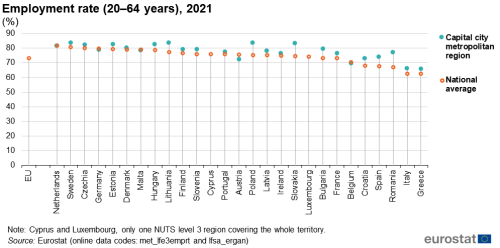
In 2021, the EU’s employment rate for working-age people (defined here as those aged 20–64 years) was 73.1 %. National averages across the EU Member States ranged from lows of 62.6 % and 62.7 % in Greece and Italy, respectively, up to at least 80.0 % in Czechia, Sweden and the Netherlands (where a peak of 81.7 % was recorded).
Figure 4 contrasts employment rates in capital city metropolitan regions with national averages; note that Cyprus and Luxembourg have a single NUTS level 3 region covering their territory (as such no distinction is made between their capital city region and their national average). In 2021, employment rates for working-age people were generally higher than average in capital cities:
- the highest employment rates across capital cities in the EU were observed in Stockholm (83.8 %), Warszawa (83.7 %), Vilnius (83.6 %) and Bratislava (83.4 %), while the lowest rates were recorded in Bruxelles/Brussel (69.9 %), Roma (66.0 %) and Athina (65.7 %);
- Austria, Belgium, Germany, Malta and the Netherlands were the only EU Member States to record employment rates in their capitals that were lower than the national average;
- by contrast, employment rates in the capitals of Lithuania, Spain, Bulgaria, Poland, Slovakia and Romania were more than 6.0 percentage points above the national average.
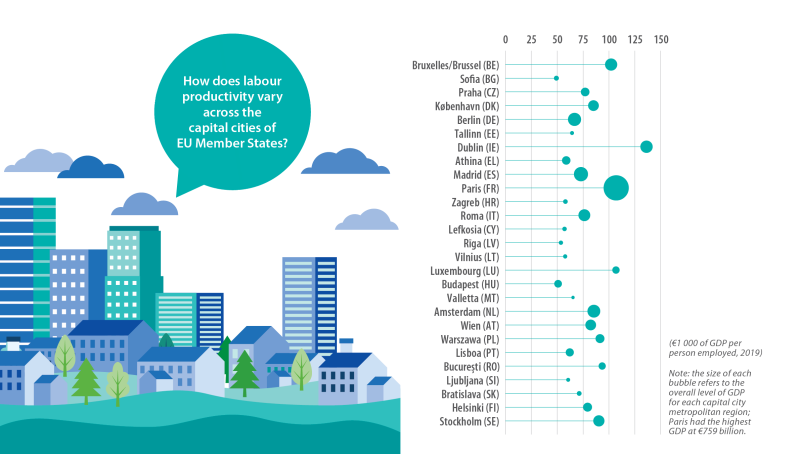
The ratio of GDP per person employed can be used to measure labour productivity or more generally competitiveness. It has an advantage (over GDP per inhabitant) insofar as the number of persons employed is also influenced by commuter flows, as commuters are included in the number of persons employed that contribute to GDP.
A comparison with other metropolitan regions reveals that capital cities were among the most productive metropolitan regions of the EU, with relatively high levels of GDP per person employed; this may, at least in part, reflect certain economic functions and headquarters of large companies often being clustered in these regions. In 2019, there were 16 out of 22 EU Member States (for which data are available) where the capital city metropolitan region had the highest level of GDP per person employed; see Figure 5. In Bratislava (Slovakia) and Bucureşti (Romania), GDP per person employed was 53 % and 51 % higher than in any other metropolitan region (in the same Member States). A similar pattern was observed for the capitals of Bulgaria, Greece, Czechia and Poland, as GDP per person employed was 41–46 % higher than in any other metropolitan region.
Despite registering the highest level of GDP per person employed among the capital city metropolitan regions of the EU in 2019, the Irish capital of Dublin (136 200 PPS) had a much lower level of GDP per person employed than Cork (211 000 PPS) [1]. There were five additional EU Member States where GDP per person employed for the capital city metropolitan region was surpassed by that of at least one other metropolitan region:
- Braunschweig-Salzgitter-Wolfsburg – which includes the headquarters of Volkswagen – recorded the highest level of GDP per person employed (101 700 PPS) in German metropolitan regions, some 1.5 times as high as in Berlin;
- the northern region of Milano (87 800 PPS) recorded the highest level of GDP per person employed in Italian metropolitan regions, some 1.2 times as high as in Roma;
- Vitoria/Gasteiz (Spain), Salzburg (Austria) and Kaunus (Lithuania) also recorded GDP per person employed that was higher than in their respective capitals, although the differences were relatively small.
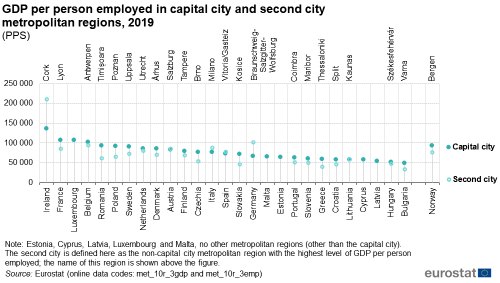
(PPS)
Source: Eurostat (met_10r_3gdp) and (met_10r_3emp)
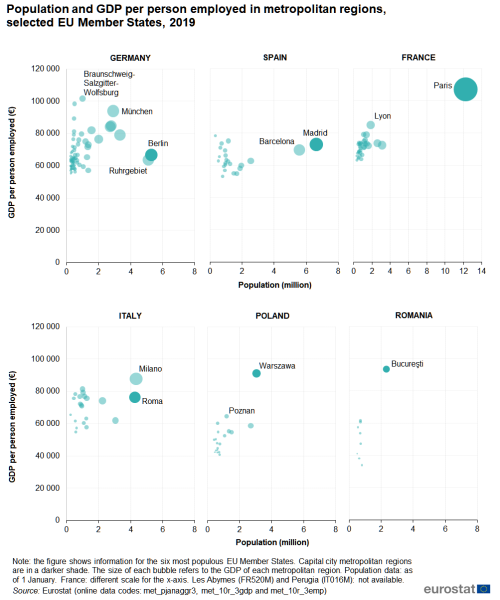
Figure 6 concludes this section, providing a more detailed analysis for metropolitan regions of the largest EU Member States. The charts explore the relationship between GDP per person employed in 2019 and the total number of inhabitants living in each metropolitan region as of 1 January 2019; note that the size of the bubbles reflects the overall level of GDP for each region.
Looking in more detail, Paris appears a distinct outlier, as this megacity plays a prominent role in the French economy, accounting for a high share of the national population and GDP, while also recording the highest level of GDP per person employed. The Polish and Romanian capitals of Warszawa and Bucureşti had the largest shares of their national populations (although their size was far more in keeping with other regions), while they also recorded the highest levels of GDP per person employed. In Italy, the population of the metropolitan region of Milano was slightly larger than in the capital of Roma and Milano also had somewhat higher levels of GDP and labour productivity than the capital. In a similar vein, the two main metropolitan regions of Spain – Madrid and Barcelona – also had results that were within quite close proximity of each other. The pattern observed in Germany was similar insofar as the two largest metropolitan regions in population terms, Berlin and the Ruhrgebiet, were again almost the same size and also recorded similar levels of labour productivity; however, these were not – as in most other EU Member States – among the highest productivity levels in the national economy.
Source: Eurostat (met_pjanaggr3), (met_10r_3gdp) and (met_10r_3emp)
Enterprise birth rates are calculated as the number of enterprise births (when a company is started from scratch) divided by the total number of active enterprises. An enterprise birth occurs when new production factors, in particular new jobs, are created; this may explain why policymakers pay particular attention to this indicator. In 2018, there were 2.5 million enterprises born in the EU’s business economy (as defined by NACE Sections B–N excluding Group 64.2); the EU’s enterprise birth rate was 9.7 %.
Some of the highest enterprise birth rates across the EU in 2018 were observed in dynamic regions, characterised by relatively high levels of economic performance. In 16 of the 20 EU Member States for which data are available, capital city metropolitan regions had enterprise birth rates that were higher than their respective national averages. The gap was particularly notable in Portugal and Italy, where the enterprise birth rate for the capital city metropolitan region was more than 2.0 percentage points higher, while the enterprise birth rate was also relatively high in the capital city metropolitan regions of France and Denmark.
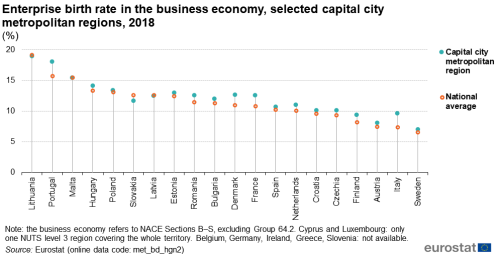
(%)
Source: Eurostat (met_bd_hgn2)
Metropolitan regions
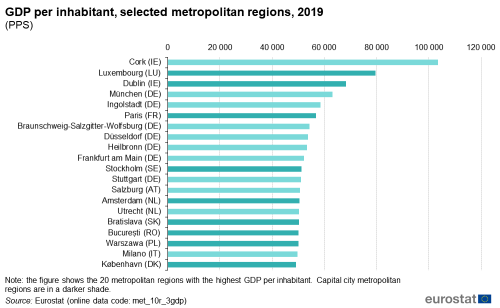
The information presented in this section moves away from focusing on capital cities to look more broadly at all metropolitan regions. Figure 8 shows the 20 metropolitan regions in the EU with the highest levels of GDP per inhabitant in 2019 (nine of which were capital cities).
- Across all metropolitan regions of the EU, the highest GDP per inhabitant was recorded in the southern Irish region of Cork (103 400 PPS in 2019); note that GDP does not measure the income ultimately available to private households and that this figure is likely to be inflated by the capital assets owned by multinational enterprises located in the region.
- The second and third highest ratios were recorded in Luxembourg (79 600 PPS; a single region within this typology) and Dublin (68 200 PPS), where figures may also be inflated, to some degree, for example as a result of multinational and financial enterprises locating their global or continental headquarters in these regions.
- Of the remaining 17 metropolitan regions:
- seven were located in Germany (note they did not include the capital of Berlin) with the highest level of GDP per inhabitant observed in the southern metropolitan region of München (63 100 PPS);
- seven were capital cities, with the highest level of GDP per inhabitant recorded in Paris (56 700 PPS);
- Salzburg (Austria), Utrecht (the Netherlands) and Milano (Italy) also featured among the 20 metropolitan regions in the EU with the highest levels of GDP per inhabitant.
(PPS)
Source: Eurostat (met_10r_3gdp)

(% share of total value added)
Source: Eurostat (met_10r_3gva)
There are many reasons that may explain the distribution and concentration of economic activities across the EU. Natural resource endowments may account for why some regions are particularly specialised in activities such as mining or forest-based activities. In a similar vein, the weather, location and landscape can help explain why others might be specialised in tourism-related activities. A critical mass of clients (either other enterprises or households/consumers) or the supply of skilled labour may also explain specialisations: for example, research parks tend to develop near to universities, whereas financial, communications and media services are often concentrated in capital city regions.
In 2019, gross value added in the EU economy was €12.5 trillion. Market services (defined as NACE Sections G–N) accounted for just over half (50.9 %) of all value added, while lower shares were recorded for non-market services (NACE Sections O–U; 22.0 %) and industry (NACE Sections B–E; 20.0 %); the residual share was divided between a number of other activities (including agriculture, forestry and fishing and construction).
- Cork (southern Ireland) and Ingolstadt (southern Germany; where the headquarters of Audi is located) were the only metropolitan regions in the EU to report that more than half of their total value added was provided by industrial activities.
- A majority (12 out of 20) of the metropolitan regions with the highest shares of value added in industry were located in Germany.
- Most of the other regions with high shares of their value added generated in industry were located in eastern EU Member States (Cork and Reggio nell Emilia in northern Italy were the only exceptions); this pattern may reflect the EU’s industrial base migrating eastwards, due to wide-ranging transformations, such as outsourcing, globalisation, and other changes to business paradigms.
Capital cities are among some of the most specialised regions for a range of market services that rely on the close proximity of a large number of potential clients (be these other businesses or households) – for example, business services, professional, scientific and technical activities, advertising or market research. In 2019, the 20 metropolitan regions with the highest shares of value added generated within market services included 15 capitals:
- in Dublin (Ireland), Paris (France), Amsterdam (the Netherlands), Sofia (Bulgaria) and Luxembourg, the share of total value added provided by market services was within the range of 68.4–69.6 %.
- Milano (Italy), Palma de Mallorca (Spain), Frankfurt am Main (Germany), München (also Germany) and Wroclaw (Poland) were the only non-capital metropolitan regions to appear among the most specialised regions for market services.
Some regions in the EU face significant structural challenges to improve their prosperity. These regions that have been ‘left behind’ are often characterised as former industrial heartlands and/or regions where non-market services (such as social welfare, health, education, and other general services provided by government) account for a relatively large share of the local economy. In 2019, the 20 metropolitan regions with the highest shares of value added generated within non-market services were principally located in western EU Member States (Belgium, Germany, France and the Netherlands) as well as three southern regions of Italy.
- Outside of the French outermost Caribbean regions of Les Abymes and Fort-de-France, the highest shares of non-market services in total value added were recorded in Namur (Belgium), Limoges (France), Taranto (Italy), Kiel (Germany) and s’ Gravenhage (the Hague; the Netherlands).
(%)
Source: Eurostat (met_lfe3emprt)
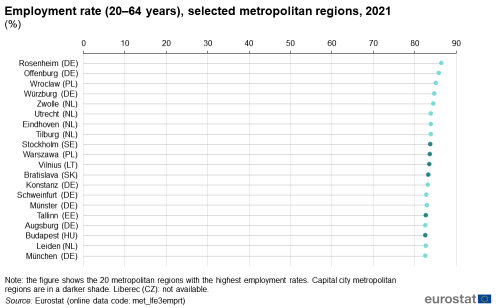
Figure 10 shows information for the 20 metropolitan regions in the EU with the highest employment rates; the data are presented for working-age people (aged 20–64 years). In 2021, the highest rate was recorded in the southern German region of Rosenheim (86.4 %); there were two other metropolitan regions with rates above 85.0 % – Offenburg (western Germany) and Wroclaw (south-west Poland). The other 17 regions included:
- six capital city metropolitan regions – Stockholm (Sweden), Warszawa (Poland), Vilnius (Latvia), Bratislava (Slovakia), Tallinn (Estonia) and Budapest (Hungary);
- six metropolitan regions from Germany;
- five metropolitan regions from the Netherlands.
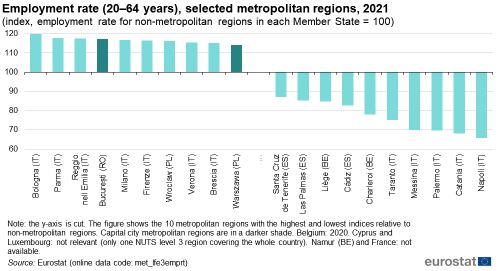
Figure 11 provides additional information on employment rates: it shows the metropolitan regions in the EU with the highest and lowest employment rates expressed as an index relative to non-metropolitan regions in the same EU Member State. As such, it highlights those Member States characterised by considerable inter-regional variations in their employment rates with respect to this classification.
- The biggest differences were recorded in Italy:
- Bologna, Parma and Reggio nell Emilia – which are all located in the northern Italian region of Emilia-Romagna – had the highest indices, while a further four northern Italian regions also recorded relatively high rates;
- Napoli, three regions located on the southern Italian island of Sicilia – Palermo, Messina and Catania – and Taranto had the lowest indices.
- Outside of Italian regions:
- the list of metropolitan regions with the highest employment indices was completed by Bucureşti, Wroclaw and Warszawa (both Poland);
- the list of metropolitan regions with the lowest indices was completed by three regions in Spain –Santa Cruz de Tenerife, Las Palmas (both in Canarias) and Cádiz – as well as two regions from Région Wallonne in Belgium, namely, Liège and Charleroi.
(index, employment rate for non-metropolitan regions in each Member State = 100)
Source: Eurostat (met_lfe3emprt)
High-skilled workplaces in Estonia
One third of Estonians live in the capital city of Tallinn and nearly half in its wider urban area. There are large disparities in terms of job accessibility, salaries and the cost of living between the Estonian capital and its other regions.
Based on the international standard classification of occupations (ISCO), Statistics Estonia defined high-skilled occupations to include managers, professionals, technicians and associate professionals. Some 240 000 workplaces – or two fifths of the Estonian total – were classified as highly-skilled. There were only six local administrative units in Estonia that had proportionally more high-skilled workplaces than their share of the national population (as shown in the table below); illustrating that high-skilled jobs were concentrated in a few urban areas.
Context
Metropolitan regions constitute important poles of innovation, research and economic growth, while also offering a wide variety of educational, cultural and professional opportunities to their inhabitants. Policy challenges within the EU are increasingly spread across administrative borders, for example, cities and metropolitan regions generate spill-over effects for their surrounding areas. These can result in positive as well as negative impacts on socioeconomic developments, the environment and quality of life.
Historically, metropolitan regions have been overlooked by EU cohesion policy, although a growing share of academic and political debate is now focused on the importance of these regions, as well how they interact with neighbouring rural communities. EU policymakers are taking steps to promote an integrated approach for local and territorial governance in order to deliver on initiatives such as the Circular Economy Action Plan or the European Green Deal.
Notes
- ↑ Note that some regions with very high levels of GDP are characterised by a strong presence of multinational enterprises and/or commuter flows and this may influence their levels of economic activity, especially if capital assets (for example technology patents) are domiciled in a region; the region of Cork is host to a number of the world’s top technology and pharmaceutical companies.
Direct access to
Online publications
Methodological publications
- Building the system of national accounts
- Methodological manual on territorial typologies – 2018 edition
Background articles
Statistical publications
- Eurostat regional yearbook – 2022 edition
- Urban Europe – statistics on cities, towns and suburbs – 2016 edition
Methodological publications
Statistical legislation
- National accounts – legislation
- Regulation (EU) 2017/2391 of the European Parliament and of the Council of 12 December 2017 amending Regulation (EC) No 1059/2003 as regards the territorial typologies (Tercet)
- Consolidated and amended version of Regulation (EC) No 1059/2003 of the European Parliament and of the Council on the establishment of a common classification of territorial units for statistics (NUTS)
Policy legislation
- Commission Delegated Regulation (EU) No 522/2014 of 11 March 2014 supplementing Regulation (EU) No 1301/2013 of the European Parliament and of the Council with regard to the detailed rules concerning the principles for the selection and management of innovative actions in the area of sustainable urban development to be supported by the European Regional Development Fund
- Regulation (EU) No 1305/2013 of the European Parliament and of the Council of 17 December 2013 on support for rural development by the European Agricultural Fund for Rural Development (EAFRD)
- Regulation (EU) No 1310/2013 of the European Parliament and of the Council of 17 December 2013 laying down certain transitional provisions on support for rural development by the European Agricultural Fund for Rural Development (EAFRD)
Visualisations
European Commission – Directorate-General Agriculture and rural development
European Commission – Directorate-General Regional and Urban Policy
- Cities and urban development
- Cohesion in Europe towards 2050; eighth report on economic, social and territorial cohesion
- Territorial cohesion
- Urban–rural linkages
European Committee of the Regions
European networks
United Nations
