Territorial typologies manual - metropolitan regions
This article forms part of Eurostat’s methodology manual on territorial typologies.

Full article
Classes for the typology and their conditions
Details of the typology
The metropolitan typology is a classification based on the following two categories:
- metropolitan regions, a single NUTS level 3 region or an aggregation of NUTS level 3 regions in which 50 % or more of the population live in a functional urban area (FUA) that is composed of at least 250 000 inhabitants;
- non-metropolitan regions, NUTS level 3 regions that are not metropolitan regions.
Note that capital city metropolitan regions may be identified as a subdivision of metropolitan regions; these refer to the metropolitan region which includes the capital city.
Methodology for the typology
Metropolitan regions are NUTS level 3 approximations of functional urban areas (composed of a city and its commuting zone) with at least 250 000 inhabitants. Each metropolitan region consists of one or more NUTS level 3 regions and is named after the principal functional urban area within its boundaries. For a schematic overview of how the different typologies fit together, see Figure 2 in the introductory chapter.
Step 1: classifying grid cells
The main building blocks used to identify functional urban areas are data for 1 km² population grid cells. Each grid cell has the same shape and surface area, thereby avoiding distortions caused by using units varying in size. This is a considerable advantage when compared with alternative approaches such as those based on the use of administrative data for local administrative units (LAUs).
These 1 km² population grid cells are plotted in relation to their neighbouring cells to identify cluster types; note this is the same process that is used for the degree of urbanisation typology (see Chapter 2). The cluster type used to identify cities is that of:
- urban centres (or high-density clusters) — a cluster of non-diagonal contiguous grid cells (in other words, excluding those cells with only touching corners) having a population density of at least 1 500 inhabitants per km² in each grid cell and collectively at least 50 000 inhabitants after gap-filling.
For a more detailed explanation of how densely populated grid cells are classified to urban centres (including the gap-filling process), see Chapter 1.
Step 2: classifying functional urban areas
The population grid cells are aggregated by functional urban area, thereby calculating the grid-based population of each functional urban area. From this aggregated table, functional urban areas with at least 250 000 inhabitants are selected. The identification of functional urban areas is described in detail within Chapter 3 — they are composed of the combination of:
- cities (densely populated areas) — where at least 50 % of the population lives in one or more urban centres (note this definition is identical to that used for the degree of urbanisation typology); and
- commuting zones — which are based on commuting patterns, and are defined as follows:
- if at least 15 % of employed persons living in one city work in another city, these cities are treated as a single destination for the commuting analysis;
- all LAUs from which at least 15 % of the employed population commute to the city are identified as commuting zones;
- enclaves (LAUs surrounded by a single functional urban area) are included as part of the commuting zone and exclaves (non-contiguous LAUs) are excluded from commuting zones.
In some cases the relationship between LAUs and urban centres may be complex — details of exceptions and adjustments that are made when classifying functional urban areas are provided in Chapter 3.
Step 3: identifying metropolitan regions
The population grid cells are also aggregated for NUTS level 3 regions, determining the grid-based population of every region.
- calculate the total grid-based population for each functional urban area (A);
- calculate the total grid-based population living in each NUTS level 3 region (B);
- identify those functional urban areas that are composed of at least 250 000 inhabitants;
- calculate the share of the regional population living in each of these functional urban areas (B/A);
- identify metropolitan regions as those regions where the share of the regional population living in a functional urban area is at least 50 %;
- check to ensure that each functional urban area of at least 250 000 inhabitants has a metropolitan region; if not, the metropolitan region is defined as the NUTS level 3 region with the highest share of its population living in that functional urban area (even if its share is less than 50 %);
- check to ensure that each capital region has a metropolitan region
In some cases, the approximation of functional urban areas is very good, while for others, the metropolitan region may be larger or smaller than the functional urban area.
As noted above, each functional urban area of at least 250 000 inhabitants is represented by at least one NUTS level 3 region. If in an adjacent NUTS level 3 region at least 50 % of the population also lives within the same functional urban area, then it too should be included in the metropolitan region. As such, metropolitan regions may extend across more than one NUTS level 3 region. For example, the metropolitan region for Liège in Belgium is composed of Arr. Liège and Arr. Waremme (NUTS level 3 codes BE332 and BE334), while the metropolitan region for Milano in Italy is composed of Lodi, Milano and Monza e della Brianza (NUTS level 3 codes ITC49, ITC4C and ITC4D).
As metropolitan regions include the commuting zones around major cities, this approach corrects for some of the potential misinterpretations of data resulting from commuting patterns, for instance rendering measures such as GDP per inhabitant more meaningful. For example, statistics based on the NUTS classification for Paris and London tend to report very high levels of GDP per inhabitant in part due to the influence of commuters whose output is included in the numerator but who are excluded from the statistics for the population data used in the denominator. Extending any analyses to the wider geographical area defined by the metropolitan region corrects for distortions like these as there is a better relation in the coverage of the numerator and denominator.
Note that unlike functional urban areas — see the example of Basel in Switzerland, as presented in Chapter 3 — metropolitan regions should not cross international borders into neighbouring territories. This is relatively important for one specific case, namely Luxembourg, which is classified as a single NUTS level 3 region (and a single metropolitan region). A relatively high share (approaching half) of the workforce in Luxembourg commutes to work from the neighbouring countries of Belgium, France and Germany; as such, the metropolitan region of Luxembourg does not cover a large part of its commuting zone, which may make interpretation of some indicators difficult for this region. However, the population of cross-border functional urban areas may contribute towards defining national metropolitan regions. An example is provided by the metropolitan region for Annecy/Genève (which is located exclusively within France). More than one third (35 %) of the population in the French alpine region of Haute-Savoie (NUTS code; FRK28) lives in the functional urban area of Annecy, while just over one quarter (27 %) of the regional population commutes to work in the Swiss transnational functional urban area of Genève. Together, these two functional urban areas account for 62 % of the region’s total population and more than 250 000 inhabitants; consequently, Haute-Savoie is defined as a metropolitan region (drawing on the contribution of both functional urban areas to surpass the minimum population threshold). Note also that the Swiss city of Genève (CH013) has its own metropolitan region, defined within the confines of its national territory.
Links to other spatial concepts/typologies
As described above and as shown in Figure 2 in the introductory chapter, there is a direct link between the local typology of functional urban areas (see Chapter 3) and the regional typology for metropolitan regions, with the former being used as a basis to construct the typology for the latter.
There are also close links between the different concepts used for cities, functional urban areas and metropolitan regions; an example is shown for Barcelona in Chapter 3.
Finally, there is a relatively close relationship between the metropolitan typology and the urban-rural typology. Despite the absence of an identical category, these two regional typologies are quite similar, insofar as:
- most predominantly urban regions are also metropolitan regions and vice versa;
- most predominantly rural regions are also non-metropolitan regions and vice versa;
- intermediate regions are split between metropolitan regions and non-metropolitan regions.
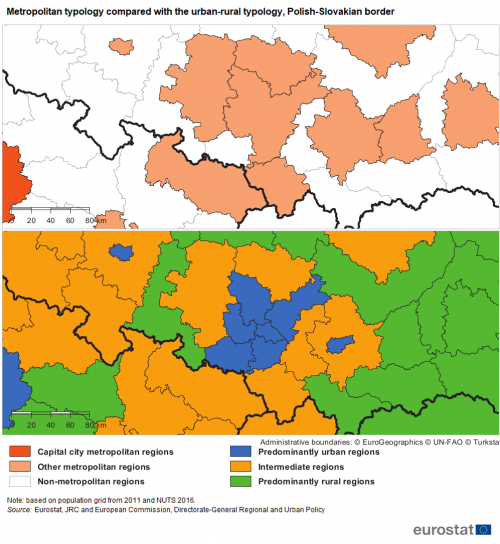
Figure 1 shows the classification of NUTS level 3 regions close to the Polish-Slovakian border and provides an example of the links between these two typologies. The differences between the typologies arise from three main sources:
- a different logic — the logic behind these two typologies can be described as morphological and functional. The urban-rural typology depends more on population size and population density (morphology), while the metropolitan typology relies on the presence of an urban centre and of functional economic ties to a city centre (functional);
- different size thresholds — metropolitan regions are related to cities and their commuting zones with at least 250 000 inhabitants, whereas predominantly urban regions represent urban centres of 50 000 inhabitants or more (the definition for cities) and/or urban clusters of at least 5 000 inhabitants (the definition for towns and suburbs);
- a different number of classes/categories — the urban-rural typology identifies three different types of region, while the metropolitan typology has only two.
Due to these differences, some predominantly urban regions may be classified as non-metropolitan regions because the city and its commuting zone (the functional urban area) is too small. In a similar vein, some predominantly rural regions can become part of a metropolitan region if they have strong commuting links to a city.
Results
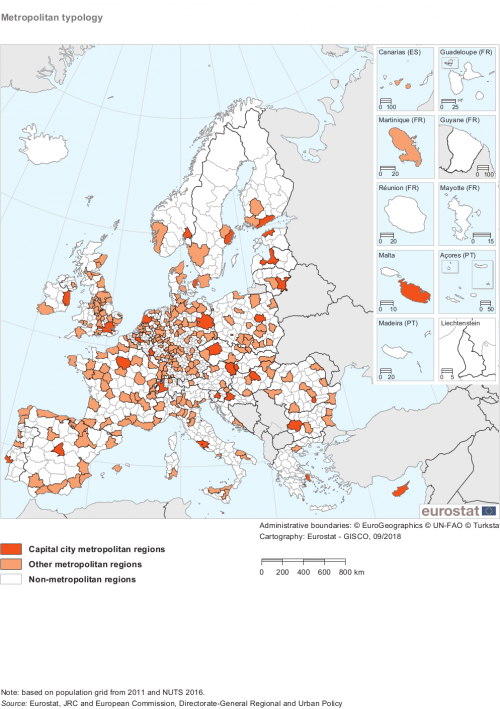
Based on the above definitions (for NUTS 2016), there are 28 capital city metropolitan regions and there are an additional 249 other metropolitan regions in the EU-28. Map 1 shows the final classification for metropolitan regions.
For all EU Member States, Norway and Switzerland, a list of metropolitan regions is available here.
Changes to the typology over time
The metropolitan typology was developed by the European Commission’s Directorate-General for Regional and Urban Policy in association with Eurostat. The aim of the typology was to build on work already done by the OECD so as to provide a consistent basis for the description of metropolitan and non-metropolitan regions.
The metropolitan typology was first presented in a Green paper on territorial cohesion (2009) and subsequently in a Regional Focus (2009). Subsequently, EU metropolitan regions were compared with OECD metropolitan regions and this led to a harmonisation exercise for the definition of metropolitan regions used by both organisations.
Changes over time that impact on the classification
The metropolitan regions classification should be updated to reflect any changes to the underlying sources of information that are used in its compilation. As such, the classification may be updated to reflect: changes to population distributions for 1 km² grid cells, changes to LAUs that are used as the basis for information on functional urban areas, changes to functional urban areas based on new commuting data, or changes in the NUTS classification. The frequency of such updates varies according to the source of information.
The NUTS Regulation specifies that the classification of regions should remain stable for a period of at least three years; the most recent updates were for NUTS 2010, NUTS 2013 and NUTS 2016. The NUTS Regulation also specifies that changes to LAUs may take place on an annual basis.
The frequency of updates for functional urban areas is a function of the availability of new commuting data; as such, it varies among the EU Member States. Most only collect LAU commuting data during a census year (generally once a decade). However, some Member States collect information on commuting each year through registers, they are in a position to update their classification of functional urban areas on a more regular basis.
Population grid statistics should be re-assessed in order to (re-)classify each NUTS level 3 region after each revision of LAUs, the functional urban areas, or the NUTS classification. Changes to the metropolitan regions classification resulting from a revision of population distributions for 1 km² grid cells are least common and these may be expected every 10 years. The next major update of the population grid is foreseen to take place for the 2021 reference year.
As an example, when moving from NUTS 2013 to NUTS 2016 there were two different situations identified which required changes to the metropolitan regions classification, namely:
- changes in the NUTS classification, such as NUTS level 3 regions merging together or being split apart into new codes when moving from NUTS 2013 to NUTS 2016;
- changes in metropolitan regions due to changes to the underlying data for functional urban areas, for example, when EU Member States updated the boundaries of their functional urban areas based on commuting data that was collected as part of the 2011 census exercise (or more recent data).
As a result of the latest changes to the NUTS classification the number of metropolitan regions in the EU-28 increased from 267 to 277. Only one metropolitan region from NUTS 2013 was reclassified as a non-metropolitan region in NUTS 2016, as the functional urban area of Liberec in Czechia saw its population fall to less than 250 000 inhabitants. By contrast, there were 11 new metropolitan regions that resulted from either newly created or expanding functional urban areas, they included: Düren and Bocholt (in Germany), Martinique (in France), Leeuwarden, North Overijssel and Breda (in the Netherlands) and Northampton, Cambridge, Colchester, Oxford and Plymouth (in the United Kingdom). A few existing metropolitan regions became larger in size when comparing the results for NUTS 2013 and NUTS 2016, they included: Amsterdam, s' Gravenhage, Leiden, Rotterdam and Groningen (in the Netherlands), Riga (in Latvia), Leeds, Manchester, Liverpool and Southampton (in the United Kingdom); as such, their metropolitan regions expanded to include one or more additional NUTS regions. In contrast, the capital metropolitan regions of Greece and Poland both lost one of their NUTS components as a result of re-evaluating the criteria. Western Attica was removed from the definition in Greece, as it had only 28.5 % of its population living in the functional urban area of the Greek capital, while Żyrardowski was removed from the definition in Poland, as it had only 18.3 % of its population living in the functional urban area of the Polish capital.
Future developments
The next update of the NUTS classification is foreseen to take place in 2019.
At the time of writing, a 2021 population and housing census implementing regulation is in the process of being adopted by the European Commission. It includes an article for 1 km² population grid statistics. As well as information for annual counts of populations, it also foresees more detailed analyses: population by sex, population by age, number of employed persons, population by place of birth, population by usual place of residence one year prior to the census. LAU commuting data will also become available, as there is a strong stakeholder interest in commuting data within most of the EU Member States.
Eurostat are also discussing post-2021 census developments with national statistical authorities. It is hoped that the European statistical system (ESS) will agree to produce — from the mid-2020s onwards — annual counts of populations (based on usual place of residence) for a 1 km² grid, with data to be made available within 12 months of the reference period.
Further information
Glossary entry:
Detailed methodology:
Regional statistics by typology (reg_typ)
Correspondence for NUTS regions:
Published indicators
A variety of different statistical surveys collect data for NUTS level 3 regions and this information may be used to calculate data for the two different categories in the metropolitan typology. This process involves aggregating the data for NUTS level 3 regions to compute a total or an average for all metropolitan or non-metropolitan regions within a territory (for example a Member State, or the EU as a whole).
Visualisation tools:
Eurostat publishes data for the metropolitan typology through Regions and cities illustrated.
Database:
Eurostat’s website provides information for a wide variety of indicators for the metropolitan typology. These statistics are available for the following statistical domains: demography, population projections, the labour market, crimes recorded by the police, economic accounts, business demography, intellectual property rights and transport. They are available here.
Examples

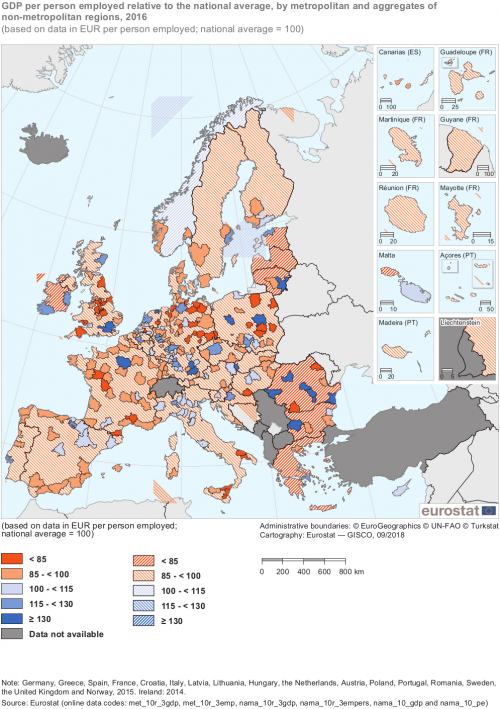
(based on data in EUR per person employed; national average = 100)
Source: Eurostat (met_10r_3gdp), (met_10r_3emp), (nama_10r_3gdp), (nama_10r_3empers), (nama_10_gdp) and (nama_10_pe)

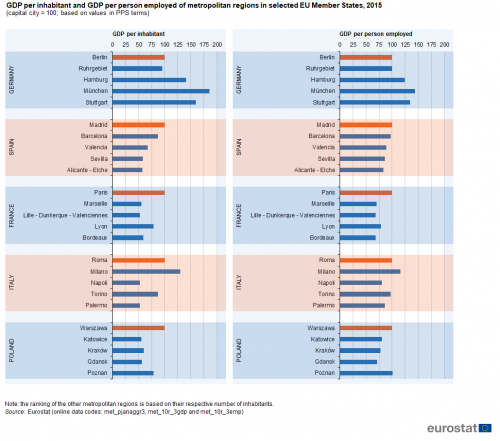
(capital city = 100; based on values in PPS terms)
Source: Eurostat (met_pjanaggr3), (met_10r_3gdp) and (met_10r_3emp)
Direct access to

