Subjective poverty statistics
Data extracted in October 2023.
Planned article update: November 2024.
Highlights
In 2022, in the EU, 1 in every 4 persons was considered to be subjectively poor.
In 2022, in the EU, subjective poverty was three times higher among the population with a low level of education compared with those with a high level of education.
In 2022, the high prevalence of subjective poverty was reported mainly in the eastern and southern parts of Europe.
.png)
Source: Eurostat, (ilc_sbjp01) (ilc_sbjp02) (ilc_sbjp03)
One in four people in the EU considered themselves to be subjectively poor in 2022. This share was higher among women than men, and higher among the population with a low education level compared with those with a high level of education.
Subjective poverty indicators are based on results from the European Union's (EU) statistics on income and living conditions (EU-SILC), a data collection which is conducted across EU Member States, as well as in most of the EFTA and candidate countries. The indicators use, as a basis, the information on the ability to make ends meet which has been collected in EU-SILC since the beginning of the data collection.
Full article
Subjective poverty is more prominent for women than for men
In 2022, the share of the EU population which was considered as being subjectively poor was 24.8 %. The share decreased slightly by 0.6 percentage points (pp) since 2021 and by 5.4 pp since 2018. In 2022, the share was 24.3 % for men and 25.3 % for women. Disparities among the EU Member States are visible in the data.
_20-11-2023.png)
Source: Eurostat (ilc_sbjp01)
At national level, the share of the population which was considered to be subjectively poor ranged in 2022 from 5.8 % to 68.4 %. The lowest shares were observed in Luxembourg (5.8 %), Finland (6.2 %) and the Netherlands (6.8 %). The highest shares were seen in Bulgaria (40.4 %) and Greece (68.4 %). In 13 EU Member States, more than 1 in every 5 persons were living under subjective poverty.
The share of subjective poverty for women was higher than for men in all EU Member States except in Austria, Ireland and Spain. In these three countries, the values were almost equal or equal for men and women.
When looking at three age groups – children (people aged less than 18), adults of working age (18 to 64 years) and the older population (aged 65 or over) – subjective poverty in the EU in 2022 was highest among children and lowest among adults of working age. In 9 Member States (Estonia, Lithuania, Slovenia, Poland, Latvia, Romania, Croatia, Bulgaria and Greece) the share with the highest value was among the older population. The share was highest among working age adults only in Finland (7.2 %) and the Netherlands (7.5 %).
.png)
Source: Eurostat (ilc_sbjp01)
Subjective poverty was three times higher among the population with a low education level compared with those with a high level of education
Segmentation of subjective poverty by education is substantial. In 2022, in the EU, almost one third (29.5 %) of the population with a low educational attainment level (ISCED levels 0-2) was considered to be subjectively poor. The rate was more than 3 times lower (9.2%) for the population having a high education (ISCED level 5-8). On the other hand, the share for people with a medium educational attainment level (ISCED level 3 and 4) was 18.0 % which was twice as high in comparison to the population with a high level of education. Overall, the share increased for all of the three groups of education between 2021 and 2022.
.png)
(% of population aged 18 and over)
Source: Eurostat (ilc_sbjp02)
Member States reported significant differences between high and low educated population groups. The widest differences in percentage points were in Bulgaria (47.7 pp), Hungary (41.5 pp) and Slovakia (39.5 pp) and the narrowest in Sweden (7.1 pp), Denmark (5.9 pp) and Finland (4.5 pp). The difference was at least 20 pp in 12 countries. In Hungary, the subjective poverty rate among those with a low education level was more than 7 times higher than among those with a high level of education.
Subjective poverty had a higher value than relative poverty in the majority of countries
Map 1 presents subjective poverty and Map 2 presents relative poverty. Relative poverty is measured by the at-risk-of poverty rate from the same EU-SILC data collection. The maps give figures for the EU, EFTA and candidate countries in 2022. In 2022, at EU level, subjective poverty was higher than the at-risk-of poverty rate by 8.3 pp. At national level, this overall trend of higher subjective poverty rate was observed in 18 EU countries, namely Belgium, Bulgaria, Cyprus, Czechia, Greece, Spain, France, Croatia, Hungary, Ireland, Italy, Latvia, Malta, Poland, Portugal, Romania, Slovenia, Slovakia; it was also the case for the candidate countries Montenegro, Albania, Serbia, Türkiye and North Macedonia. However, the opposite could be observed in 9 EU countries, Austria, Germany, Denmark, Estonia, Finland, Lithuania, Luxembourg, the Netherlands and Sweden, as well as in Switzerland and Norway. In general, high levels of subjective poverty were reported in the eastern and southern parts of Europe as well as in France. On the other hand, lower levels of subjective poverty in comparison to at-risk of poverty could be seen in the central part of Europe, the Nordic countries and in some of the Baltic states.
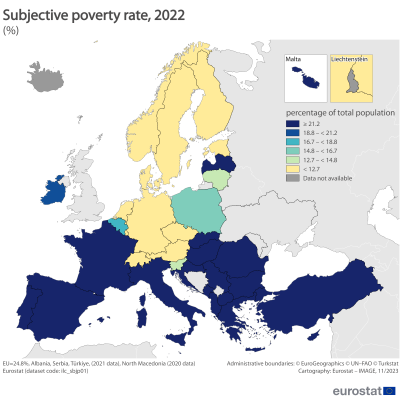
Map 1: Subjective poverty rate, 2022
Source: Eurostat (ilc_sbjp01)
Map 2: At-risk-of-poverty rate, 2022
Source: Eurostat (ilc_li02)


Source data for tables and graphs
Data sources
The data used in this article are derived from EU-SILC. EU-SILC data are compiled annually and are the main source of statistics that measure income and living conditions in Europe; it is also the main source of information used to link different aspects relating to the quality of life of households and individuals. The reference population for the information presented in this article is all private households and their current members residing in the territory of an EU Member State (or non-member country) at the time of data collection; persons living in collective households were excluded from the target population. The data for the EU are population-weighted averages of national data. The reference period for information on income is 2021, while the other households’ characteristics are referenced to 2022.
Context
Subjective poverty is a newly developed area with the idea of supplementing the well known and traditional poverty indicators such as at-risk-of-poverty, material and social deprivation, people living in quasi-jobless households etc. Subjective poverty is a concept developed based on the EU-SILC variable “Ability to make ends meet”. Contrary to the relative poverty measure, the at-risk-of poverty rate indicator (calculated based on the ranking of the households’ income at country level), the aim of subjective poverty is to assess the respondents’ perception of the difficulties experienced by the household in making ends meet. The assessment takes into account the households’ material wellbeing situation including income, expenditure, debt and wealth. The EU-SILC variable has 6 response categories:
- With great difficulty;
- With difficulty;
- With some difficulty;
- Fairly easy;
- Easily;
- Very easily.
Subjective poverty is defined on the basis of a combination of the top two categories of the variable. A household that answered “With great difficulty” or “With difficulty” is considered to fall under subjective poverty. This approach is more conservative than the approach based on the minimum income question (or lowest income to make ends meet). The minimum income question approach of subjective poverty was developed mid- 20th century, and it is a model based approach.
Used classification:
Educational attainment level is classified according to ISCED — the international standard classification of education. The (latest) 2011 version has the following levels:
- ISCED level 0 — early childhood education;
- ISCED level 1 — primary education;
- ISCED level 2 — lower secondary education;
- ISCED level 3 — (upper) secondary education;
- ISCED level 4 — post-secondary non-tertiary education;
- ISCED level 5 — short-cycle tertiary education;
- ISCED level 6 — bachelor’s or equivalent level;
- ISCED level 7 — master’s or equivalent level;
- ISCED level 8 — doctoral or equivalent level.
Direct access to
- Detailed list of legislative information on EU-SILC provisions for survey design, survey characteristics, data transmission and ad-hoc modules
- Regulation (EC) No 2019/1700 — the central piece of legislation for social surveys including EU-SILC
- Regulation (EC) No 2019/2242 — additional central piece of legislation for EU-SILC
- Summaries of EU Legislation: EU statistics on income and living conditions