Gallery of new files
This special page shows the last uploaded files.
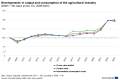 F3 Developments in output and consumption of the agricultural industry.png Cookced
16:57, 7 May 2024
1,000 × 669; 42 KB
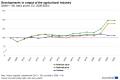 F2 Developments in output of the agricultural industry (2008 = 100, basic prices, EU, 2008-2023).png Cookced
16:56, 7 May 2024
1,000 × 669; 38 KB

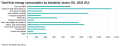
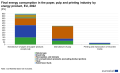 Final energy consumption in the paper, pulp and printing industry by energy product, EU, 2022 (PJ) v3.png Gnjatte
16:40, 7 May 2024
1,493 × 906; 54 KB
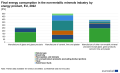 Final energy consumption in the non-metallic minerals industry by energy product, EU, 2022 (PJ) v3.png Gnjatte
16:38, 7 May 2024
1,493 × 906; 58 KB
 Final energy consumption in the chemical and petrochemical industry by energy product, EU, 2022 (PJ) v3.png Gnjatte
16:36, 7 May 2024
1,493 × 1,042; 58 KB
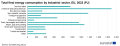
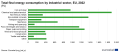 Total final energy consumption by industrial sector, EU, 2022 (PJ) v3.png Gnjatte
16:34, 7 May 2024
1,493 × 646; 54 KB
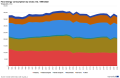
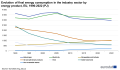
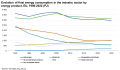
 Evolution of final energy consumption in the industry sector by energy product, EU, 1990-2022 (PJ) v3.png Gnjatte
16:33, 7 May 2024
1,493 × 902; 77 KB
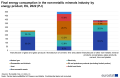
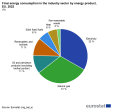 Final energy consumption in the industry sector by energy product, EU, 2022 (%) v3.png Gnjatte
16:30, 7 May 2024
981 × 901; 50 KB
- Final energy consumption in industry - detailed statistics13-05-2024.xlsx Maphoto
15:31, 7 May 2024
; 13 KB
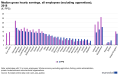 Figure 2 Median gross hourly earnings, all employees (excluding apprentices), 2018 rev2.png Kolakin
15:18, 7 May 2024
1,570 × 979; 117 KB
 Figure 2 Median gross hourly earnings, all employees (excluding apprentices), 2018 rev1.png Kolakin
15:12, 7 May 2024
1,570 × 979; 117 KB
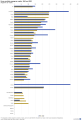 Gross available energy per capita, 1990 and 2022 (Gigajoules per capita).png Diazfer
15:11, 7 May 2024
1,463 × 2,148; 93 KB
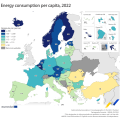 Energy consumption per capita, 2022, MAP1 (Gigajoules per person).png Diazfer
15:11, 7 May 2024
2,000 × 2,000; 735 KB
 Gross available energy by fuel, EU, 1990-2022 Petajoule (PJ) F4.png Diazfer
14:30, 7 May 2024
1,463 × 955; 58 KB
 Gross available energy by fuel, EU, 1990-2022 Petajoule (PJ).png Diazfer
14:29, 7 May 2024
1,463 × 955; 57 KB
 Structural shares of energy use in main categories of energy balances, EU, 1990-2022 (%).png Diazfer
14:28, 7 May 2024
1,464 × 955; 42 KB
 Primary energy production by fuel, EU, in selected years, 1990-2022 Petajoule (PJ).png Diazfer
14:28, 7 May 2024
1,464 × 957; 61 KB
 Non-energy consumption by fuel, EU, 1990-2022 Petajoule (PJ).png Diazfer
14:28, 7 May 2024
1,463 × 955; 51 KB
 Imports of selected energy products, EU, 1990-2022 Petajoule (PJ).png Diazfer
14:28, 7 May 2024
1,463 × 955; 54 KB
 Final energy consumption by sector, EU, 2022 (% of total, based on terajoules).png Diazfer
14:28, 7 May 2024
1,465 × 957; 47 KB
 Final energy consumption by sector, EU, 1990-2022 Terajoules (TJ).png Diazfer
14:28, 7 May 2024
1,465 × 957; 47 KB
 Final energy consumption by fuel, EU, 1990-2022 Petajoule (PJ).png Diazfer
14:28, 7 May 2024
1,465 × 957; 55 KB
 Exports of selected energy products, EU, 1990-2022 Petajoule (PJ).png Diazfer
14:28, 7 May 2024
1,463 × 955; 65 KB
 Energy intensity of the economy, in selected years, 2012-2022 (kilogram of oil equivalent per € thousand).png Diazfer
14:28, 7 May 2024
1,465 × 957; 85 KB
 Energy intensity of the economy, 2022, MAP2 (Gigajoule per thousand euro PPS).png Diazfer
14:28, 7 May 2024
2,000 × 2,000; 739 KB
 Energy dependency by fuel, EU, in selected years, 1990-2022 Petajoule (PJ).png Diazfer
14:28, 7 May 2024
1,463 × 954; 85 KB
 Energy consumption per capita, 2022, MAP1 (Terajoules per person).png Diazfer
14:28, 7 May 2024
2,000 × 2,000; 735 KB
 Energy consumption by transport mode, EU, 1990-2022 (1990 = 100, based on terajoules).png Diazfer
14:28, 7 May 2024
1,465 × 957; 79 KB
 ENPE24 Median equivalised annual net income, 2012-2022 (€ per capita) .png EXT-K-Utvik
13:28, 7 May 2024
925 × 297; 22 KB
- Temporary protection for persons fleeing Ukraine monthly statistics May 2024.xlsx Grasffa
13:19, 7 May 2024
; 579 KB
 Figure 3 Low-wage earners employees (excluding apprentices), 2018 rev1 .png Kolakin
13:08, 7 May 2024
1,424 × 888; 108 KB

 Net greenhouse gas emissions (including international aviation, including LULUCF) trend, EU, 1990 - 2022V1.png Horvaju
11:34, 7 May 2024
946 × 623; 31 KB
 Net greenhouse gas emissions (including international aviation, including LULUCF) trend, EU, 1990 - 2022.png Horvaju
11:29, 7 May 2024
946 × 623; 31 KB
 Final energy consumption in the paper, pulp and printing industry by energy product, EU, 2022 (PJ).png Gnjatte
23:03, 6 May 2024
1,519 × 875; 64 KB
 Final energy consumption in the non-metallic minerals industry by energy product, EU, 2022 (PJ).png Gnjatte
23:01, 6 May 2024
1,470 × 950; 70 KB
 Final energy consumption in the chemical and petrochemical industry by energy product, EU, 2022 (PJ).png Gnjatte
22:57, 6 May 2024
1,522 × 910; 60 KB
 Total final energy consumption by industrial sector, EU, 2022 (PJ) v2.png Gnjatte
22:55, 6 May 2024
1,522 × 584; 53 KB
 Evolution of final energy consumption in the industry sector by energy product, EU, 1990-2022 (PJ) v2.png Gnjatte
22:54, 6 May 2024
1,522 × 885; 69 KB
 Total final energy consumption by industrial sector, EU, 2022 (PJ).png Gnjatte
22:24, 6 May 2024
1,522 × 584; 27 KB
 Evolution of final energy consumption in the industry sector by energy product, EU, 1990-2022 (PJ).png Gnjatte
22:22, 6 May 2024
1,522 × 885; 62 KB

.png)
_v3.png)
_v3.png)
_v3.png)
_v3.png)
_v3.png)
_v3.png)
,_2018_rev2.png)
,_2018_rev1.png)
.png)
.png)
_F4.png)
.png)
.png)
.png)
.png)
.png)
.png)
.png)
.png)
.png)
.png)
.png)
.png)
.png)
.png)
.png)

,_2018_rev1_.png)

_trend,_EU,_1990_-_2022V1.png)
_trend,_EU,_1990_-_2022.png)
.png)
.png)
.png)
_v2.png)
.png)
_.png)
_v2.png)
.png)