Gallery of new files
This special page shows the last uploaded files.

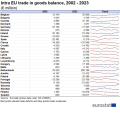
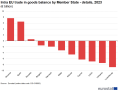 Intra EU trade in goods balance by Member State - details, 2023.png Roodhan
14:32, 8 May 2024
1,066 × 820; 85 KB
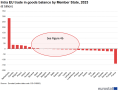 Intra EU trade in goods balance by Member State, 2023.png Roodhan
14:32, 8 May 2024
1,066 × 820; 125 KB
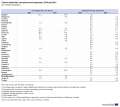 Cancer related day care places and equipment, 2016 and 2021 (per 100 000 inhabitants) Health2024.png EXT-S-Allen
14:25, 8 May 2024
1,025 × 916; 53 KB
 Surgical operations and procedures performed related to breast cancer, 2016 and 2021 (per 100 000 inhabitants) Health2024.png EXT-S-Allen
14:25, 8 May 2024
1,025 × 941; 59 KB
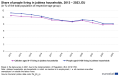 Share of people living in jobless households, 2013 – 2023, EU (in % of the total population of respective age group).png Sostkaj
13:52, 8 May 2024
1,251 × 789; 55 KB
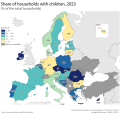
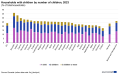 Households with children by number of children, 2023 (% of total households).png Sostkaj
13:44, 8 May 2024
1,368 × 838; 84 KB
 Households by type and presence of children, 2013-2023, EU (in millions).png Sostkaj
13:28, 8 May 2024
1,706 × 919; 71 KB
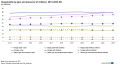
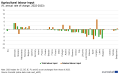
 F5r Agricultural labour input (%, average annual rate of change, 2008-2023).png Cookced
11:44, 8 May 2024
1,015 × 669; 33 KB
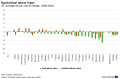
 F4r Agricultural labour input (%, annual rate of change, 2022-2023).png Cookced
11:43, 8 May 2024
1,015 × 623; 34 KB
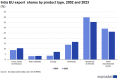
 Share of intra EU trade in goods by product type, 2002 - 2023.png Roodhan
11:37, 8 May 2024
765 × 657; 191 KB
 Intra EU exports of goods by product type, 2002 and 2023.png Roodhan
11:37, 8 May 2024
847 × 586; 65 KB

 EU goods total exports divided by imports, 2002-2023.png Roodhan
11:37, 8 May 2024
682 × 639; 158 KB
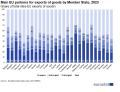 Main EU partners for exports of goods by Member State, 2023.png Roodhan
11:37, 8 May 2024
857 × 657; 160 KB
 Intra EU goods exports divided by imports, 2002-2023.png Roodhan
11:37, 8 May 2024
682 × 639; 148 KB
 Extra EU goods exports divided by imports, 2002-2023.png Roodhan
11:37, 8 May 2024
682 × 639; 149 KB
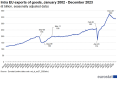 Intra EU exports of goods, January 2002 - December 2023.png Roodhan
11:37, 8 May 2024
853 × 606; 112 KB
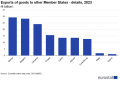 Exports of goods to other Member States - details, 2023.png Roodhan
11:37, 8 May 2024
833 × 587; 56 KB
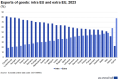
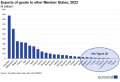
 Exports of goods to other Member States, 2002 and 2023.png Roodhan
11:37, 8 May 2024
745 × 639; 147 KB
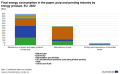 Final energy consumption in the paper, pulp and printing industry by energy product, EU, 2022 (PJ) v4.png Gnjatte
09:59, 8 May 2024
1,000 × 617; 32 KB
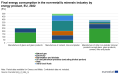 Final energy consumption in the non-metallic minerals industry by energy product, EU, 2022 (PJ) v4.png Gnjatte
09:57, 8 May 2024
1,000 × 617; 35 KB
 F2Growth rates of greenhouse gas emissions by the economy, EU, Q4 2023.png Horvaju
09:50, 8 May 2024
1,092 × 675; 32 KB
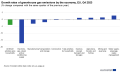
 Growth rates of greenhouse gas emissions by the economy, EU, Q4 2023.png Horvaju
09:48, 8 May 2024
1,092 × 675; 32 KB
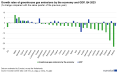 F3Growth rates of greenhouse gas emissions by the economy and GDP, Q4 2023.png Horvaju
09:46, 8 May 2024
1,129 × 688; 52 KB
 F2Growth rates of greenhouse gas emissions by economic sector (% change compared with the same quarter of the previous year, EU, Q4 2023).png Horvaju
09:38, 8 May 2024
1,092 × 675; 32 KB
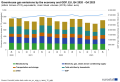 F1Greenhouse gas emissions by the economy and GDP, EU, 2020Q4 - 2023Q4.png Horvaju
09:33, 8 May 2024
1,111 × 755; 55 KB
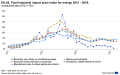 EA-20, Total industrial import price index for energy 2021 - 2024, unadjusted data (2021=100) 07-05-2024.png Rosswen
17:56, 7 May 2024
1,250 × 784; 84 KB
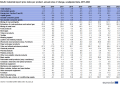 EA-20, Industrial import price index per product, annual rates of change, unadjusted data, 2015-2023 07-05-2024.png Rosswen
17:54, 7 May 2024
1,299 × 923; 538 KB
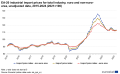 EA-20 industrial import prices for total industry, euro and non-euro-area, unadjusted data, 2015-2024 (2021=100) 07-05-2024.png Rosswen
17:54, 7 May 2024
1,250 × 775; 69 KB
 EA-20, Industrial import price index per country, annual rates of change, unadjusted data, 2015-2023 07-05-2024.png Rosswen
17:54, 7 May 2024
1,295 × 635; 275 KB
 EA-20, Industrial import price index for total industry and main industrial groupings, unadjusted data, 2015-2024 (2021=100) 07-05-2024.png Rosswen
17:54, 7 May 2024
1,251 × 772; 76 KB
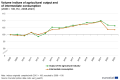
 F9 Change in the volume indices of agricultural output and .png Cookced
17:11, 7 May 2024
1,000 × 662; 36 KB
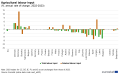
 F7 Agricultural income per annual work unit (Indicator A) .png Cookced
17:09, 7 May 2024
1,016 × 669; 43 KB
 F5 Agricultural labour input (%, average annual rate of change, 2008-2023).png Cookced
17:09, 7 May 2024
1,015 × 669; 33 KB
 F4 Agricultural labour input (%, annual rate of change, 2022-2023).png Cookced
16:57, 7 May 2024
1,015 × 623; 35 KB


_Health2024.png)
_Health2024.png)
.png)
.png)
.png)
.png)
.png)
.png)
.png)
.png)
.png)


_v4.png)
_v4.png)


.png)

_07-05-2024.png)

_07-05-2024.png)

_07-05-2024.png)


_.png)
.png)
.png)