Gallery of new files
This special page shows the last uploaded files.
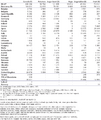
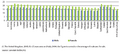
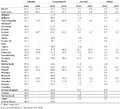
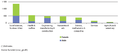 Graduates from tertiary education, by fi eld of education and gender, EU-27, 2006 (1)(1 000).PNG Maintenance script
11:59, 30 April 2009
676 × 303; 14 KB
 Final energy consumption by transport mode, 1990-2004.PNG Maintenance script
11:59, 30 April 2009
937 × 364; 38 KB
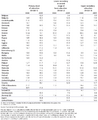
 Current account transactions, EU-27 (1).PNG Maintenance script
11:59, 30 April 2009
906 × 489; 35 KB
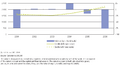
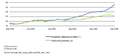
 20090304140335!Exchange rates against the euro (1).PNG Maintenance script
11:59, 30 April 2009
901 × 414; 36 KB
 Value added by enterprise size class, EU-27, 2005 (1)(% of sectoral total).PNG Maintenance script
11:59, 30 April 2009
656 × 293; 20 KB
 20090303130830!GDP per capita at current market prices, 2007.PNG Maintenance script
11:59, 30 April 2009
489 × 209; 7 KB
 Value added by enterprise size class, mining and quarrying and manufacturingactivities, EU-27, 2005 (1)(% of sectoral total).PNG Maintenance script
11:59, 30 April 2009
675 × 543; 39 KB
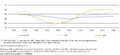
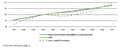
 Real GDP growth, EU-27 (% change compared with the previous year)).PNG Maintenance script
11:59, 30 April 2009
697 × 276; 16 KB
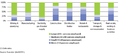
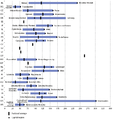
 Maastricht criterion rates, annual average for 2007.PNG Maintenance script
11:59, 30 April 2009
938 × 544; 41 KB
 Expenditure on care for elderly, 2005 (1)(% of GDP).PNG Maintenance script
11:59, 30 April 2009
695 × 344; 24 KB
 Breakdown of labour costs, business economy, 2006 (1).PNG Maintenance script
11:59, 30 April 2009
556 × 263; 11 KB
 Agricultural output and value added (EUR million).PNG Maintenance script
11:59, 30 April 2009
485 × 371; 20 KB

 Total aquaculture production(1 000 tonnes live weight).PNG Maintenance script
11:59, 30 April 2009
688 × 676; 65 KB
 Share of GVA and employment in manufacturing (NACE D), 2005 Percentage.PNG Maintenance script
11:59, 30 April 2009
765 × 626; 37 KB
 Relative median at-risk-of-poverty gap, 2006(%).PNG Maintenance script
11:59, 30 April 2009
682 × 327; 21 KB
 GVA per person employed and sector share of total GVA, in the EU-15 and 12 new Member States (NMS), 2005 Percentage.PNG Maintenance script
11:59, 30 April 2009
754 × 136; 12 KB
 Consumption expenditure and gross capital formation at constant prices, EU-27.PNG Maintenance script
11:59, 30 April 2009
694 × 283; 17 KB
 Agricultural production of crops, 2006.PNG Maintenance script
11:59, 30 April 2009
926 × 1,100; 141 KB
 Total catches in all fishing regions(1 000 tonnes live weight).PNG Maintenance script
11:59, 30 April 2009
682 × 695; 77 KB
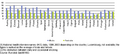
 Tax rate on low wage earners- tax wedge on labour cost, 2006 (%).PNG Maintenance script
11:59, 30 April 2009
677 × 287; 20 KB
 Student mobility in tertiary education, 2005 (1).PNG Maintenance script
11:59, 30 April 2009
930 × 467; 39 KB
 Pupil-teacher ratio in primary, lower and upper secondary education (1).PNG Maintenance script
11:59, 30 April 2009
932 × 1,139; 119 KB
 Net migration (including corrections), EU-27 (1)(1 000).PNG Maintenance script
11:59, 30 April 2009
673 × 302; 18 KB
 Energy dependency rate, EU-27(% of net imports in gross inland consumption and bunkers, based on tonnes of oil equivalent).PNG Maintenance script
11:59, 30 April 2009
681 × 118; 15 KB
 Disposable income of private households per inhabitant, in PPCS, by NUTS 2 regions, 2005.PNG Maintenance script
11:59, 30 April 2009
750 × 868; 434 KB
 Daily smokers among the population aged 15-24, 2003 (1).PNG Maintenance script
11:59, 30 April 2009
919 × 469; 40 KB
 Comparative price levels (1) (fi nal consumption by private households including indirect taxes, EU-27=100).PNG Maintenance script
11:59, 30 April 2009
675 × 691; 88 KB
 20090304152555!GDP per capita at current market prices, 2007.PNG Maintenance script
11:59, 30 April 2009
716 × 336; 25 KB
 Weighted emissions of acidifying substances, by sector, EU-27, 2005 (1)(%, based on acid equivalents).PNG Maintenance script
11:59, 30 April 2009
533 × 254; 16 KB
 Population and population projections (EUROPOP2008 convergence scenario)(million).PNG Maintenance script
11:59, 30 April 2009
685 × 328; 44 KB
 Gross domestic expenditure on R&D by source of funds.PNG Maintenance script
11:59, 30 April 2009
927 × 842; 81 KB
 GDP per inhabitant, in PPS, by NUTS 2 regions, 2005In percentage of the EU-27 average (EU-27 = 100).PNG Maintenance script
11:59, 30 April 2009
692 × 735; 54 KB
 Daily smokers, 2003 (1) (% of male female population).PNG Maintenance script
11:59, 30 April 2009
556 × 250; 10 KB
 20090304104329!Gross value added at basic prices, EU-27, 2007 (1) (% share of total gross value added).PNG Maintenance script
11:59, 30 April 2009
469 × 190; 6 KB
 Production and domestic output price indices for industry, EU-27(2000=100).PNG Maintenance script
11:59, 30 April 2009
681 × 318; 18 KB
 Minimum wages in EU Member States and Turkey.PNG Maintenance script
11:59, 30 April 2009
947 × 721; 65 KB
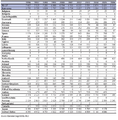
 Healthcare indicators (per 100 000 inhabitants).PNG Maintenance script
11:59, 30 April 2009
572 × 690; 40 KB
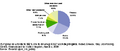
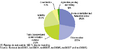
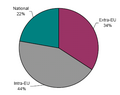 Air passenger transport in EU-27 share by type of transport in 2007.PNG Maintenance script
11:59, 30 April 2009
352 × 279; 11 KB
 Adjustment of GDP due to the balancing process.PNG Maintenance script
11:59, 30 April 2009
907 × 467; 26 KB
(1_000).PNG)
.PNG)
.PNG)
(%25_of_sectoral_total).PNG)

_(1998%3D100,_based_on_the_number_of_serious_accidents_per_100_000_persons_employed).PNG)
.PNG)

(%25_of_sectoral_total).PNG)

.PNG)
_in_total_nonfinancial_business_economy_employment,_by_NUTS_2_regions,_2005_Percentage.PNG)

(%25_of_GDP).PNG)
.PNG)
.PNG)

.PNG)
,_2005_Percentage.PNG)
.PNG)

_(1).PNG)
.PNG)
.PNG)
.PNG)
.PNG)
,_EU-27_(1)(1_000).PNG)
(years).PNG)


.PNG)
_(fi_nal_consumption_by_private_households_including_indirect_taxes,_EU-27%3D100).PNG)

(%25,_based_on_acid_equivalents).PNG)
(million).PNG)

.PNG)
_(%25_of_male_female_population).PNG)
.PNG)

,_2006_(per_100_000_inhabitants).PNG)
.PNG)


).PNG)
,_2005_Percentage.PNG)
.PNG)
_(%25_share_of_total_gross_value_added).PNG)