Tutorials
Log in
Statistics Explained
menu
search
search
Navigation
Main page
Statistical themes
Glossary
Categories
Statistics 4 beginners
Tutorials
Help
Eurostat home
Education corner
Online publications
Regional yearbook
Sustainable development
Full list
Tools
Special pages
search
Navigation
Main page
Statistical themes
Glossary
Categories
Statistics 4 beginners
Tutorials
Help
Eurostat home
Education corner
Online publications
Regional yearbook
Sustainable development
Full list
Tools
Special pages
Navigation
Main page
Statistical themes
Glossary
Categories
Statistics 4 beginners
Tutorials
Help
Eurostat home
Education corner
Online publications
Regional yearbook
Sustainable development
Full list
Tools
Special pages
File list
This special page shows all uploaded files.
File list
Items per page:
20
50
100
250
500
Search for media name:
Username:
Include old versions of files
Go
First page
Previous page
Next page
Last page
Date
Name
Thumbnail
Size
User
Description
Versions
15:44, 8 May 2024
Energy-Overview-Data-2022.xlsx
(
file
)
413 KB
Diazfer
2
14:32, 8 May 2024
Intra-EU trade in goods 2023.xlsx
(
file
)
167 KB
Roodhan
null
2
14:32, 8 May 2024
Intra EU trade in goods balance by Member State - details, 2023.png
(
file
)
85 KB
Roodhan
null
2
14:32, 8 May 2024
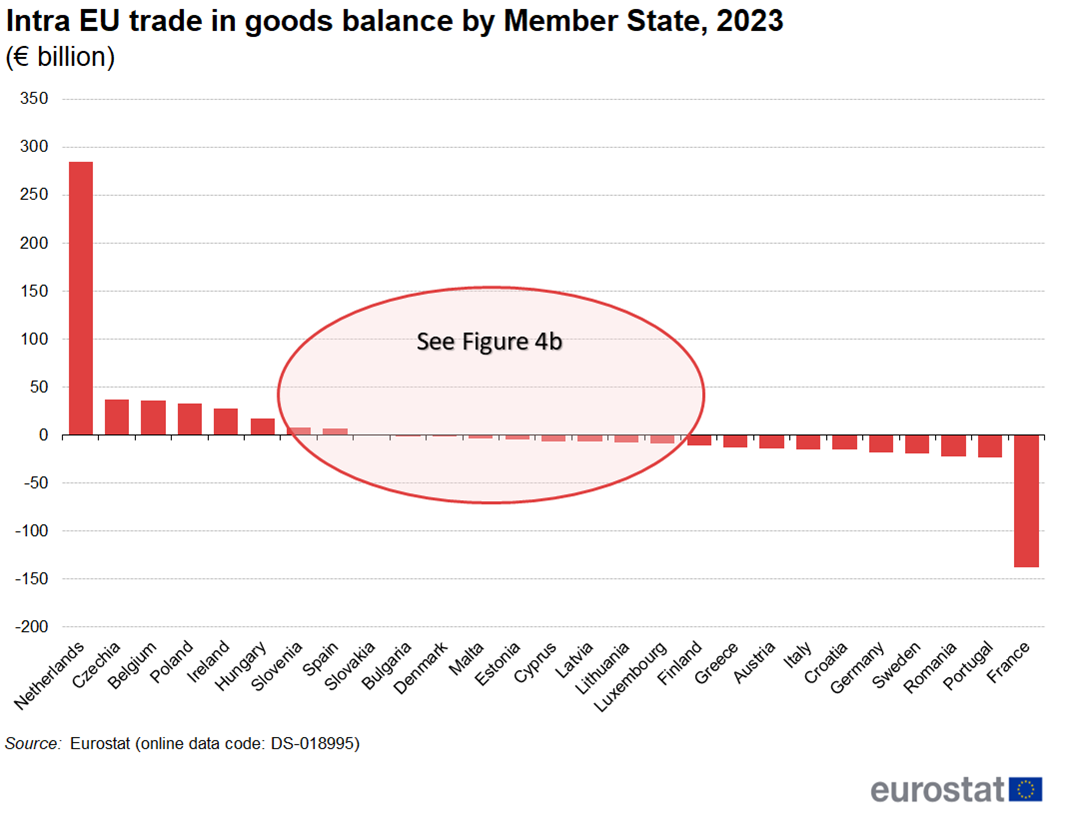
Intra EU trade in goods balance by Member State, 2023.png
(
file
)
125 KB
Roodhan
null
2
14:25, 8 May 2024
Cancer statistics Health2024.xlsx
(
file
)
1.21 MB
EXT-S-Allen
null
2
14:25, 8 May 2024
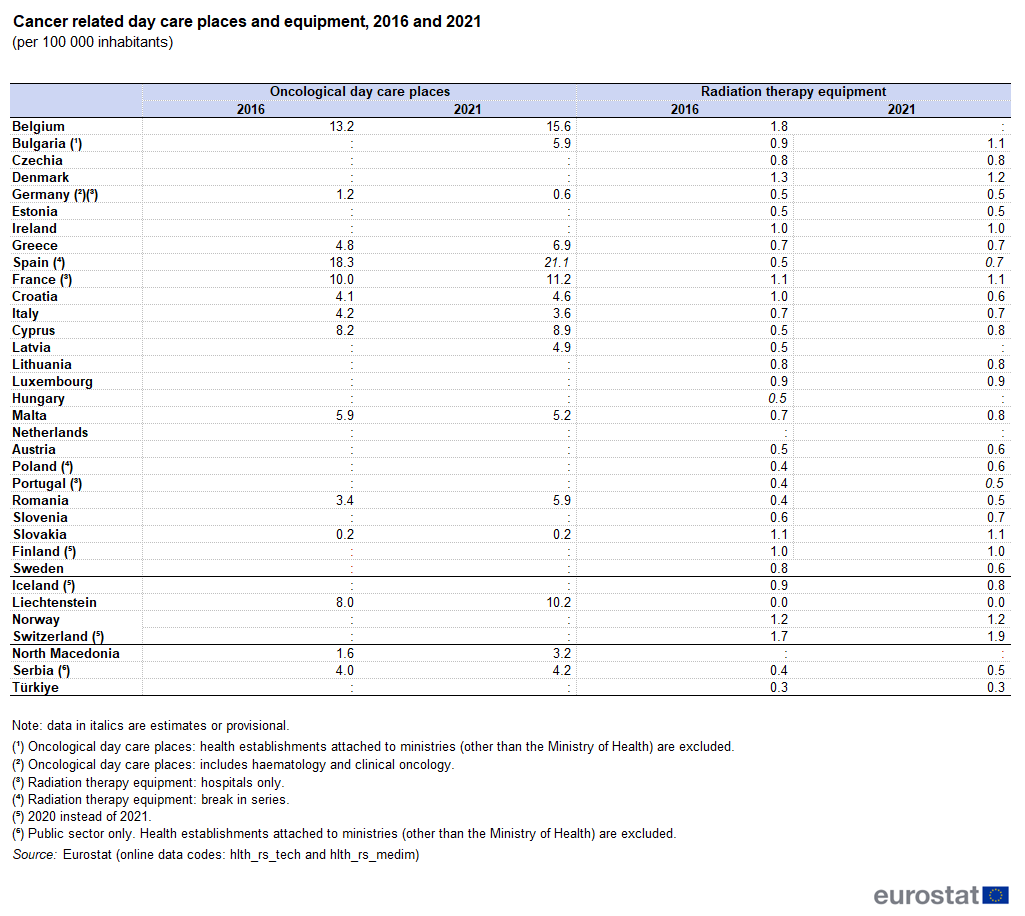
Cancer related day care places and equipment, 2016 and 2021 (per 100 000 inhabitants) Health2024.png
(
file
)
53 KB
EXT-S-Allen
null
1
14:25, 8 May 2024
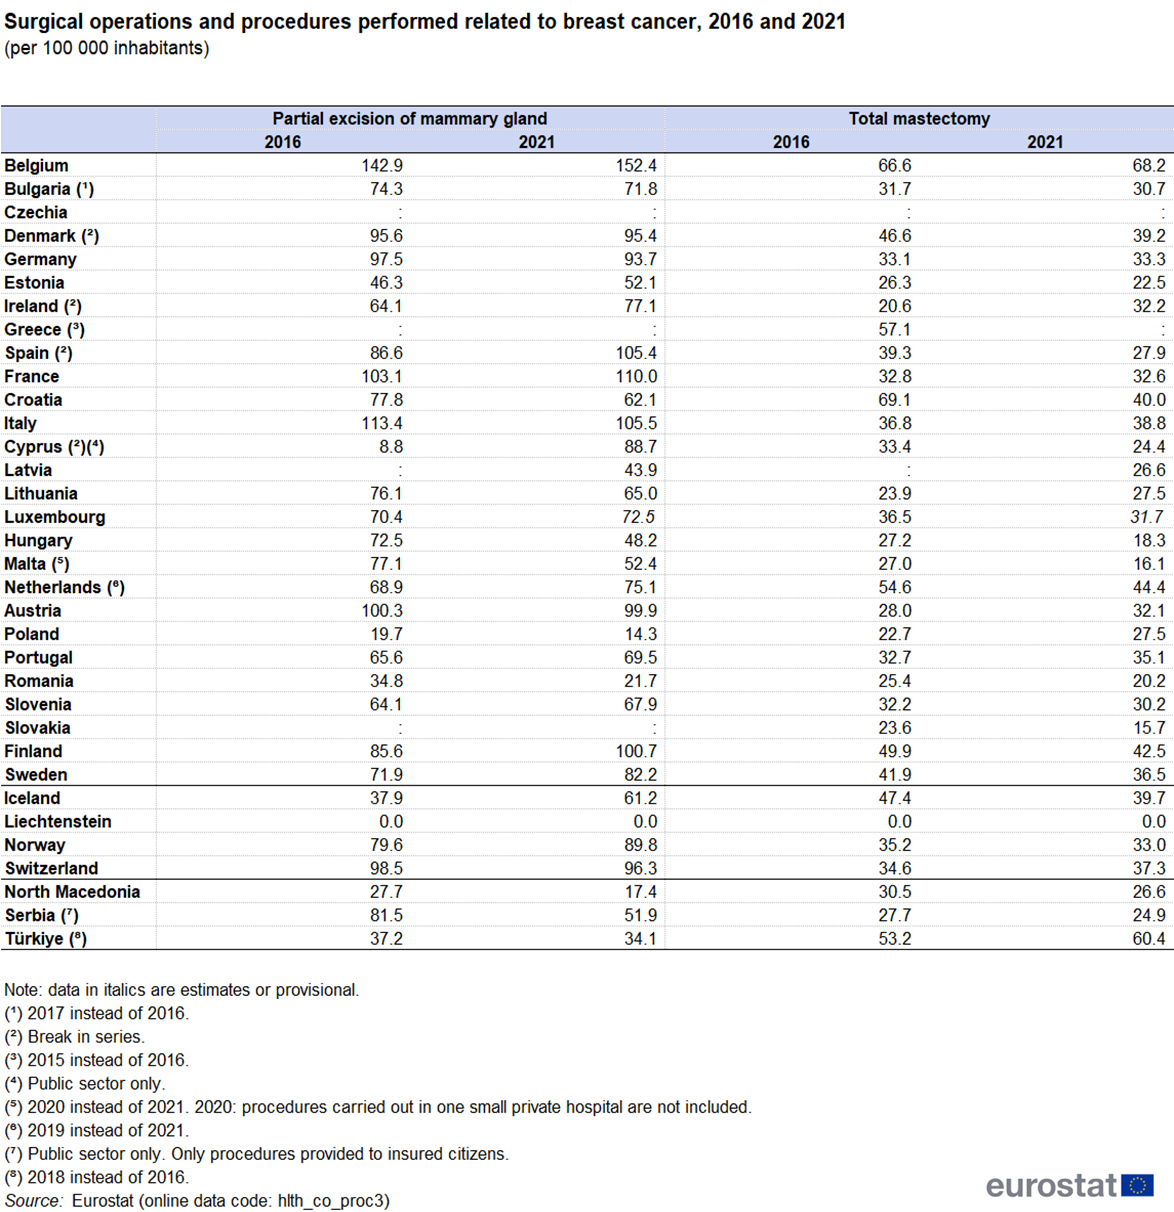
Surgical operations and procedures performed related to breast cancer, 2016 and 2021 (per 100 000 inhabitants) Health2024.png
(
file
)
59 KB
EXT-S-Allen
null
1
13:52, 8 May 2024
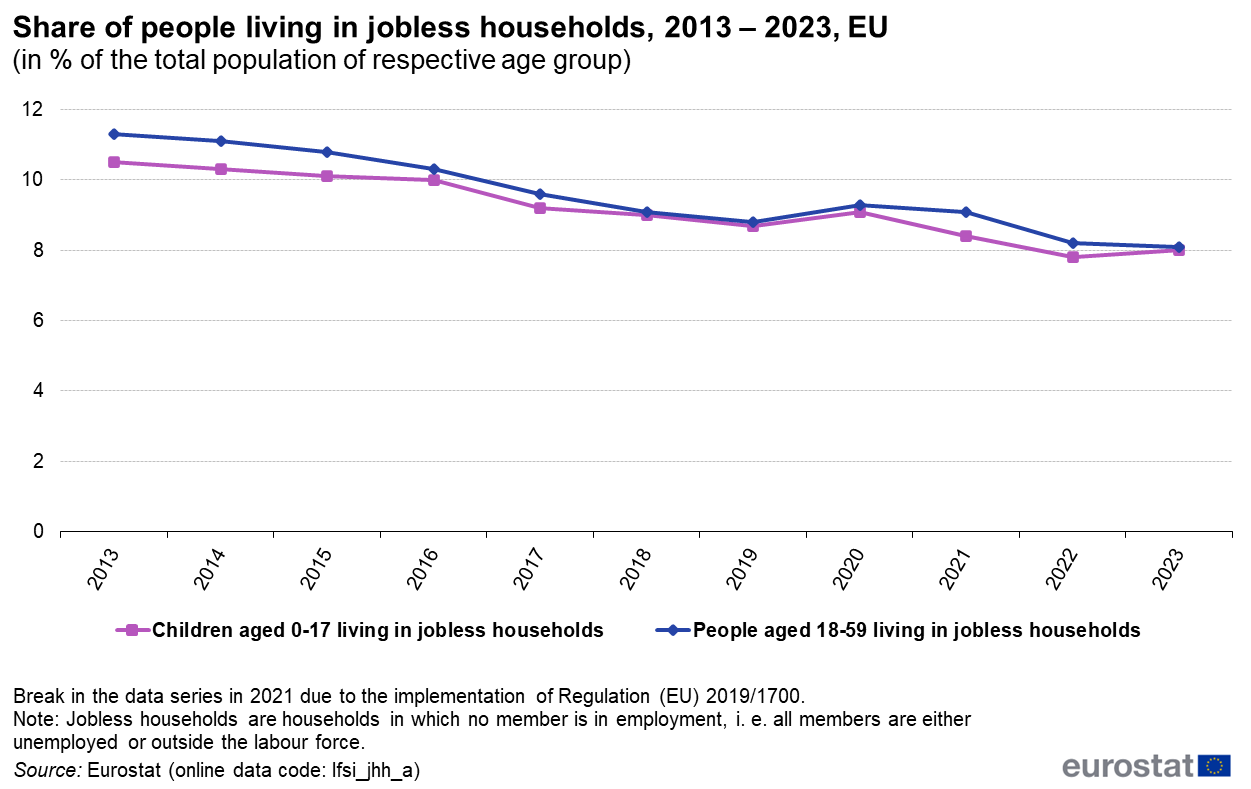
Share of people living in jobless households, 2013 – 2023, EU (in % of the total population of respective age group).png
(
file
)
55 KB
Sostkaj
1
13:50, 8 May 2024
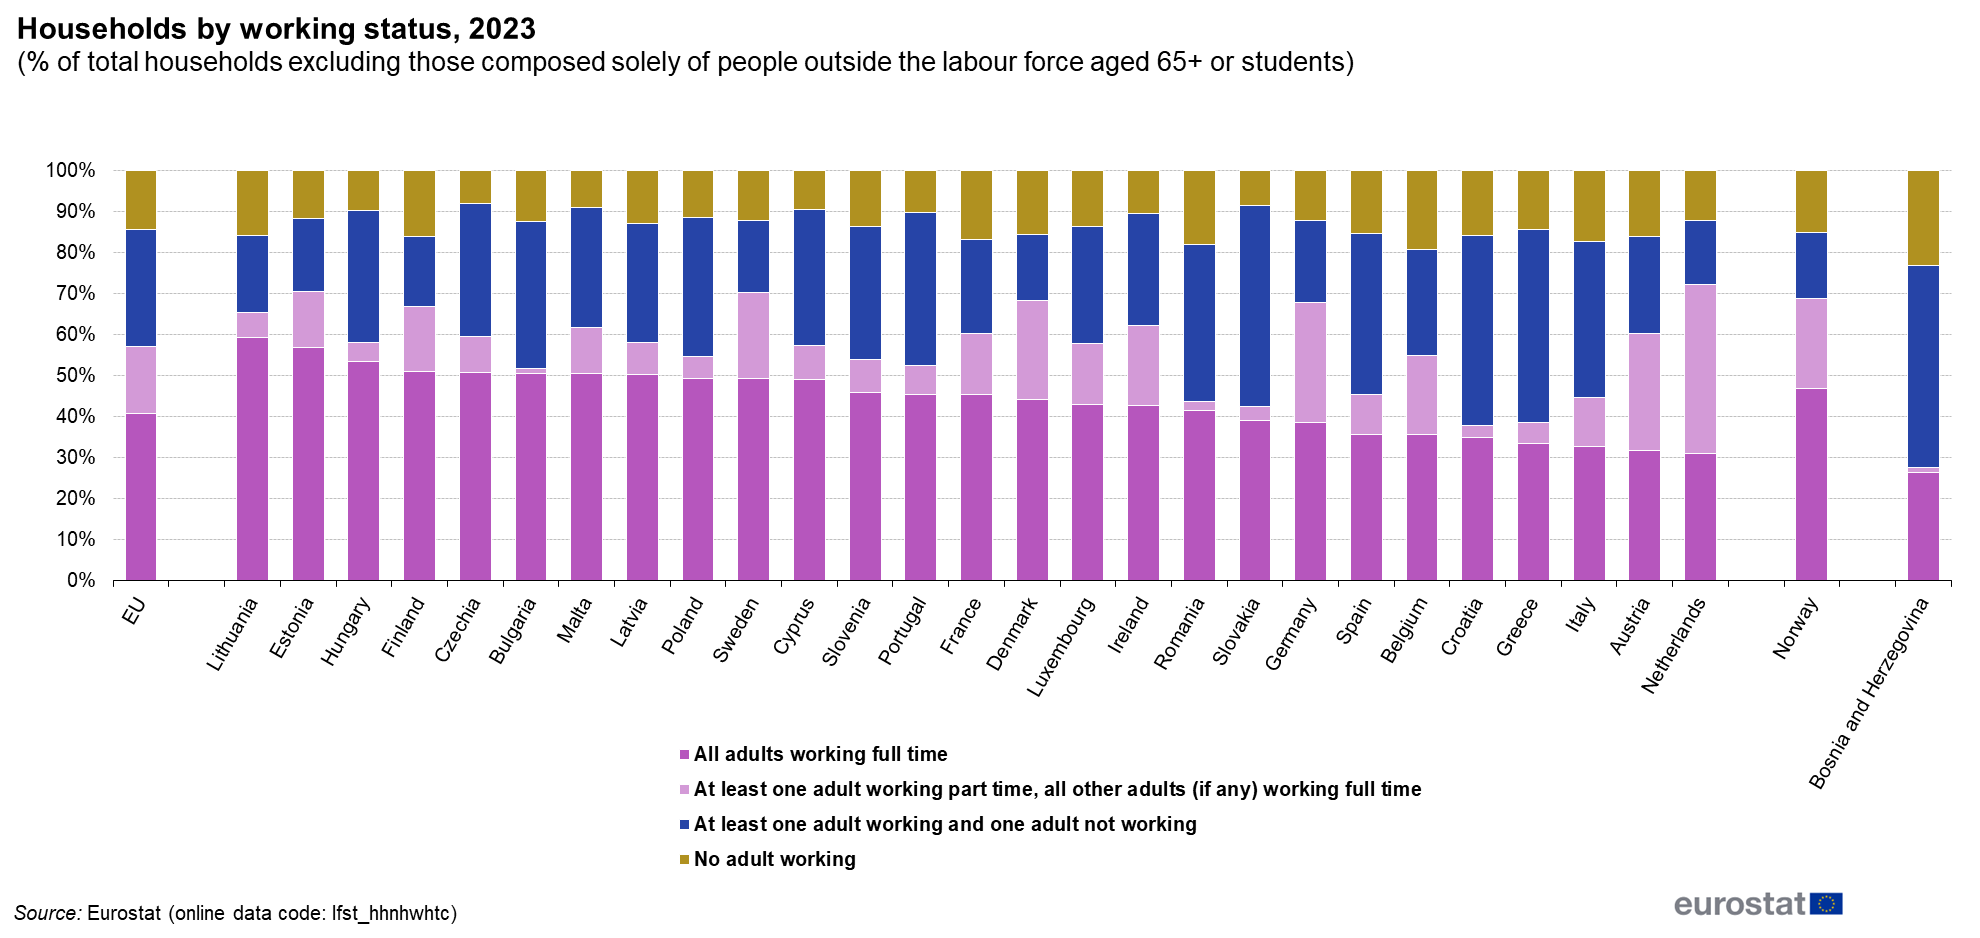
Households by working status, 2023 (% of total households excluding those composed solely of people outside the labour force aged 65+ or students).png
(
file
)
124 KB
Sostkaj
1
13:47, 8 May 2024
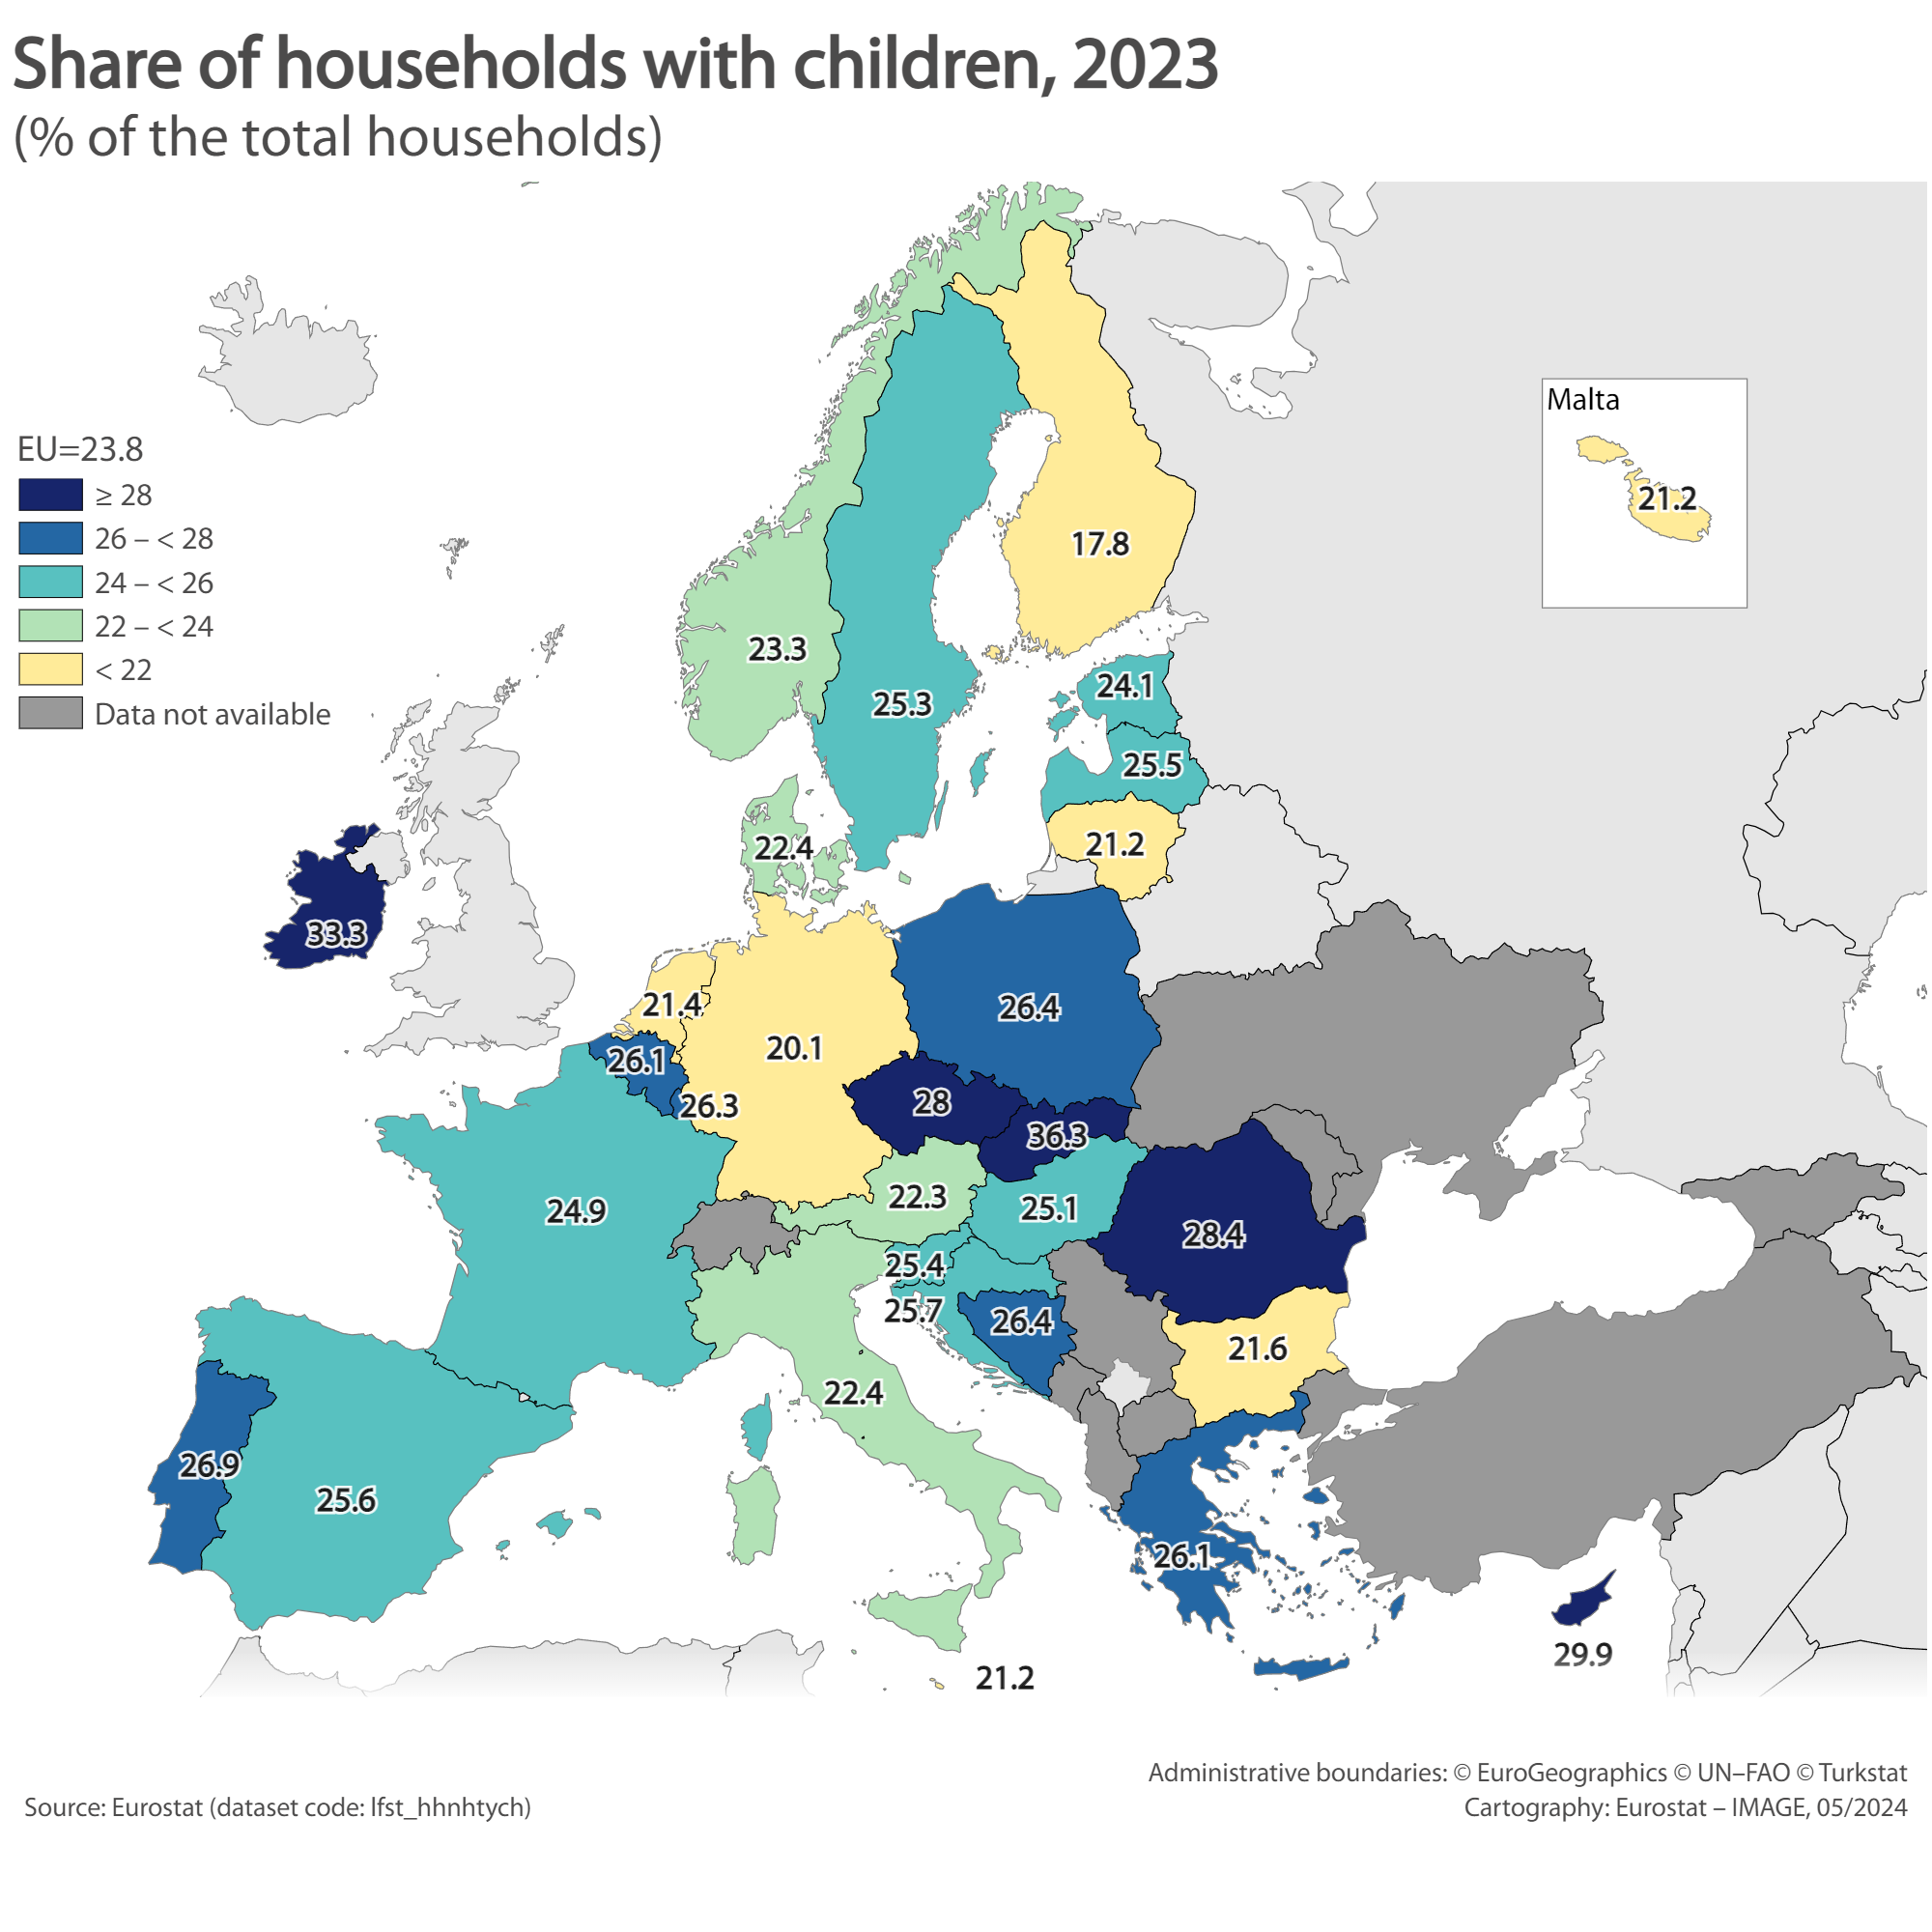
Share of households with children, 2023 (map).png
(
file
)
655 KB
Sostkaj
1
13:44, 8 May 2024
Households with children by number of children, 2023 (% of total households).png
(
file
)
84 KB
Sostkaj
1
13:37, 8 May 2024
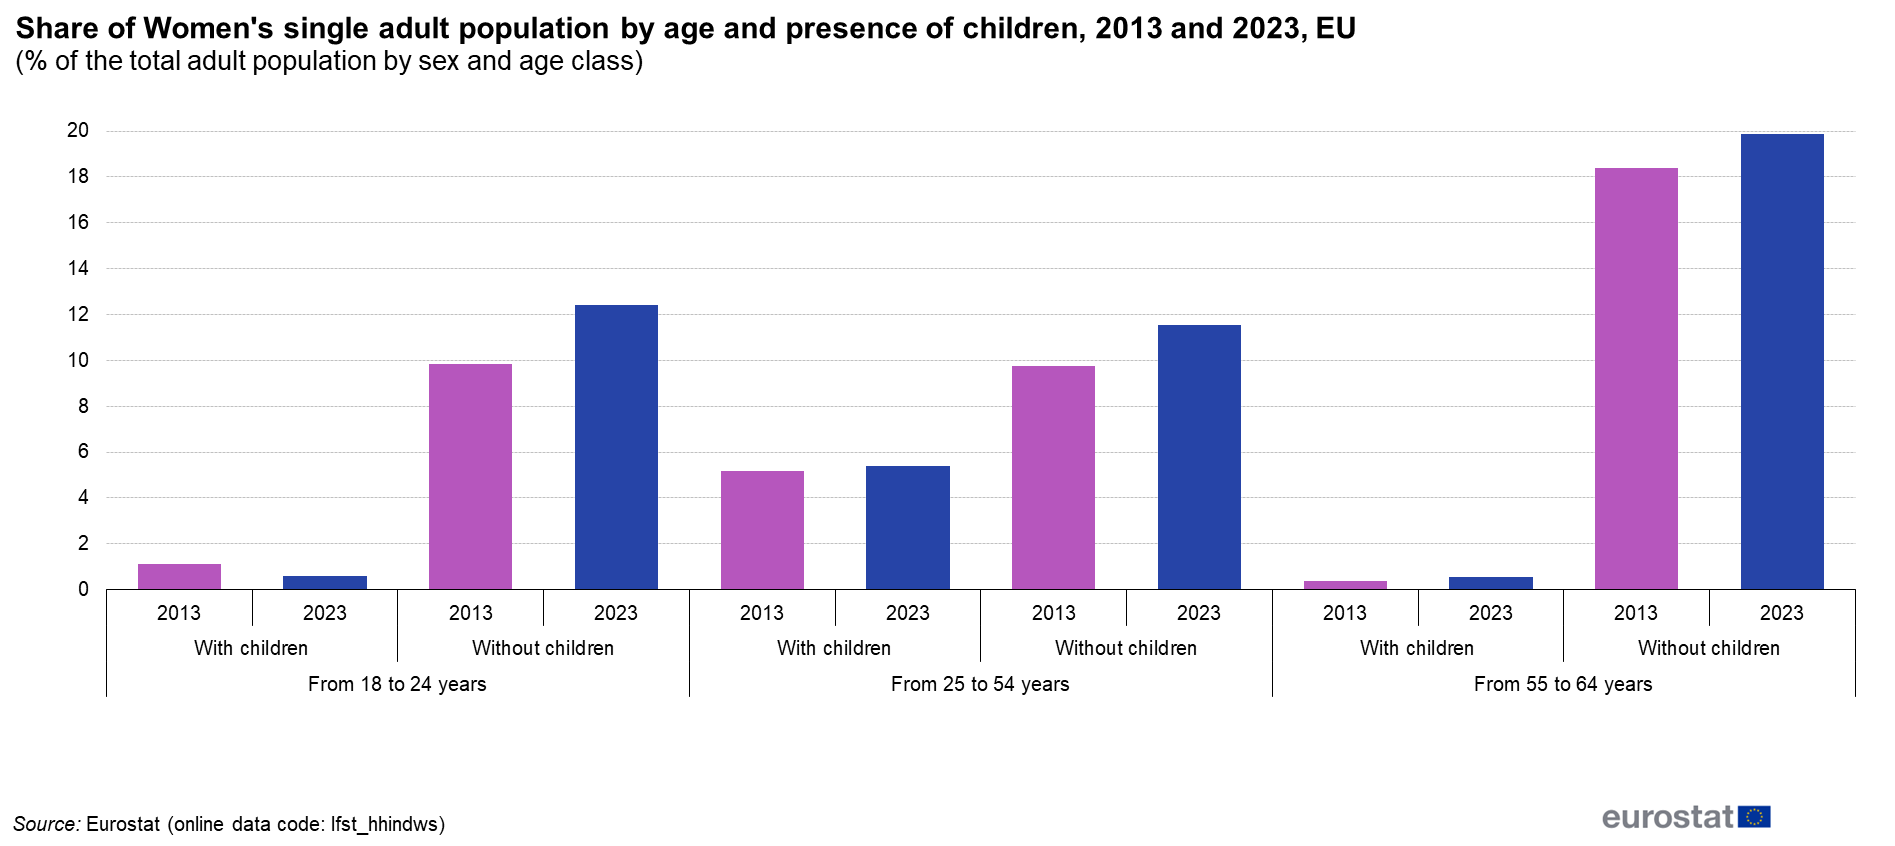
Share of Women's single adult population by age and presence of children, 2013 and 2023, EU (% of the total adult population by sex and age class).png
(
file
)
53 KB
Sostkaj
1
13:33, 8 May 2024
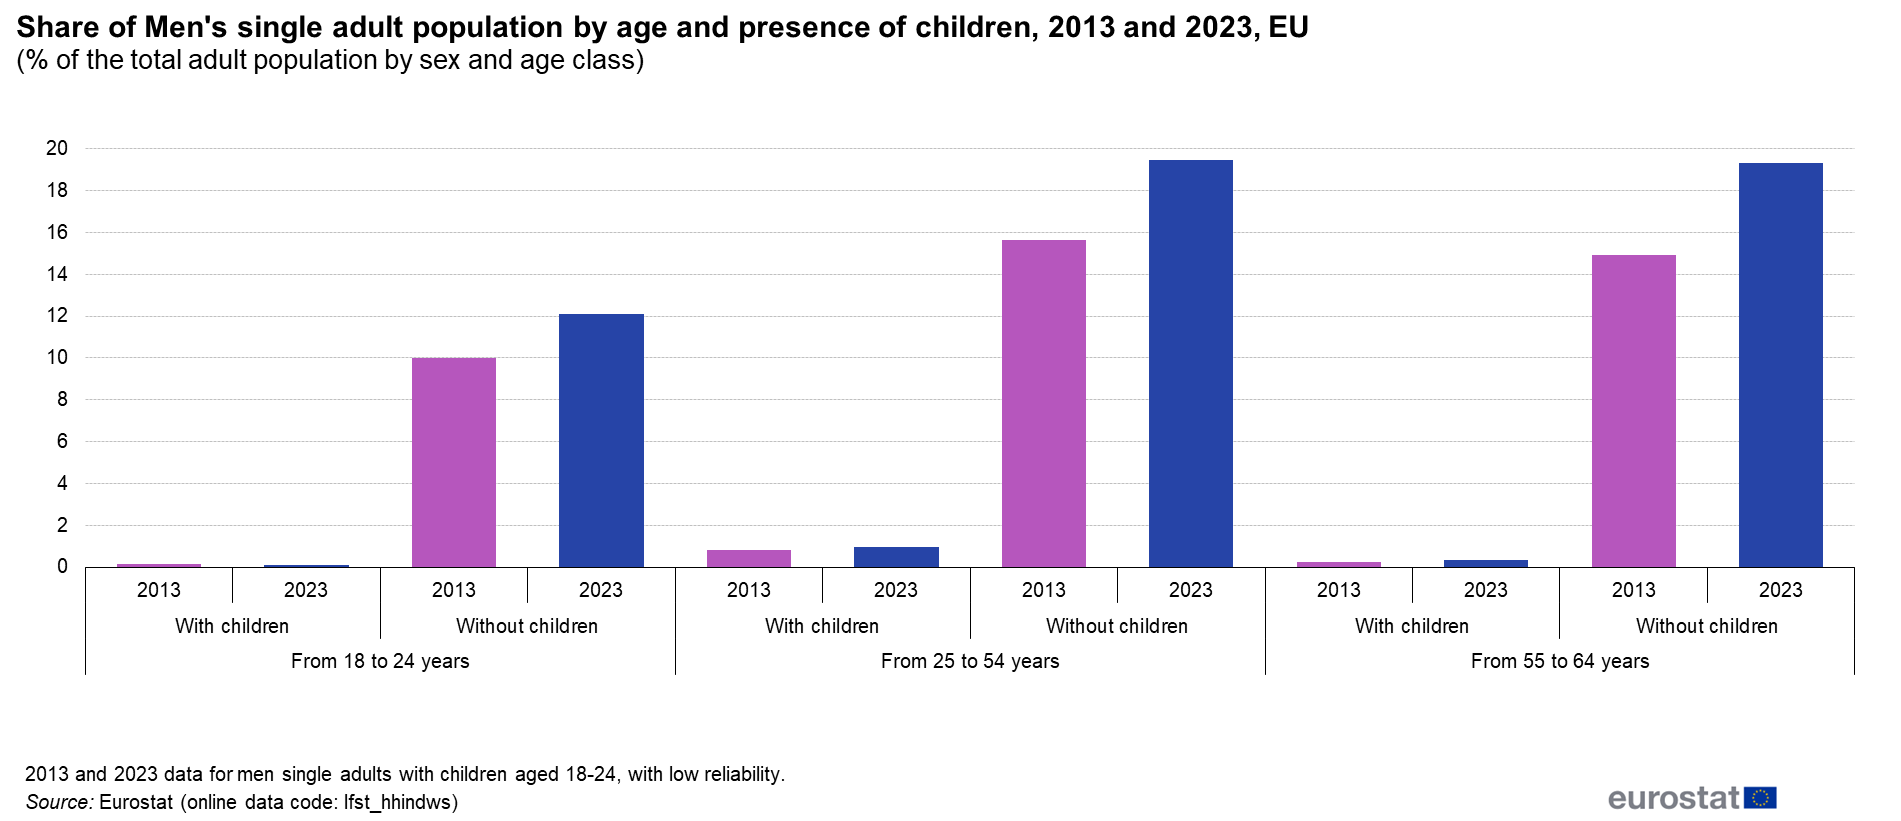
Share of Men's single adult population by age and presence of children, 2013 and 2023, EU (% of the total adult population by sex and age class).png
(
file
)
55 KB
Sostkaj
1
13:28, 8 May 2024
Households by type and presence of children, 2013-2023, EU (in millions).png
(
file
)
71 KB
Sostkaj
1
11:49, 8 May 2024
SE data file0805.xlsx
(
file
)
477 KB
Cookced
2
11:44, 8 May 2024
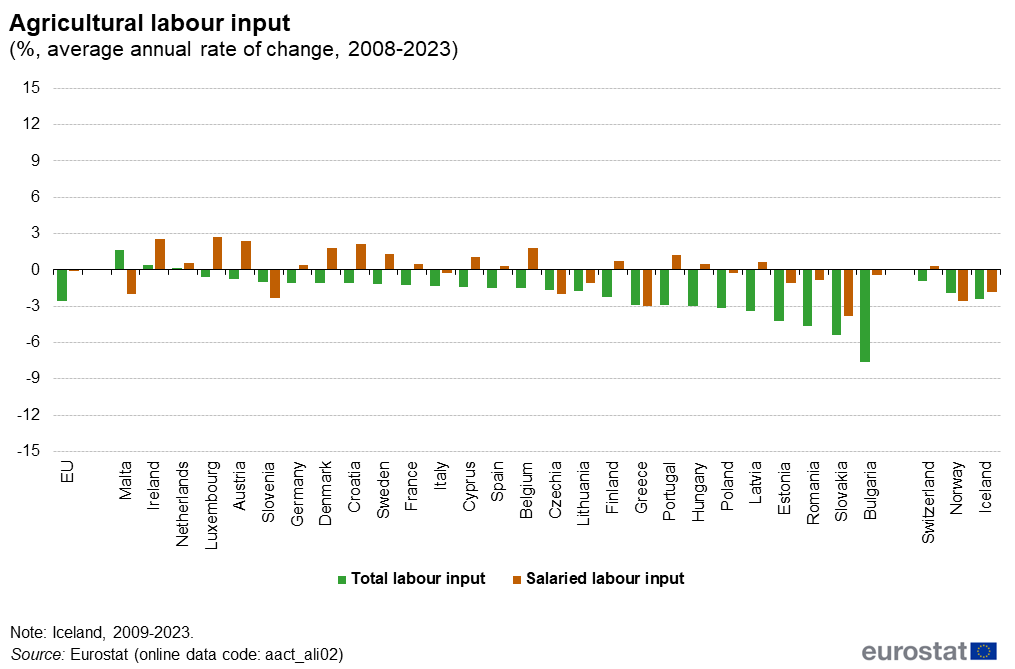
F5r Agricultural labour input (%, average annual rate of change, 2008-2023).png
(
file
)
33 KB
Cookced
1
11:43, 8 May 2024
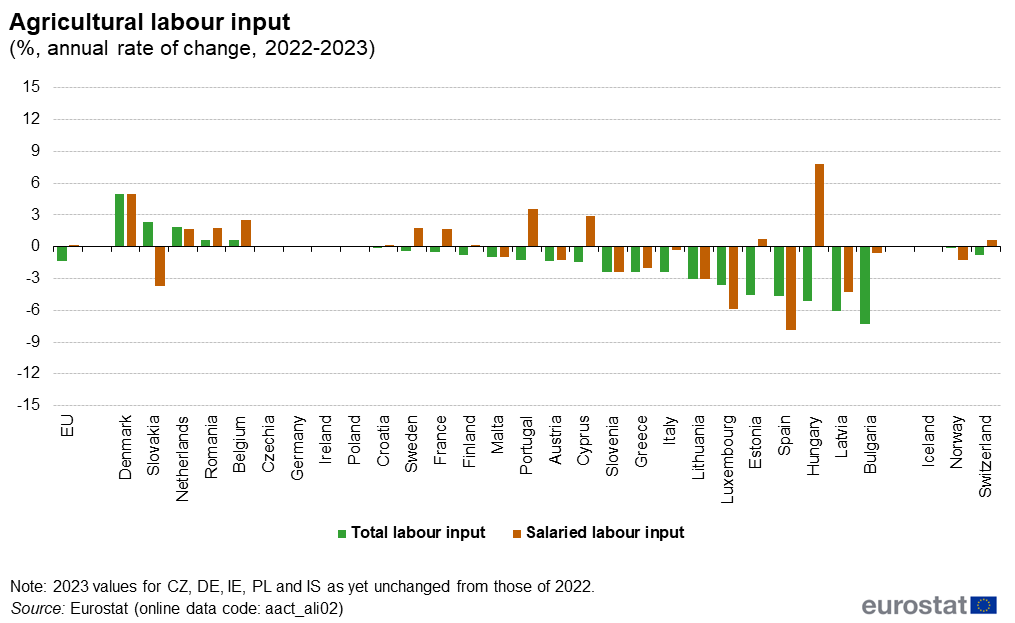
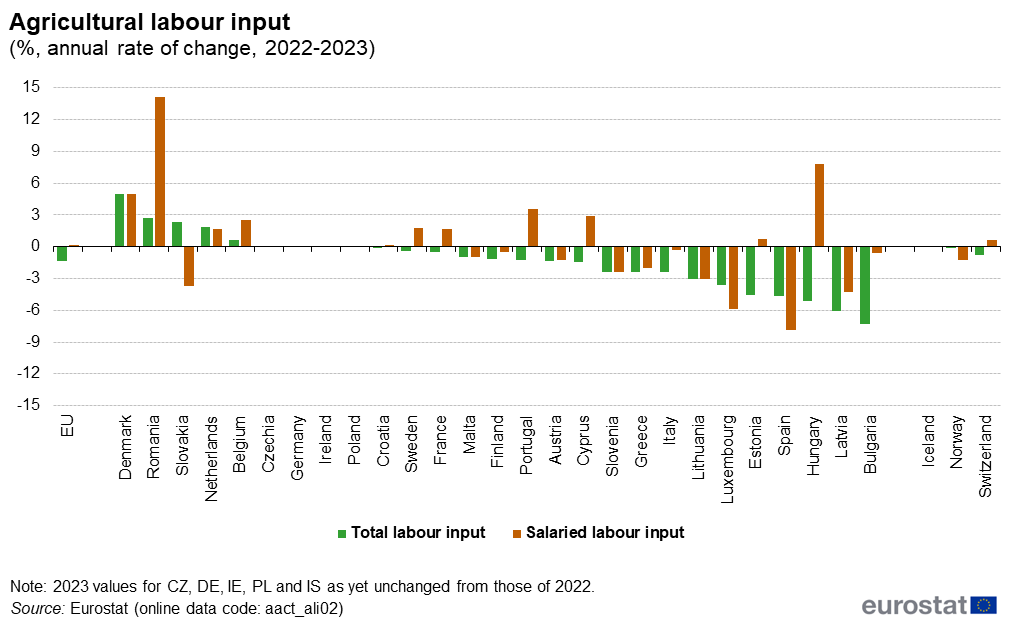
F4r Agricultural labour input (%, annual rate of change, 2022-2023).png
(
file
)
34 KB
Cookced
1
11:37, 8 May 2024
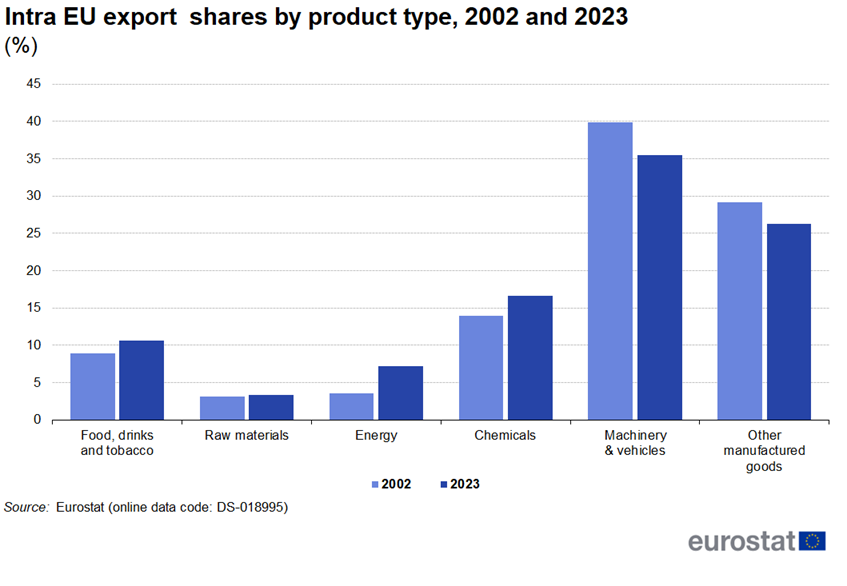
Share of intra EU trade in goods by product type, 2002 - 2023.png
(
file
)
191 KB
Roodhan
null
1
11:37, 8 May 2024
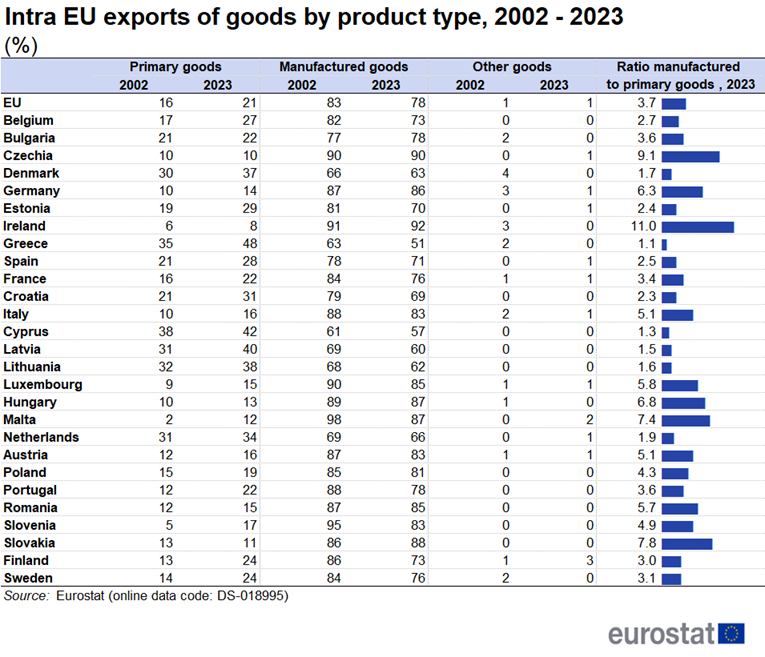
Intra EU exports of goods by product type, 2002 and 2023.png
(
file
)
65 KB
Roodhan
null
1
11:37, 8 May 2024
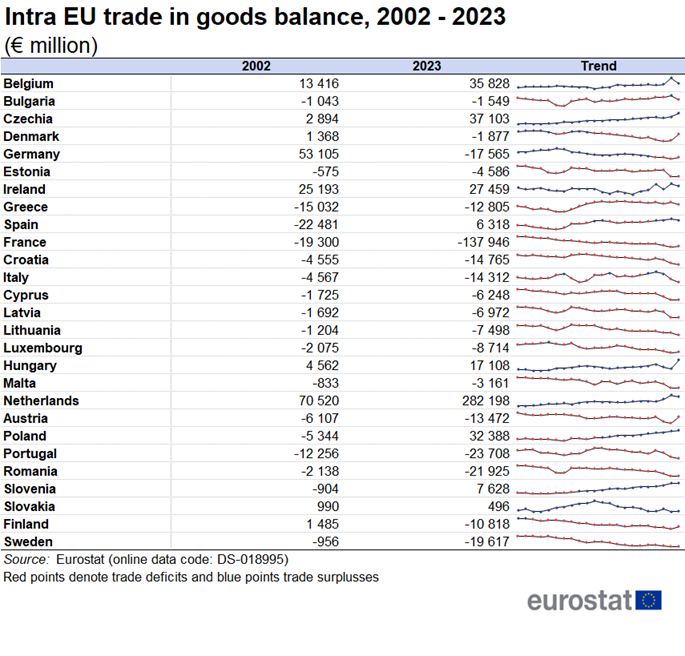
Intra EU trade in goods balance, 2002 - 2023.png
(
file
)
185 KB
Roodhan
null
1
11:37, 8 May 2024
Exports of goods intra EU and extra EU, 2023.png
(
file
)
85 KB
Roodhan
null
1
11:37, 8 May 2024
Exports of goods intra EU and extra EU, 2002 - 2023.png
(
file
)
155 KB
Roodhan
null
1
11:37, 8 May 2024
EU goods total exports divided by imports, 2002-2023.png
(
file
)
158 KB
Roodhan
null
1
11:37, 8 May 2024
Main EU partners for exports of goods by Member State, 2023.png
(
file
)
160 KB
Roodhan
null
1
11:37, 8 May 2024
Intra EU goods exports divided by imports, 2002-2023.png
(
file
)
148 KB
Roodhan
null
1
11:37, 8 May 2024
Extra EU goods exports divided by imports, 2002-2023.png
(
file
)
149 KB
Roodhan
null
1
11:37, 8 May 2024
Exports of goods to other Member States, 2023.png
(
file
)
93 KB
Roodhan
null
1
11:37, 8 May 2024
Intra EU exports of goods, January 2002 - December 2023.png
(
file
)
112 KB
Roodhan
null
1
11:37, 8 May 2024
Exports of goods to other Member States - details, 2023.png
(
file
)
56 KB
Roodhan
null
1
11:37, 8 May 2024
Exports of goods to other Member States, 2002 and 2023.png
(
file
)
147 KB
Roodhan
null
1
10:46, 8 May 2024
Quarterly GHG Figures for Q4 2023 SE article May2024.xlsx
(
file
)
371 KB
Horvaju
1
09:59, 8 May 2024
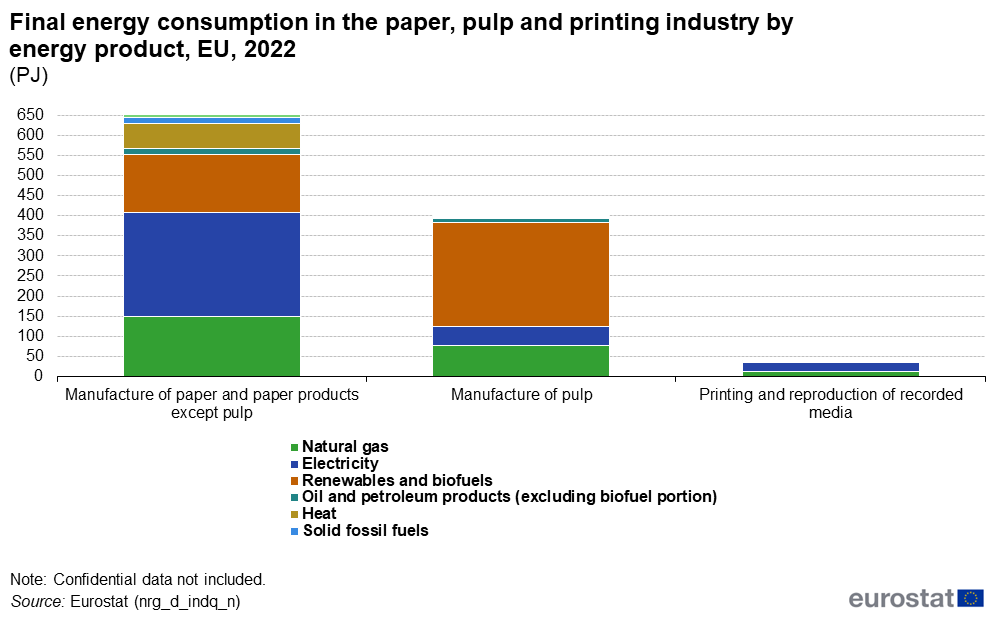
Final energy consumption in the paper, pulp and printing industry by energy product, EU, 2022 (PJ) v4.png
(
file
)
32 KB
Gnjatte
1
09:57, 8 May 2024
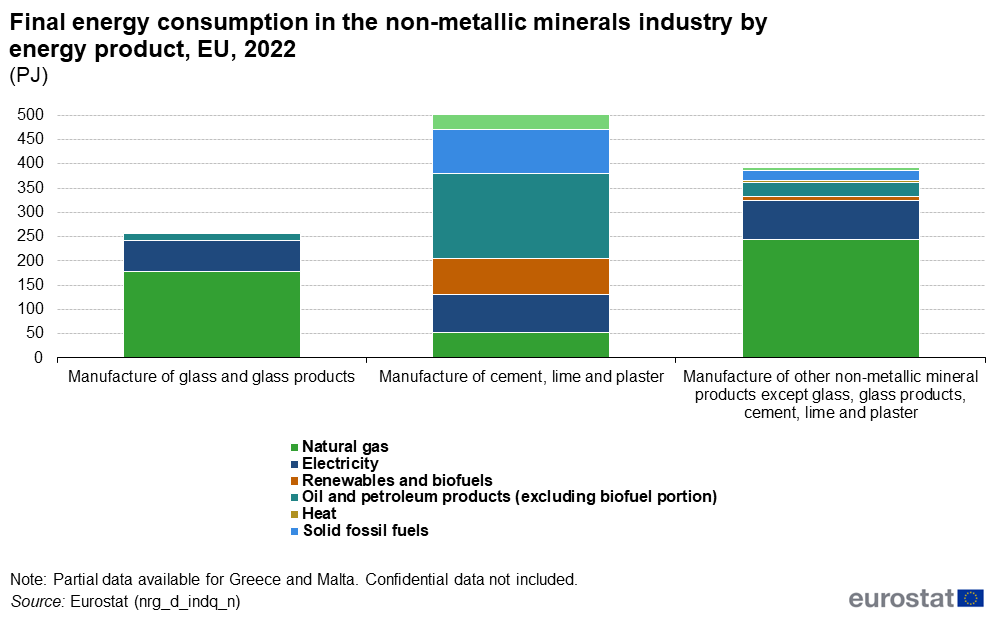
Final energy consumption in the non-metallic minerals industry by energy product, EU, 2022 (PJ) v4.png
(
file
)
35 KB
Gnjatte
1
09:50, 8 May 2024
F2Growth rates of greenhouse gas emissions by the economy, EU, Q4 2023.png
(
file
)
32 KB
Horvaju
1
09:48, 8 May 2024
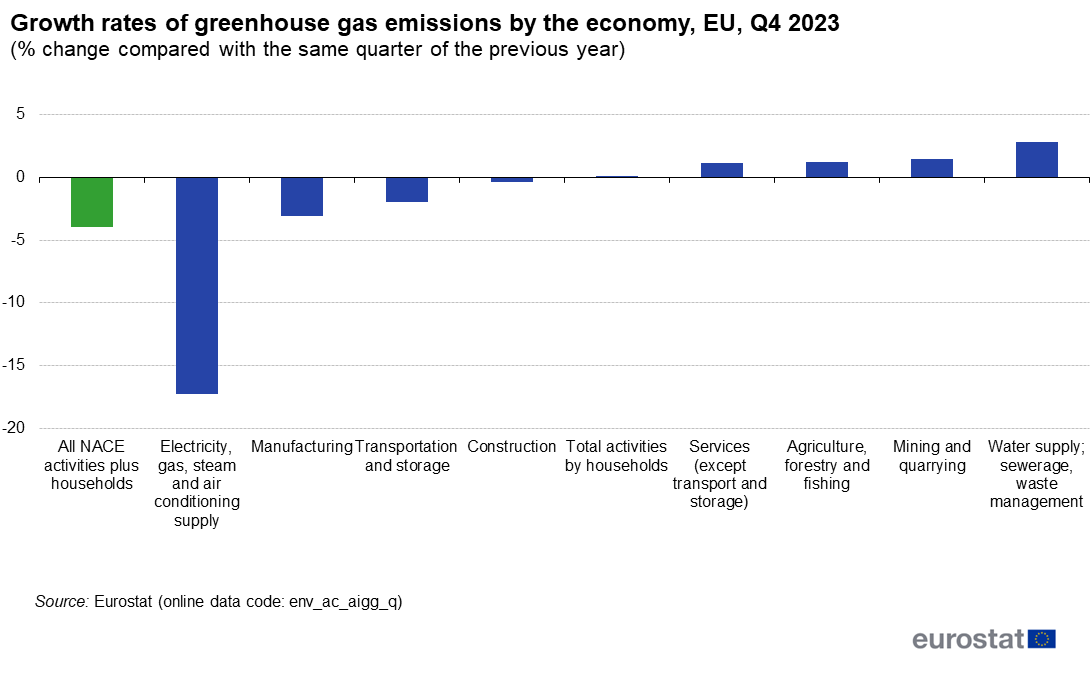
Growth rates of greenhouse gas emissions by the economy, EU, Q4 2023.png
(
file
)
32 KB
Horvaju
1
09:46, 8 May 2024
F3Growth rates of greenhouse gas emissions by the economy and GDP, Q4 2023.png
(
file
)
52 KB
Horvaju
1
09:38, 8 May 2024
F2Growth rates of greenhouse gas emissions by economic sector (% change compared with the same quarter of the previous year, EU, Q4 2023).png
(
file
)
32 KB
Horvaju
1
09:33, 8 May 2024
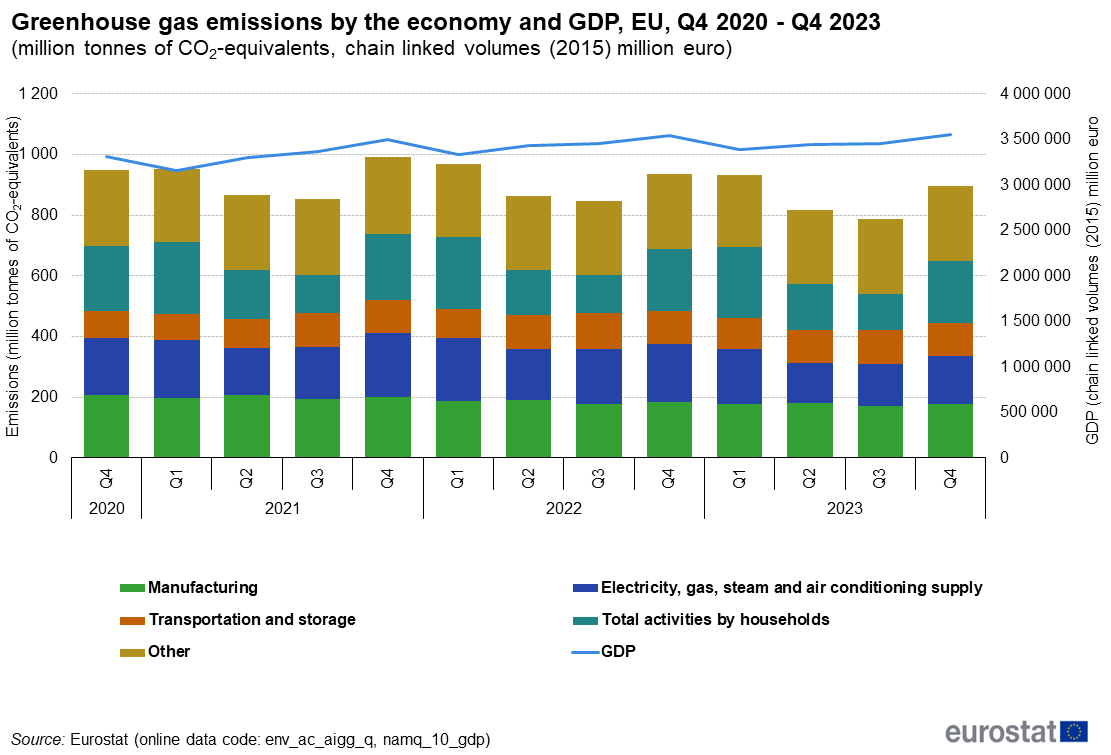
F1Greenhouse gas emissions by the economy and GDP, EU, 2020Q4 - 2023Q4.png
(
file
)
55 KB
Horvaju
1
17:58, 7 May 2024
STS Industrial import prices May 2024 07-05-2024.xlsx
(
file
)
69 KB
Rosswen
1
17:56, 7 May 2024
EA-20, Total industrial import price index for energy 2021 - 2024, unadjusted data (2021=100) 07-05-2024.png
(
file
)
84 KB
Rosswen
null
1
17:54, 7 May 2024
EA-20, Industrial import price index per product, annual rates of change, unadjusted data, 2015-2023 07-05-2024.png
(
file
)
538 KB
Rosswen
null
1
17:54, 7 May 2024
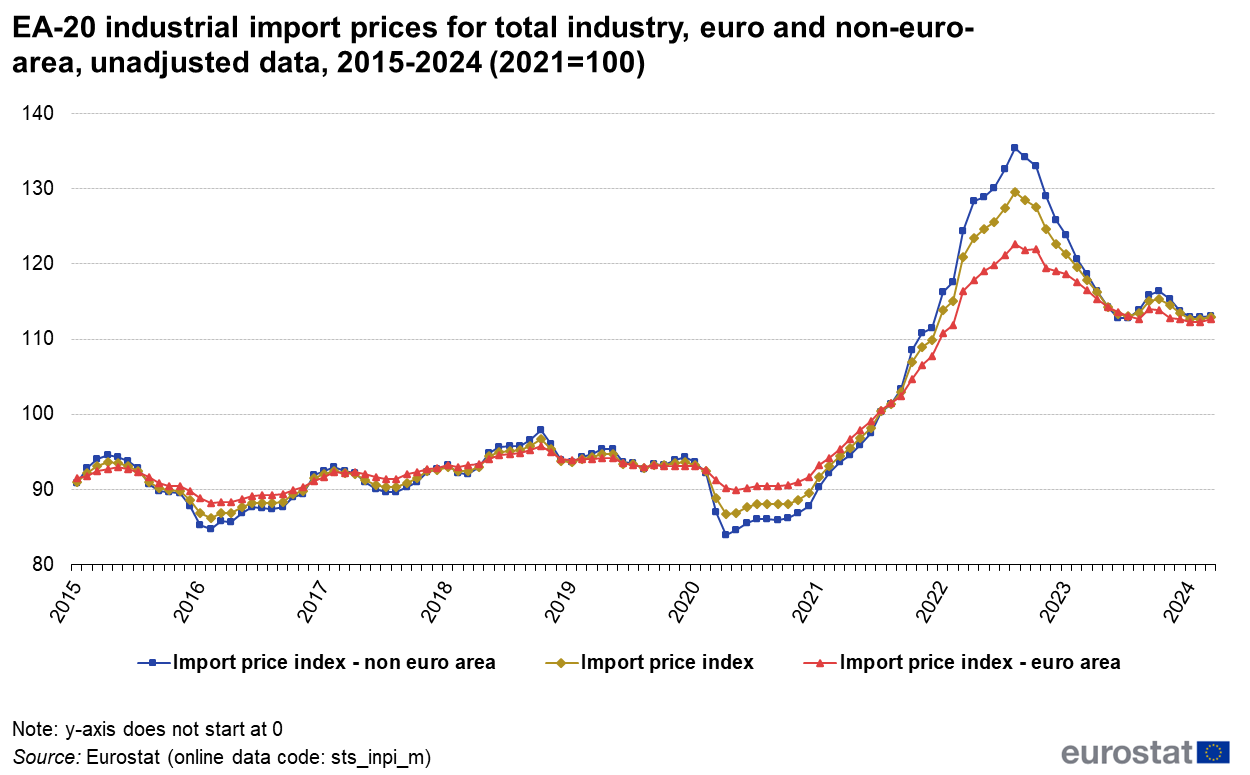
EA-20 industrial import prices for total industry, euro and non-euro-area, unadjusted data, 2015-2024 (2021=100) 07-05-2024.png
(
file
)
69 KB
Rosswen
null
1
17:54, 7 May 2024
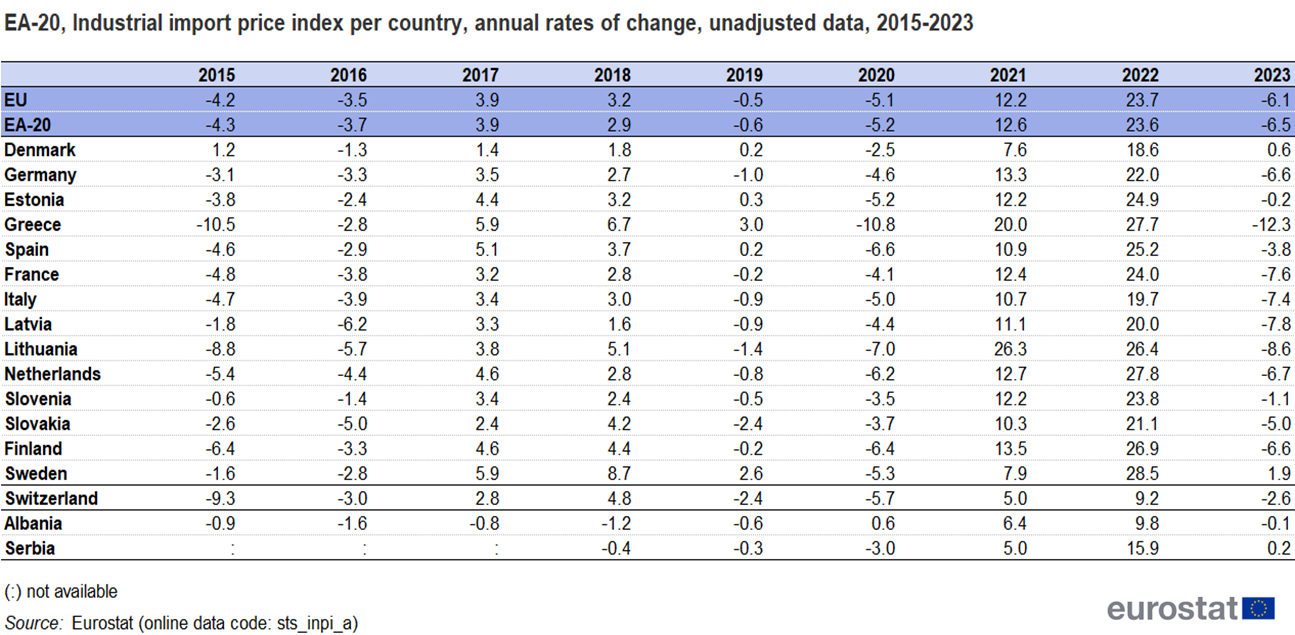
EA-20, Industrial import price index per country, annual rates of change, unadjusted data, 2015-2023 07-05-2024.png
(
file
)
275 KB
Rosswen
null
1
17:54, 7 May 2024
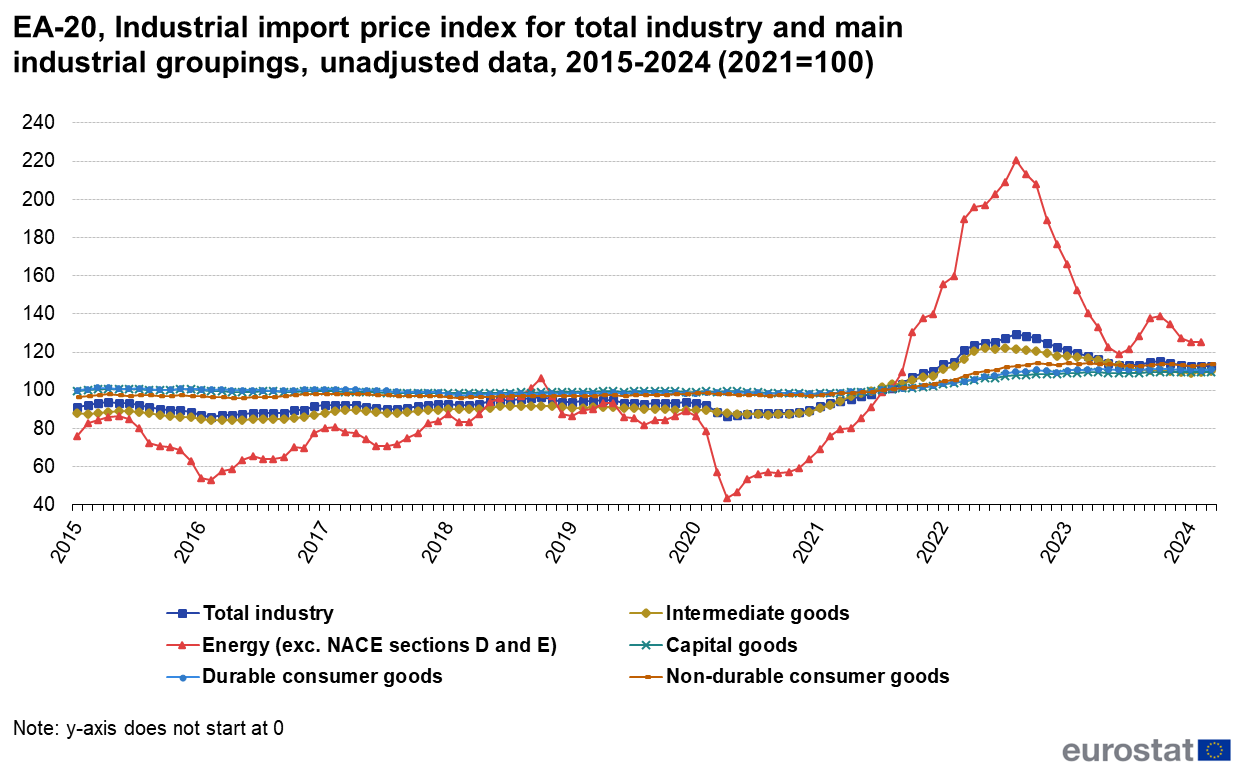
EA-20, Industrial import price index for total industry and main industrial groupings, unadjusted data, 2015-2024 (2021=100) 07-05-2024.png
(
file
)
76 KB
Rosswen
null
1
17:12, 7 May 2024
SE data file.xlsx
(
file
)
477 KB
Cookced
1
17:11, 7 May 2024
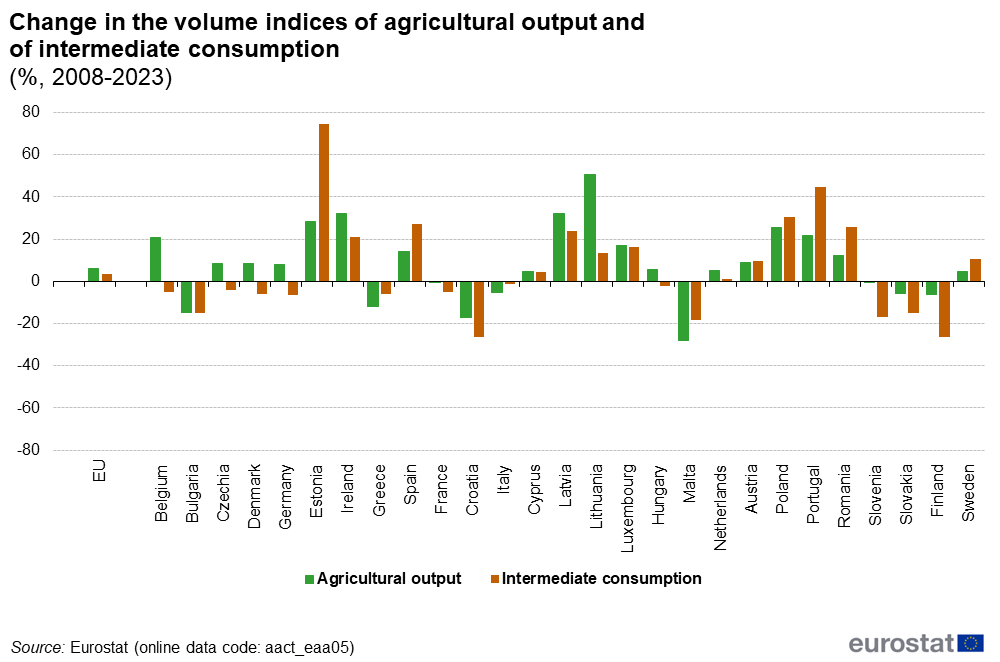
F9 Change in the volume indices of agricultural output and .png
(
file
)
36 KB
Cookced
1
17:10, 7 May 2024
F8 Volume indices of agricultural output and .png
(
file
)
38 KB
Cookced
1
17:09, 7 May 2024
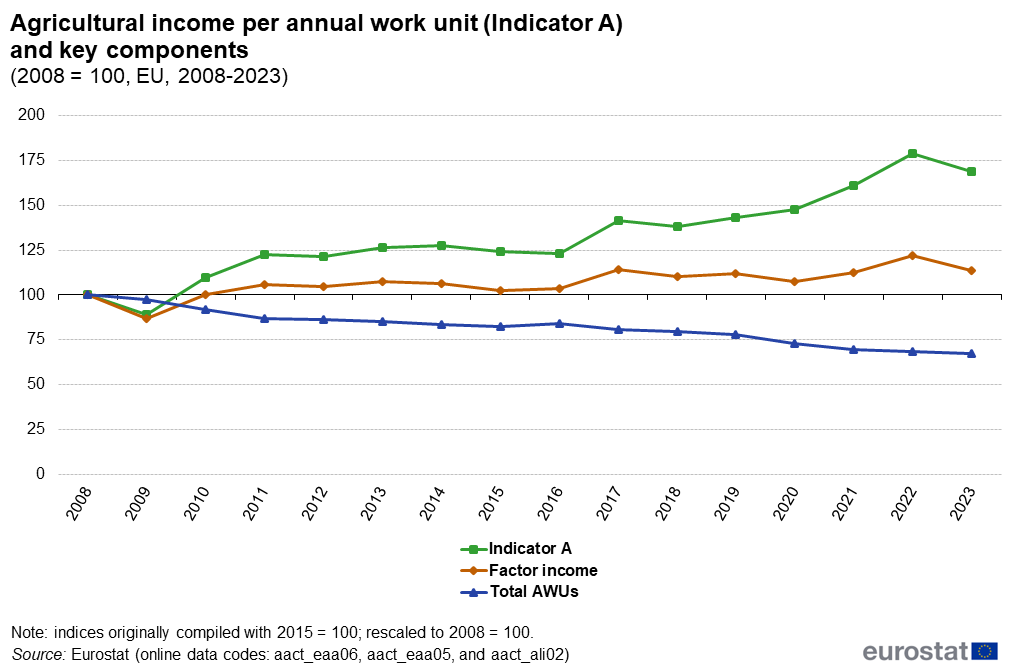
F7 Agricultural income per annual work unit (Indicator A) .png
(
file
)
43 KB
Cookced
3
17:09, 7 May 2024
F5 Agricultural labour input (%, average annual rate of change, 2008-2023).png
(
file
)
33 KB
Cookced
1
16:57, 7 May 2024
F4 Agricultural labour input (%, annual rate of change, 2022-2023).png
(
file
)
35 KB
Cookced
1
First page
Previous page
Next page
Last page
Special page
ISSN 2443-8219


_Health2024.png)
_Health2024.png)
.png)
.png)
.png)
.png)
.png)
.png)
.png)
.png)
.png)


_v4.png)
_v4.png)


.png)

_07-05-2024.png)

_07-05-2024.png)

_07-05-2024.png)


_.png)
.png)
.png)