Tutorials
Log in
Statistics Explained
menu
search
search
Navigation
Main page
Statistical themes
Glossary
Categories
Statistics 4 beginners
Tutorials
Help
Eurostat home
Education corner
Online publications
Regional yearbook
Sustainable development
Full list
Tools
User contributions
Logs
View user groups
Special pages
search
Navigation
Main page
Statistical themes
Glossary
Categories
Statistics 4 beginners
Tutorials
Help
Eurostat home
Education corner
Online publications
Regional yearbook
Sustainable development
Full list
Tools
User contributions
Logs
View user groups
Special pages
Navigation
Main page
Statistical themes
Glossary
Categories
Statistics 4 beginners
Tutorials
Help
Eurostat home
Education corner
Online publications
Regional yearbook
Sustainable development
Full list
Tools
User contributions
Logs
View user groups
Special pages
Uploads by Ganeada
This special page shows all uploaded files.
File list
Items per page:
20
50
100
250
500
Search for media name:
Username:
Include old versions of files
Go
First page
Previous page
Next page
Last page
Date
Name
Thumbnail
Size
Description
Versions
11:49, 6 May 2024
Pop density, 2012 and 2022.xlsx
(
file
)
14 KB
null
1
11:49, 6 May 2024
InteractiveChart Population density, 2012 and 2022.xlsx
(
file
)
14 KB
null
3
11:58, 17 April 2024
ENPE24 Population by sex, 2012-2022 (persons).png
(
file
)
48 KB
null
2
11:41, 17 April 2024
ENPE24 Population by age class, 2022 (% of total population) up.png
(
file
)
24 KB
null
1
11:41, 17 April 2024
ENPE24 Population 2024-04 up.xlsx
(
file
)
61 KB
null
1
13:00, 28 March 2024
ENPE24 Population 2024-02 .xlsx
(
file
)
61 KB
null
1
12:38, 28 March 2024
ENPE24 Population by sex, 2012-2022 (persons) .png
(
file
)
47 KB
null
1
15:22, 15 March 2024
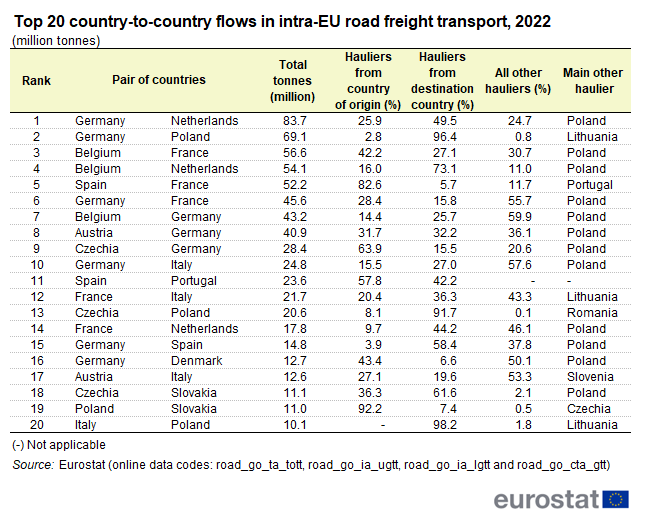
Top 20 country-to-country flows in intra-EU road freight transport, 2022 (million tonnes) up.png
(
file
)
38 KB
null
1
15:22, 15 March 2024
SE Road Trends 2023 up.xlsx
(
file
)
112 KB
null
1
10:04, 25 April 2023
ENPS23 Real GDP growth 2011-2022.xlsx
(
file
)
14 KB
null
2
11:59, 24 April 2023
ENPE23 Population by sex, 2021 (% of total population) .png
(
file
)
32 KB
null
1
11:59, 24 April 2023
ENPE23 Population 2023-03 .xlsx
(
file
)
88 KB
null
1
09:19, 24 April 2023
ENPS23 Education 2023-03 .xlsx
(
file
)
89 KB
1
09:18, 24 April 2023
ENPS23 Net enrolment rates by gender and education level, 2011, 2020 and 2021 (%) .png
(
file
)
99 KB
1
14:18, 21 April 2023
ENPS23 International trade 2023-04 .xlsx
(
file
)
151 KB
null
1
10:42, 19 April 2023
ENPS23 Under-5 mortality rate 2011 and 2021.xlsx
(
file
)
15 KB
null
4
14:44, 18 April 2023
ENPS23 Trade of food and live animals, 2011-2021 (€ million) .png
(
file
)
57 KB
null
1
14:44, 18 April 2023
ENPS23 Slaughtered animal production, 2011, 2020 and 2021 (thousand tonnes) .png
(
file
)
35 KB
null
1
14:44, 18 April 2023
ENPS23 Livestock population, December 2011, 2020 and 2021 (thousand heads) .png
(
file
)
33 KB
null
1
14:44, 18 April 2023
ENPS23 Harvested crop production, 2011, 2020 and 2021 (thousand tonnes) .png
(
file
)
43 KB
null
1
14:44, 18 April 2023
ENPS23 Agriculture 2023-04 .xlsx
(
file
)
125 KB
null
1
09:50, 18 April 2023
ENPS23 Tourism 2023-03 .xlsx
(
file
)
73 KB
null
1
09:35, 18 April 2023
ENPS23 Arrivals of non-residents staying in hotels and similar accommodation establishments, 2011-2021 (thousands) .png
(
file
)
32 KB
null
1
09:35, 18 April 2023
ENPS23 Departures of residents going abroad for all holidays and business, 2011-2021 (thousands of trips) .png
(
file
)
29 KB
null
1
09:27, 18 April 2023
ENPS23 Bed places in hotels and similar accommodation establishments, 2011-2021 (thousands) .png
(
file
)
35 KB
null
1
16:43, 30 March 2023
ENPS23 Energy and environment 2023-03.xlsx
(
file
)
167 KB
null
1
16:42, 30 March 2023
ENPS23 Total freshwater abstraction (fresh surface and groundwater), 2010 and 2020 (cubic metres per inhabitant).png
(
file
)
42 KB
null
1
16:42, 30 March 2023
ENPS23 Structure of final energy consumption, by sector, 2011, 2020 and 2021 (% of total energy consumption).png
(
file
)
52 KB
null
1
16:42, 30 March 2023
ENPS23 Primary production of energy, by product, 2021 (% of total).png
(
file
)
48 KB
null
1
16:42, 30 March 2023
ENPS23 Primary energy production, 2011-2021 (toe per inhabitant).png
(
file
)
53 KB
null
1
16:42, 30 March 2023
ENPS23 Gross electricity production from renewable and other energy sources, 2021 (in TWh).png
(
file
)
41 KB
null
1
16:42, 30 March 2023
ENPS23 Greenhouse gas emissions, 2011 and 2020 (tonnes of CO2 equivalents per person).png
(
file
)
32 KB
null
1
16:42, 30 March 2023
ENPS23 Municipal waste generated, 2010 and 2020 (kg per inhabitant).png
(
file
)
46 KB
null
1
16:42, 30 March 2023
ENPS23 Primary energy production, 2011, 2020 and 2021.png
(
file
)
30 KB
null
1
16:42, 30 March 2023
ENPS23 Net imports, 2011, 2020 and 2021.png
(
file
)
30 KB
null
1
16:42, 30 March 2023
ENPS23 Gross inland energy consumption, 2011-2021 (toe per inhabitant).png
(
file
)
51 KB
null
1
16:42, 30 March 2023
ENPS23 Greenhouse gas emissions, 2011 and 2020 (thousand tonnes of CO2 equivalents).png
(
file
)
34 KB
null
1
16:42, 30 March 2023
ENPS23 Energy dependency, 2021 (% of net imports in gross available energy, based on toe).png
(
file
)
35 KB
null
1
13:36, 3 November 2022
Road freight transport by type of cargo, 2021 (million tkm) .png
(
file
)
64 KB
null
1
13:35, 3 November 2022
SE Types of goods 2022.xlsx
(
file
)
93 KB
null
3
13:15, 3 November 2022
Road freight transport by type of cargo, 2021 (million tkm).png
(
file
)
64 KB
null
2
13:13, 3 November 2022
Road freight transport of each group of goods (NST 2007) by type of operation, EU, 2021 (% share in tkm).png
(
file
)
62 KB
null
3
13:13, 3 November 2022
Road freight transport of dangerous goods by type of goods, EU, 2021 (% share in tkm).png
(
file
)
29 KB
null
2
15:27, 2 November 2022
Road freight transport of dangerous goods by type of operation, 2021 (% share in tkm).png
(
file
)
43 KB
null
1
15:27, 2 November 2022
Road freight transport of dangerous goods, 2017-2021 (million tkm).png
(
file
)
49 KB
null
1
15:27, 2 November 2022
Road freight transport of dangerous goods, 2020 and 2021 (% share in tkm).png
(
file
)
49 KB
null
1
15:27, 2 November 2022
Road freight transport by group of goods (NST 2007), EU, 2021 (% share in tonnes and tkm).png
(
file
)
55 KB
null
1
15:27, 2 November 2022
Road freight transport by group of goods, EU, 2017-2021 (billion tkm).png
(
file
)
71 KB
null
1
15:27, 2 November 2022
Road freight transport by group of goods, EU, 2017-2021 (million tonnes).png
(
file
)
74 KB
null
1
09:26, 24 October 2022
SE Journey charact 2022.xlsx
(
file
)
149 KB
null
2
First page
Previous page
Next page
Last page
Special page
ISSN 2443-8219
.png)
_up.png)
_.png)
_up.png)
_.png)
_.png)
_.png)
_.png)
_.png)
_.png)
_.png)
_.png)
_.png)
,_2010_and_2020_(cubic_metres_per_inhabitant).png)
.png)
.png)
.png)
.png)
.png)
.png)


.png)
.png)
.png)
_.png)
.png)
_by_type_of_operation,_EU,_2021_(%25_share_in_tkm).png)
.png)
.png)
.png)
.png)
,_EU,_2021_(%25_share_in_tonnes_and_tkm).png)
.png)
.png)