SDG 16 - Peace, justice and strong institutions
Promote peaceful and inclusive societies for sustainable development, provide access to justice for all and build effective, accountable and inclusive institutions at all levels
Data extracted in April 2023.
Planned article update: June 2024.
Highlights

This article is a part of a set of statistical articles, which are based on the Eurostat publication ’Sustainable development in the European Union — Monitoring report on progress towards the SDGs in an EU context — 2023 edition’. This report is the seventh edition of Eurostat’s series of monitoring reports on sustainable development, which provide a quantitative assessment of progress of the EU towards the SDGs in an EU context.
SDG 16 calls for peaceful and inclusive societies based on respect for human rights, protection of the most vulnerable, the rule of law and good governance at all levels. It also envisions transparent, effective and accountable institutions.
Full article
Peace, justice and strong institutions in the EU: overview and key trends
Peace and security are a prerequisite for sustainable development, in line with the integrated nature of the 2030 Agenda. Peace, security, democracy, the rule of law and respect for fundamental rights are also founding values of the EU. Monitoring SDG 16 in an EU context focuses on personal security, access to justice and trust in institutions within the EU. Over the past few years, the EU has become a safer and more just place to live, as deaths due to homicide or assault and perceived occurrence of crime, violence and vandalism have fallen considerably. Government expenditure on law courts has increased significantly and more than half of Europeans consider their justice system to be independent. The assessment of corruption in the EU has remained stable. However, challenges persist in some areas of access to justice and trust in the EU institutions has fluctuated over the past few years.
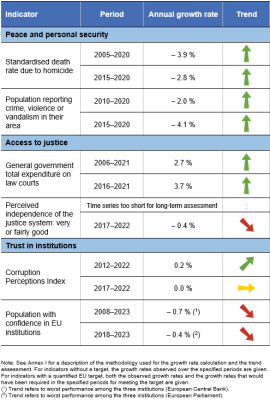
Table 1: Indicators measuring progress towards SDG 16, EU
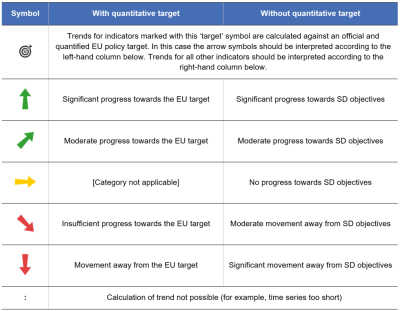
Table 2: Explanation of symbols for indicating progress towards SD objectives and targets


Peace and personal security
Safety is a crucial aspect of a person’s life. Insecurity is a common source of fear and worry, and negatively affects quality of life. Physical insecurity includes all the external factors that could potentially put an individual’s physical integrity in danger. Crime is one of the most obvious causes of insecurity. Analyses of physical insecurity usually combine two aspects: the subjective perception of insecurity and the objective lack of safety. Available time series on both objective and subjective measures of personal safety show a favourable trend in the EU over the past decade.
The EU has become a safer place to live
Homicide is one of the most serious crimes. In the EU, deaths due to homicide have fallen steadily since 2005, reaching a rate of 0.7 deaths per 100 000 people in 2020. This corresponds to a reduction of 45 % over the assessed 15-year period. In the short-term, however, the trend has stagnated, remaining at roughly the same level since 2016. The decrease in homicides in the EU has gone hand in hand with improvements in people’s perception of crime, violence or vandalism. Since 2010, the share of people reporting the occurrence of such problems in their area has generally fallen in the EU. In 2020, 10.7 % of the population felt affected by these issues, which is 2.4 percentage points less than in 2010 and the lowest value recorded.
The perception of being affected by crime, violence or vandalism differs across socio-demographic subgroups of the EU population and across degrees of urbanisation. While 13.7 % of the population living in households with an equivalised disposable income below the poverty threshold — set at 60 % of the national median equivalised income — felt affected by such problems in 2020, this was only the case for 10.2 % of the population living in households above the poverty threshold. Similarly, in 2020 the perceived occurrence of crime, violence or vandalism in cities (16.3 %) was almost three times higher than in rural areas (5.8 %) and almost twice as high as in towns and suburbs (8.4 %) [1].
The fear of victimisation paradox: when objective and subjective measures of physical insecurity do not match
National figures show that the perceived exposure to crime, violence or vandalism in 2020 was eight times higher in the most affected country (19.1 % of the population in Bulgaria) than in the least affected country (2.4 % in Croatia). However, country differences in this subjective indicator need to be treated with caution. Research suggests that crime rates from police registers and the subjective exposure to crime may differ, as population groups with low victimisation rates may be particularly afraid of crime (the so-called ‘fear of victimisation paradox’) [2]. This is, for instance, the case in Ireland, which has the lowest death rate due to homicide across the EU, but one of the highest shares of people who say they feel affected by crime or other problems in their area (see Figures 2 and 4). In contrast, death rates due to homicide were the highest in the Baltic countries, which had rather low shares of people feeling affected by crime, violence or vandalism in their neighbourhood. It should, however, be acknowledged that this comparison may not capture the full picture, as other forms of crime than homicide also contribute to perceived insecurity.
Men are more likely to die from homicide, while women are more likely to be victims of violence in their homes and sexual assaults
Deaths due to homicide in the EU show a remarkable gender gap. While death rates due to homicide have fallen for both sexes, they remain about twice as high for men (0.9 deaths per 100 000 persons in 2020, compared with 0.4 deaths per 100 000 persons for women). However, while men have a higher overall risk of being killed, women have a significantly higher risk of being killed by their intimate partners or family members.
A study by the United Nations Office on Drugs and Crime (UNODC) and UN Women shows that intimate partner- or family-related homicides accounted for 56 % of women who were killed in 2021 globally, while this was only the case for 11 % of male homicides. Overall in Europe, according to an earlier UNODC report, almost a quarter (24 %) of homicides in 2017 (compared with 18 % globally) were at the hands of an intimate partner or were family-related [3]. In 2021, 51 % of all femicides were partner- or family-related. Despite an overall decrease in female intimate partner and family-related homicides in Europe since 2010, the number increased in the first pandemic year (2020) in some parts of Europe, specifically in western Europe [4]. This is an issue of concern, given that women are at a much higher risk of being killed by their partners or family members (globally, 64 % of victims of intimate partner/family‐related homicide were women), and especially when considering the broader concept of violence against women, encompassing all forms of physical, sexual and psychological violence.
Data from Eurostat’s official crime statistics on intentional homicide and sexual offences show that women are much more likely to be a victim of such crimes than men. In 2020, 49 out of 100 000 women were victims of sexual assault, and 28 out of 100 000 women were victims of rape. The rates were significantly lower for men, with 9 out of 100 000 experiencing sexual assault and 3 out of 100 000 having been victims of rape [5]. Moreover, women are about twice as likely as men to be a victim of intentional homicide by family and relatives or their intimate partner. In 2020, 0.4 out of 100 000 women were victims of such homicide, compared with only 0.2 per 100 000 men [6].
The prevalence of violence varies greatly across the EU. However, cross-country comparisons of the crime statistics should be made with caution. Comparability is affected by different legal definitions concerning offenders and victims, different levels of police efficiency and the stigma associated with disclosing cases of violence against women [7] (see the article on SDG 5 ‘Gender equality' for more information on gender-based violence).
Access to justice
Well-functioning justice systems are an important structural condition on which EU Member States base their sustainable growth and social stability policies. Whatever the model of the national justice system or the legal tradition in which it is anchored, quality, independence and efficiency are among the essential parameters of an ‘effective justice system’. Because there is no single agreed way to measure the quality of justice systems, the budget actually spent on law courts is used here as a proxy for this topic. Moreover, judges need to be able to make decisions without interference or pressure from governments, politicians or economic actors, to ensure that individuals and businesses can fully enjoy their rights. The perceived independence of the justice system is used to monitor this aspect.
EU expenditure on law courts has grown over the past few years
In the EU, general government expenditure on law courts has risen by 48.7 % since 2006, reaching EUR 47.9 billion in 2021. In per capita terms, this corresponds to a 44.8 % increase from EUR 73.9 per inhabitant in 2006 to EUR 107.0 per inhabitant in 2021. However, when viewed as a share of total government expenditure, spending on law courts remained stable at 0.7 % between 2006 and 2019. In 2020 and 2021, the share decreased to 0.6 % of total expenditure, largely due to increases in other government expenditure to mitigate the economic and social impact of the COVID-19 pandemic. In relation to GDP, expenditure on law courts has also been stable since 2006, at 0.3 % of GDP [8]. Interestingly, in 2020 seven Member States increased their expenditure on law courts in relation to their GDP, and only one country reduced it.
Just above half of the EU population considers the justice system to be sufficiently independent
In 2022, 53 % of EU inhabitants rated the independence of the courts and judges in their country as ‘very good’ or ‘fairly good’, which is one percentage point lower than in 2017. At the same time, the perception of ‘very bad’ or ‘fairly bad’ fell by one percentage point, from 36 % to 35 %. Interference or pressure from government and politicians was the most likely reason for a bad rating of perceived independence of courts and judges [9]. The opinion about the independence of courts and judges varied significantly across Member States. While in Finland, Denmark and Austria, the majority of respondents (88 %, 84 % and 83 %, respectively) rated the independence of their courts and judges as ‘very good’ and ‘fairly good’, this was only the case for 21 % of respondents in Croatia, 24 % in Poland and 25 % in Slovakia [10].
Age, employment status, education and experience with the justice system seem to have a notable effect on the perception of the independence of the justice system. In 2022, 59 % of 15- to 24-year-old respondents in the EU gave a good rating, compared with 50 % of respondents aged 55 or over. Employees (59 %) were more likely to give a good rating than self-employed people (52 %), manual workers (51 %) or people who were not employed (51 %). The longer people remained in education, the more likely they were to rate the independence of courts and judges as good: 57 % of those who completed education aged 20 or above gave a good rating, compared with 40 % of those who completed education aged 15 or younger. Notably, respondents who had been involved in a dispute that had gone to court were more evenly split between those who rated their system as good (51 %) and bad (45 %) than those who had not been to court (53 % good, 35 % bad) [11].
Trust in institutions
Effective justice systems are a prerequisite for the fight against corruption. Corruption causes social harm, especially when it is instrumentalised by organised crime groups to commit other serious crimes, such as trafficking in drugs and humans. Corruption can undermine trust in democratic institutions and weaken the accountability of political leadership. It also inflicts financial damage by lowering investment levels, hampering the fair operation of the internal market and reducing public finances.
Corruption perception in the EU has stagnated since 2016
Because there is no meaningful way to assess absolute levels of corruption in countries or territories on the basis of hard empirical evidence, capturing the perceptions of those in a position to offer assessments of public-sector corruption is currently the most reliable method of comparing relative corruption levels across countries. According to Transparency International’s Corruption Perceptions Index (CPI), the EU scored 64 on a scale from 0 (highly corrupt) to 100 (very clean) in 2022. This was 21 points more than the world average score of 43. The EU’s score has remained stable at this level since 2016, indicating no significant changes in the perception of corruption in Europe.
On a country level, EU countries continued to rank among the least-corrupt globally in 2022 and made up more than a half of the top 10 least-corrupt countries globally. Within the EU, northern European countries achieved the best scores, with Denmark, Finland and Sweden leading the ranking. At the other end of the scale, Hungary, Bulgaria and Romania showed the highest levels of perceived corruption across the EU, ranking at positions 77, 72 and 63, respectively, on the global list (comprising 180 countries in total) [12].
Country rankings in the CPI largely correspond to analogous answers collected in 2022 through a Eurobarometer survey [13], in which Denmark, Finland and Sweden were identified as having the least corruption. Responses to this survey, however, paint a more pessimistic picture of corruption levels across the EU than the CPI. In all but five countries, at least half of respondents considered corruption to be a widespread national problem. For the EU as a whole, this translates into an average of 68 % of respondents sharing this perception in 2022. This share has fallen by 8 percentage points since 2013. On the other hand, the proportion of the population who think corruption in their country is rare reached a high of 28 % in 2022.
There is a notable relationship between the CPI and the perceived independence of the justice system. Countries with a high CPI ranking, such as Denmark, Finland or Sweden, also show a high share of the population rating the independence of the justice system as ‘good’ (see Figures 8 and 10). Conversely, countries with less optimistic ratings of the justice system’s independence also tend to have lower CPI scores, for example Bulgaria and Croatia. As both indicators are based on people’s perceptions, however, a causal relationship between the effectiveness of the justice system and the occurrence of corruption cannot be inferred based on these data. Effective justice systems are nevertheless considered to be a prerequisite for fighting corruption [14].
Trust in EU institutions has been fluctuating over the past few years
Confidence in political institutions is key for effective democracies. On the one hand, citizens’ confidence increases the probability that they will vote in democratic elections. On the other hand, it provides politicians and political parties with the necessary mandate to take decisions that are accepted in society.
Trust in three of the EU’s main institutions – the European Parliament, the European Commission and the European Central Bank – has experienced periods of growth and decline throughout the past two decades. All three institutions saw a drop in trust in 2020, but data for 2023 indicate they have regained some ground, with 49 % of the population expressing their confidence in European Parliament and 46 % in both the European Commission and the European Central Bank. Compared with 2022, however, trust in the Commission and the Parliament decreased by 1 percentage point, while trust in the European Central Bank increased by 2 percentage points. Throughout the years, the European Parliament has remained the most trusted of the three institutions surveyed.
The economic crisis may have played a role in the decline in trust in EU institutions observed between 2007 and 2015, while the COVID-19 pandemic might have influenced the drop in 2020. High inflation levels due to pressure on energy, food and other commodity prices as a result of Russia’s aggression against Ukraine might have caused a decline in trust in the European Central Bank in 2022 and in the Commission and Parliament in 2023. However, surveys show that citizens tend to only have a general idea about the EU and lack a deeper knowledge of the role and powers of the EU institutions, making confidence in the EU more dependent on contextual information than on actual governance [15].
Presentation of the main indicators
Standardised death rate due to homicide

This indicator tracks deaths due to homicide and injuries inflicted by another person with the intent to injure or kill by any means, including ‘late effects’ from assault (International Classification of Diseases (ICD) codes X85 to Y09 and Y87.1). It does not include deaths due to legal interventions or war (ICD codes Y35 and Y36). The data are presented as standardised death rates, meaning they are adjusted to a standard age distribution in order to measure death rates independently from the population’s age structure.
.png)
Source: Eurostat (sdg_16_10)
.png)
Source: Eurostat (sdg_16_10)

Source: Eurostat (HLTH_CD_ASDR2)
Population reporting crime, violence or vandalism in their area

This indicator shows the share of the population who reported facing the problem of crime, violence or vandalism in their local area. This describes the situation where the respondent feels crime, violence or vandalism in the area to be a problem for the household, although this perception is not necessarily based on personal experience. The data stem from the EU Statistics on Income and Living Conditions (EU-SILC).
_2023.png)
Source: Eurostat (sdg_16_20)
_2023.png)
Source: Eurostat (sdg_16_20)
General government total expenditure on law courts

This indicator refers to the general government total expenditure on law courts. It includes expenditure on the administration, operation or support of civil and criminal law courts and the judicial system, including enforcement of fines and legal settlements imposed by the courts. The operation of parole and probation systems, legal representation and advice on behalf of government or on behalf of others provided by government in cash or in services are also taken into account. Law courts include administrative tribunals, ombudsmen and the like, but excludes prison administrations.
.png)
Source: Eurostat (sdg_16_30)
.png)
Source: Eurostat (sdg_16_30)
Perceived independence of the justice system: very or fairly good

This indicator is designed to explore respondents’ perceptions about the independence of the judiciary across EU Member States, looking specifically at the perceived independence of the courts and judges in a country. Data on the perceived independence of the justice system stem from annual Flash Eurobarometer surveys, which started in 2016 on behalf of the European Commission’s Directorate-General for Justice and Consumers.
.png)
Source: European Commission services, Eurostat (sdg_16_40)
.png)
Source: European Commission services, Eurostat (sdg_16_40)
Corruption Perceptions Index

This indicator is a composite index based on a combination of surveys and assessments of corruption from 13 different sources and scores. It ranks countries based on how corrupt their public sector is perceived to be, with a score of 0 representing a very high level of corruption and 100 representing a very clean country. The sources of information used for the Corruption Perception Index (CPI) are based on data gathered in the 24 months preceding the publication of the index. The CPI includes only sources that provide a score for a set of countries/territories and that measure perceptions of corruption in the public sector. For a country/territory to be included in the ranking, it must be included in a minimum of three of the CPI’s data sources. The CPI is published by Transparency International.
_to_100_(very_clean)).png)
Source: Transparency International, Eurostat (sdg_16_50)
_to_100_(very_clean)).png)
Source: Transparency International, Eurostat (sdg_16_50)
Population with confidence in EU institutions

This indicator measures confidence among EU citizens in three EU institutions: the European Parliament, the European Commission and the European Central Bank. It is expressed as the share of positive opinions (people who declare that they tend to trust) about the institutions. Citizens are asked to express their confidence levels by choosing the following alternatives: ‘tend to trust’, ‘tend not to trust’ and ‘don’t know’ or ‘no answer’. The indicator is based on the Eurobarometer, a survey which has been conducted twice a year since 1973 to monitor the evolution of public opinion in Member States.
.png)
Source: European Commission services, Eurobarometer, Eurostat (sdg_16_60)
.png)
Source: European Commission services, Eurobarometer, Eurostat (sdg_16_60)
Direct access to
Further reading on peace, justice and strong institutions
- European Commission (2022), The 2022 EU Justice Scoreboard, COM(2022) 234 final, Brussels.
- European Commission (2022), Flash Eurobarometer 503, Report on Perceived independence of the national justice systems in the EU among the general public.
- European Commission (2017), Fight against corruption, European Semester thematic factsheet.
- European Research Centre for Anti-Corruption and State-Building (ERCAS) & Hertie School of Governance (2015), Public integrity and trust in Europe, Berlin.
- UNODC and UN Women (2022), Gender-related killings of women and girls (femicide/feminicide), United Nations Office on Drugs and Crime.
Further data sources on peace, justice and strong institutions
Notes
- ↑ Eurostat (ilc_mdvdw06)
- ↑ See for example: Rader, N. (2017), Fear of Crime, Oxford Research Encyclopedia of Criminology.
- ↑ UNODC (2018), Global study on homicide 2018, Gender-related killing of women and girls, United Nations Office on Drugs and Crime, Vienna, p. 18.
- ↑ UNODC and UN Women (2022), Gender-related killings of women and girls (femicide/feminicide), United Nations Office on Drugs and Crime, p. 8.
- ↑ Eurostat (CRIM_HOM_SOFF)
- ↑ Eurostat (CRIM_HOM_VREL)
- ↑ For more information see Eurostat metadata on Crime and criminal justice (crim) and European Union Agency for Fundamental Rights (2014), Violence against women: an EU-wide survey, Main results, Publications Office of the European Union, Luxembourg, pp. 25–26, 32.
- ↑ Eurostat (gov_10a_exp)
- ↑ European Commission (2022), Flash Eurobarometer 503, Report on Perceived independence of the national justice systems in the EU among the general public, p. 2.
- ↑ Ibid, p. 5.
- ↑ Ibid, pp. 6-7.
- ↑ Transparency International (2023), Corruption Perceptions Index 2022.
- ↑ European Commission (2022), Special Eurobarometer 523 on Corruption, pp. 17–18.
- ↑ Also see European Commission (2016), European Semester Thematic Factsheet on Effective Justice Systems.
- ↑ European Research Centre for Anti-Corruption and State-Building (ERCAS) & Hertie School of Governance (2015), Public integrity and trust in Europe, Berlin, p. 19; and Eurofound (2022), Fifth round of the Living, working and COVID-19 e-survey: Living in a new era of uncertainty, Publications Office of the European Union, Luxembourg.