SDG 14 - Life below water
Conserve and sustainably use the oceans, seas and marine resources for sustainable development
Data extracted in April 2023.
Planned article update: June 2024.
Highlights

This article is a part of a set of statistical articles, which are based on the Eurostat publication ’Sustainable development in the European Union — Monitoring report on progress towards the SDGs in an EU context — 2023 edition’. This report is the seventh edition of Eurostat’s series of monitoring reports on sustainable development, which provide a quantitative assessment of progress of the EU towards the SDGs in an EU context.
SDG 14 aims to protect and ensure the sustainable use of oceans. This includes reducing marine pollution and ocean acidification, end overfishing and conserve marine and coastal ecosystems. SDG 14 is strongly related to other SDGs as oceans sustain coastal economies and livelihoods, contribute to food production and function as a carbon sink.
Full article
Life below water in the EU: overview and key trends
The livelihoods and well-being of Europeans depend heavily on the health and productivity of marine ecosystems. At the same time, the marine and coastal environments are affected by climate change, habitat alteration, biodiversity loss, over-exploitation of marine resources and pollution from various sources. Monitoring SDG 14 in an EU context thus involves looking into trends in the areas of ocean health, marine conservation and sustainable fisheries. The EU has made moderate progress towards SDG 14 over the assessed five-year period. On the positive side, marine protected areas have increased and fish stocks in EU marine waters (especially in the North-East Atlantic) seem to be recovering due to reduced fishing pressure. However, unsustainable trends are visible in the areas of ocean acidification (as result of carbon dioxide emissions from human activities) and eutrophication.
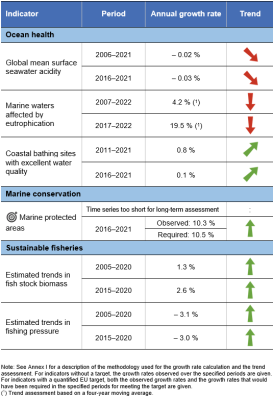
Table 1: Indicators measuring progress towards SDG 14, EU
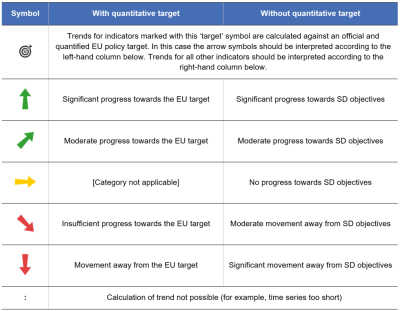
Table 2: Explanation of symbols for indicating progress towards SD objectives and targets


Ocean health
Accomplishing the goal of clean, healthy and productive oceans requires an integrated approach that addresses different pressures. To monitor SDG 14 in the EU context, indicators have been chosen that focus on ocean acidification, eutrophication and bathing water quality. The EU is committed to improving water quality in marine waters and coastal areas in the sea basins around the EU. It aims to do this through a range of land-based and marine policies, and by active engagement in Regional Sea Conventions, the EU sea-basin and macro-regional strategies, and support to its outermost regions. As a result, some positive trends have been emerging for bathing water quality and the reduction of point-source pollution through improved waste water treatment. Oceans, however, have continued to acidify as a result of global climate change.
Seawater acidification poses a risk to the marine environment and global climate regulation
Seawater acidification occurs when increased levels of carbon dioxide (CO2) from the atmosphere are absorbed by the ocean. Acidification reduces calcification and affects biochemical processes such as photosynthesis, with knock-on effects for entire ecosystems [1]. Because cold water absorbs more CO2, polar regions are disproportionately hard hit by acidification. Research has shown that organisms relying on calcification (for example, mussels, corals and plankton) and photosynthesis (plankton and algae) are particularly vulnerable to increased acidity [2].
Before industrialisation, pH levels varied between 8.3 and 8.2. Since 1985, these levels have been declining at a steady rate, with the global mean surface seawater pH reaching an unprecedented low of 8.049 in 2021. EU leadership to mitigate climate change (see the article on SDG 13 ‘Climate action’) is thus of vital importance for reaching the SDG target 14.3 on minimising seawater acidification.
Pollution continues to threaten the marine environment
In addition to acidification, Europe’s marine ecosystem continues to be at threat from organic and chemical pollutants from human activities, as well as marine litter and noise pollution. Excessive nutrient loads from agriculture and municipal waste water – in particular compounds of phosphorus and nitrogen — cause eutrophication, which can lead to problematic algal blooms and oxygen depletion with severe consequences for the marine ecosystem health and biodiversity.
The Copernicus Marine Service monitors all EU sea basins for oxygen depletion and measures anomalies in chlorophyll-a levels as an indicator of eutrophication. The chlorophyll data show strong annual fluctuations in the area of EU marine waters affected. For most of the years in the time series from 2000 to 2022, less than 20 000 square kilometres (km2) were affected, corresponding to less than 0.4 % of the EU’s exclusive economic zone (EEZ).However, in some years — for example 2007, 2008, 2018 and 2022 — more than twice that area was affected, highlighting the strong annual variability in the extent of eutrophication. In 2022, 54 920 km2 of EU marine waters were affected by eutrophication, corresponding to 1.0 % of the EU’s EEZ. Applying a smoothed four-year moving average for a trend assessment confirms that over the assessed five-year period from 2017 to 2022 the area affected by eutrophication was on the rise in the EU.
Another threat to the marine environment is chemical pollution from hazardous substances and marine plastic litter and micro-plastics. Chemical pollution stems from a number of land-based and marine sources, including agriculture (through the application of pesticides and veterinary medicines), industry, households and the transport sector. Of particular concern are persistent organic pollutants (POPs), which degrade slowly and can bio-accumulate in the food chain. Marine litter, such as plastic bottles and packaging, can also break down into smaller particles through photodegradation, releasing chemicals such as bisphenol A (BPA) and phthalates into the water. All in all, the transfer of toxic chemicals from the litter into the food chain is already taking place at large scale and may ultimately have combined effects on marine life and human health.
Estimates of plastic litter entering Europe’s oceans are highly tentative, due to a lack of data. However, the European Commission estimates that 150 000 to 500 000 tonnes of plastic enter the EU’s marine waters every year. Plastic pollution has many harmful effects on the marine environment, for example it may trap or strangle marine animals or be ingested by them. Marine plastic can come from both land- and sea-based sources. Single-use plastics account for about 50 % of all marine litter on European beaches [3]. Based on a Commission initiative, in 2019 the European Parliament and the Council adopted the new European Directive on Single Use Plastics targeting these plastics and fishing gear alongside other plastic products.
Human-induced eutrophication, contaminant concentrations, marine litter and noise pollution are common multiple pressures that must be minimised for marine waters to achieve good environmental status under the MSFD and good ecological status for coastal waters under the WFD.
European coasts offer an increasing number of bathing sites with excellent water quality
Coastal water quality is affected by land-based pollution from sewage, agriculture run-off, and surface run-off from coastal cities, which can carry hazardous chemicals, nutrients and plastic litter and microplastics. The resulting pollution exerts significant pressure on aquatic ecosystems and underwater life.
In the EU, recent developments have been quite favourable in this regard, and as a result the water quality of the EU’s coastal bathing sites has improved almost continuously since 2011. The most important factors affecting the quality of these waters are microbiological contamination and marine litter. Between 2011 and 2021, the share of European coastal bathing sites with ‘excellent’ water quality grew more or less steadily, reaching 88.3 % in 2021. It should be noted though that the bathing water indicator provides only a limited view of pollution in European seas because it is focused on the shore and excludes transitional waters or waters further away from the coast [4]. In addition, because the classification of bathing water quality considers datasets reported for the past four bathing seasons, this indicator does not tend to fluctuate greatly from year to year.
Marine conservation
The lives of European citizens depend in many ways on the services marine ecosystems provide, including climate regulation, fish and seafood provision, coastal protection, cultural value, recreation and tourism. Against this backdrop, the European Commission and Member States have taken multiple steps to combat the loss of aquatic and coastal habitats and biodiversity, which poses a serious threat to human livelihoods, food security and climate stability [5]. A crucial step has been the designation of a network of marine protected areas (MPAs) [6], in which some human activities are subject to stricter regulation. The degree of protection and hence the effectiveness of MPAs depends on the management plan regulating each protected area. Management measures may range from a total ban on fishing, mining or wind power generation, to a more moderate protection regime where economic activity is restricted, for example, allowing only certain types of fishing methods. However, many MPAs still lack comprehensive management plans or permit potentially harmful activities [7]. One of the commitments taken by the international community at the 2022 One Ocean summit and the UN COP15 on Biodiversity has been to designate new MPAs to achieve the goal of 30 % of marine space under protection by 2030. This goal is also supported by the landmark Treaty of the High Seas to protect the ocean of the high ambition coalition on Biodiversity Beyond National Jurisdiction (BBNJ) and was already included it in the EU Biodiversity Strategy for 2030. With the ambition to accelerate the implementation of SDG 14 globally, the EU pledged 52 commitments worth up to EUR 7 billion at the UN Ocean Conference in June 2022.
While the extent of marine protected areas has been growing in the EU, the conservation status of marine habitats and species remains unfavourable
A report by the EEA revealed that a high proportion of marine species and habitats across Europe’s seas are still in ‘unfavourable conservation status’ and that the marine ecosystem condition is generally not 'good'. One approach to protect the state of marine ecosystems is the designation of MPAs.
Between 2012 and 2021, the extent of marine protected areas grew considerably, from 216 742 km2 to 611 550 km2. Even though this means MPAs represented only 12.1 % of overall EU marine area in 2021, the EU is on track towards meeting its 30 % target by 2030. Since 2016, MPA coverage has grown significantly in 12 out of the 22 EU Member states with a sea border. The largest relative improvements in MPA size were reported from France, Greece, Cyprus and Spain.
Although a positive development, growth in the extent of protected areas alone does not provide a good indication of how well species and habitats are being protected. In fact, the EU currently has no overview or assessment of how effective the management plans associated with designated MPAs in EU regional seas are. In a special report on the marine environment, the European Court of Auditors concluded that EU MPAs provide limited protection in practice.
To gain a better picture on MPAs, information on their connectivity, status and the implementation of conservation measures is needed. The Biodiversity Strategy for 2030 requires the Commission, in cooperation with Member States and the European Environment Agency (EEA), to advance criteria and guidelines for the identification and designation of new protected areas, as well as for coherent management planning. The European Commission adopted an action plan for protecting and restoring marine ecosystems for sustainable and resilient fisheries. This action plan calls on the EU Member States to take measures for minimising the by-catch of sensitive species and for prohibiting mobile bottom fishing in MPAs, owing to their high impact on seabed species and habitats.
Sustainable fisheries
Besides pollution, the unsustainable use of living resources is the main threat to marine habitats and species in the EU. An ecosystem-based approach to managing Europe’s fishing fleets is provided for under the EU’s common fishing policy and is required for biodiversity conservation.
Governance of fisheries in EU waters mainly focuses on fair access and sustainable supply. The European Common Fisheries Policy (CFP) aims to ensure that EU fisheries are managed sustainably by setting catch limits at the maximum sustainable yield. It limits the total amount of fish catches and controls who is allowed to fish how, when and where to prevent damage to vulnerable marine ecosystems and preserve fish stocks. Thus, the CFP’s ambition and implementation will directly affect whether SDG 14 is achieved, in particular the aim of ending overfishing, destructive and/or illegal, unreported and unregulated fishing practices, and subsidies that encourage these activities. In addition, unsustainable fisheries are a major threat to marine ecosystems through the bycatch of non-target species (such as birds and cetaceans) and seabed degradation. The CFP empowers Members States and the Commission to regulate fisheries in a way that it is also compliant with the obligations of the Birds and Habitats Directives and the MSFD.
Improved sustainability of fisheries in EU marine waters
European fisheries affect fish stock productivity and stock size through catches. However, because stock size also varies naturally, the management of fisheries is a complex exercise. Controlling fishing mortality is one way of managing fisheries. Fishing mortality (F) reflects the proportion of fish of a given age that is caught by fisheries during one year. For fisheries to be sustainable, fishing mortality should not exceed the maximum sustainable yield value (FMSY), which will provide the largest catch that can be taken from a fish stock over an indefinite period without harming it.
The model based median value of all F/FMSY assessments can be used to estimate fishing pressures on fish stocks. Values above 1.0 mean the current fishing mortality (F) exceeds the estimated maximum sustainable yield (FMSY). The results for EU marine waters mirror the downward trend in overexploited overall stocks and show a 37 % reduction in fishing pressure, from 1.87 in 2005 to 1.17 in 2020. However, this overall figure masks the fact that while fish stocks in the North-East Atlantic (including the Baltic Sea) — where about three-quarters of the EU’s catch originates — were on average fished sustainably (F/FMSY median of 0.76 in 2021), the Mediterranean and Black Sea fish stocks were still heavily overfished (F/FMSY median of 1.71 in 2020). If the EU is to meet its own targets for sustainable fisheries, efforts need to be increased substantially in these sea regions.
At the same time, there has been an improvement in the number of stocks fished below FMSY in the North-East Atlantic. In 2003, only 27 % of stocks in this region were fished below FMSY, whereas in 2021, this figure had risen to 74 % [8]. In turn, however, this means that a quarter of North-East Atlantic stocks were still overfished.
The EU’s approach to sustainable fisheries is not limited to respecting MSY. The Marine Strategy Framework Directive requires commercially exploited fish and shellfish populations to have a healthy distribution of age and size.
The status of stocks and their reproductive capacity can be measured and described by fish stock biomass as well as by spawning stock biomass (SSB). Biomass estimates are, however, associated with high levels of uncertainty due to the high annual variability of stock biomass. Fish stocks can also take time to respond to changes in management measures, and results can be masked by other factors, such as environmental conditions and predation [9]. For this reason, analyses of stock biomass trends should always focus on longer term patterns. There has been an estimated 22 % increase in biomass in EU marine waters between 2005 and 2020. The increase has been stronger in the North-East Atlantic, gaining about 43 %, while stock biomass only grew by only 3 % in the Mediterranean and Black Sea.
Presentation of the main indicators
Global mean surface seawater acidity

This indicator shows the global yearly mean surface seawater acidity expressed as pH value. The decline in pH observed on a global scale corresponds to an increase in seawater acidity. This trend is caused by an increase in atmospheric CO2, which increases the uptake of CO2 by oceans. This is directly correlated with seawater pH. The Copernicus Marine Service has reconstructed the global yearly mean surface seawater pH from 1985 onwards.
.png)
Source: EEA, Copernicus Marine Service, Eurostat (sdg_14_50)
Marine waters affected by eutrophication

This indicator shows the extent of eutrophic marine waters in the EU's exclusive economic zone (EEZ). An area is classified as eutrophic if chlorophyll-a concentrations, as a proxy, are above the 90th percentile of the 1998–2017 reference base line for more than 25 % of the observation days in a given year. Eutrophication is the process by which an excess of nutrients — mainly phosphorus and nitrogen — leads to increased growth of plant material, particularly planktonic algae, in an aquatic body, resulting in a decrease in water quality. This can, in turn, cause death by hypoxia of aquatic organisms. Anthropogenic activities, such as farming, agriculture, aquaculture, industry and sewage, are the main source of nutrient input in problem areas. The Copernicus Marine Service calculates the indicator from satellite imagery.
.png)
Source: Mercator Ocean International, Copernicus Marine Service, Eurostat (sdg_14_60)
,_by_country,_2017_and_2022_(%25_of_exclusive_economic_zone_(EEZ)).png)
Source: Mercator Ocean International, Copernicus Marine Service, Eurostat (sdg_14_60)
Bathing sites with excellent water quality

This indicator shows the share of inland and coastal bathing sites with excellent water quality in the EU and is calculated based on the moving average of 16 sampling events in four years to be sure that most weather events are covered. Bathing water quality is assessed according to standards for microbiological parameters (intestinal Enterococci and Escherichia coli). The Bathing Water Directive (BWD) requires Member States to identify and assess the quality of all inland and marine bathing waters and to classify these waters as ‘poor’, ‘sufficient’, ‘good’ or ‘excellent’ depending on the levels of faecal bacteria detected. The data presented in this section stem from the European Environment Agency (EEA) and are based on Member States reporting under the BWD.
.png)
Source: EEA, Eurostat (sdg_14_40)
.png)
Source: EEA, Eurostat (sdg_14_40)
Marine protected areas

This indicator measures the extent of marine protected areas (MPAs) in EU marine waters. MPAs are biodiversity ‘hotspots’ and can serve various objectives including species and habitats protection, biodiversity conservation and restoration, but also resource use within defined ecological boundaries. MPAs may also positively impact neighbouring areas. For all MPAs, specific management objectives are set, often consisting of different zones with permitted and non-permitted uses. The indicator comprises nationally designated protected areas and Natura 2000 sites. A nationally designated area is an area protected by national legislation. The Natura 2000 network comprises both marine and terrestrial protected areas designated under the EU Habitats and Birds Directives with the goal to maintain or restore a favourable conservation status for habitat types and species of EU interest. The EU biodiversity strategy for 2030 aims to protect at least 30 % of land and sea in Europe, including both nationally designated sites and Natura 2000 sites. Data provided by the Member States to the Commission are consolidated by the European Environment Agency and collected by European Commission Directorate-General for the Environment.
.png)
Source: EEA, Eurostat (sdg_14_10)
.png)
Source: EEA, Eurostat (sdg_14_10)
Estimated trends in fish stock biomass

Fish stock biomass is a function of biological characteristics such as abundance and weight and can indicate the status of a fish stock when measured against reference values. This is a model-based indicator that is computed using results from single-species quantitative stock assessments. It shows the median value of fish stock biomass relative to 2003 [10]. Time series for stock biomass estimates are provided by the International Council for the Exploration of the Sea (ICES).
.png)
Source: Joint Research Centre (JRC) — Scientific, Technical and Economic Committee for Fisheries (STECF), Eurostat (sdg_14_21)
Estimated trends in fishing pressure

To ensure fish stocks are exploited sustainably, the CFP aims to rebuild stocks above levels at which they can produce the maximum sustainable yield (MSY). MSY is determined by the long-term average stock size that allows fishing at this level. The indicator shows the model-based median value of current fishing mortality (F) relative to the estimated maximum sustainable yield (FMSY), expressed with the term F/ FMSY. Values below 1 indicate sustainable fishing levels (F ≤ FMSY). The modelled trend for the total EU waters is dominated by the more stable situation in the North East Atlantic, while the heavier fishing pressure in the Mediterranean and the Black Sea has lower weight in the model. Time series data on fishing mortality are provided by the International Council for the Exploration of the Sea (ICES).
).png)
Source: Joint Research Centre (JRC) — Scientific, Technical and Economic Committee for Fisheries (STECF), Eurostat (sdg_14_30)
Direct access to
More detailed information on EU SDG indicators for monitoring of progress towards the UN Sustainable Development Goals (SDGs), such as indicator relevance, definitions, methodological notes, background and potential linkages, can be found in the introduction of the publication ’Sustainable development in the European Union — Monitoring report on progress towards the SDGs in an EU context — 2023 edition’.
Further reading on life below water
- EEA (2019), Marine Messages II. Navigating the course towards clean, healthy and productive seas through implementation of an ecosystem-based approach, EEA Report No 17/2019, European Environment Agency, Copenhagen.
- EEA (2020), Bathing water management in Europe: Successes and challenges, EEA Report No 11/2020, European Environment Agency, Copenhagen.
- EEA (2019), Nutrient enrichment and eutrophication in Europe's seas, EEA Report No 14/2019, European Environment Agency, Copenhagen.
- EEA (2018), Contaminants in Europe’s Seas. Moving towards a clean, non-toxic marine environment, EEA Report No 25/2018, European Environment Agency, Copenhagen.
- FAO (2022), The State of World Fisheries and Aquaculture 2022. Sustainability in action, Rome.
- OECD (2017), Marine Protected Areas: Economics, Management and Effective Policy Mixes, OECD Publishing, Paris.
- Scientific, Technical and Economic Committee for Fisheries (STECF) (2023), Monitoring the performance of the Common Fisheries Policy (STECF-Adhoc-23-01), Publications Office of the European Union, Luxembourg.
- UNESCO (2020), Global Ocean Science Report — Charting Capacity for Ocean Sustainability, K. Isensee et al. (eds), UNESCO Publishing, Paris.
- EEA (2021). Europe’s marine biodiversity remains under pressure.
Further data sources on life below water
- European Commission, Copernicus Marine Service
- Directorate-General for Maritime Affairs and Fisheries, European Atlas of the Seas.
- European Marine Observation and Data Network (EMODnet).
- EEA, Marine protected areas in Europe's seas.
- EEA, Nutrients in transitional, coastal and marine waters.
- School of Ocean and Earth Science and Technology at the University of Hawai'i, Hawaii Ocean Time Series (HOT).
Notes
- ↑ Hoegh-Guldberg, O., R. Cai, E.S. Poloczanska, P.G. Brewer, S. Sundby, K. Hilmi, V.J. Fabry, and S. Jung (2014), The Ocean. In: Climate Change (2014), Impacts, Adaptation, and Vulnerability. Part B: Regional Aspects, Cambridge University Press, Cambridge, pp. 1655–1731.
- ↑ European Environment Agency (2017), Climate change, impacts and vulnerability in Europe 2016- An indicator-based report, EEA Report No 1/2017, Copenhagen.
- ↑ Addamo, A. M., Laroche, P., Hanke, G. (2017), Top Marine Beach Litter Items in Europe, Publications Office of the European Union, Luxembourg.
- ↑ Article 5 of the United Nations Convention on the Law of the Sea (UNCLOS) defines the normal baseline as the low-water mark as marked on large scale-charts by the coastal State.
- ↑ European Commission (2021), Assessment of the existing EU policy tools in the field of Sustainable Development Goal (SDG) 14 and other ocean-related Agenda 2030.
- ↑ European Environment Agency (2015), Marine protected areas in Europe's seas — An overview and perspectives for the future, EEA Report No 3/2015, Copenhagen.
- ↑ Dureuil M., Boerder K., Burnett K. A., Froese R. and Worm B. (2018), Elevated trawling inside protected areas undermines conservation outcomes in a global fishing hot spot, Science 362 (6421), 1403–1407.
- ↑ Calculations based on: Scientific, Technical and Economic Committee for Fisheries (STECF) (2023), Monitoring the performance of the Common Fisheries Policy (STECF-Adhoc-23-01), Publications Office of the European Union, Luxembourg.
- ↑ Measuring the Effect of Catch Shares, Has the status of fish stocks changed? Biological indicators: Biomass.
- ↑ Model-based indicators are preferable to arithmetic mean estimates, which are sensitive to outliers.