Quality of life indicators - social interactions
Data extracted in March 2021.
Planned article update: 26 June 2024.
Highlights
People who do not have someone to ask for non-material help, 2018 (aged 16 years and over)
This article focuses on the fifth dimension —leisure and social interactions — of the nine quality of life indicators dimensions that form part of a framework endorsed by the Eurostat expert group on quality of life indicators, and especially the second part. Social interactions — interpersonal activities and relationships — are a related but conceptually different issue, which may be considered as ’social capital’ for both individuals and society that also affect people’s quality of life.
Full article
Social interactions
Apart from their basic function of meeting the natural human need for socialising, more frequent and more rewarding social interactions are also associated with a range of different life outcomes, such as better health or improved chances of finding a job. More specifically, social support — or having someone to rely on in case of need — is considered to be a particularly important variable for explaining the distribution of happiness; for example, it has been chosen as one of six key indicators that are used within the United Nations’ World happiness report. Aside from encompassing our basic need to engage in activities, the quality of social interactions may promote the existence of supportive relationships, interpersonal trust and social cohesion.
An assessment of social interactions should distinguish between three different but interwoven aspects: (a) activities with people, that is, being in contact or doing things with family, relatives or friends and the satisfaction that one derives from these personal relationships; (b) activities for people, that is, one’s involvement in formal and informal voluntary activities; and (c) supportive relationships, shown by one’s ability to get help and personal support in case of need.
Being in contact with family, relatives and friends
This next section is based on the reported frequency with which people get together with family, relatives and friends; note that the information that is presented only refers to those family members, relatives and friends who do not live in the respondent’s household. Social relationships have been shown to operate as a buffer against the negative effects of stress on an individual’s well-being [1]. Research has also shown that the subjective well-being of people who have frequent social contact with family, relatives and friends is greater than for people who do not.
In 2015, a small majority (51.3 %) of people in the EU reported getting together with family and relatives at least once every week (see Map 1). In 13 of the EU Member States, less than half of the adult population got together with family and relatives at least once a week, this share falling to less than one third in Denmark, the Baltic Member States and Poland. By contrast, in several of the southern Member States — Cyprus, Malta, Portugal and Greece — more than two thirds of the adult population stated that they got together at least once a week with family and relatives; this may reflect differences in geographical mobility, social structures, norms and customs with regard to family ties in (extended) families.
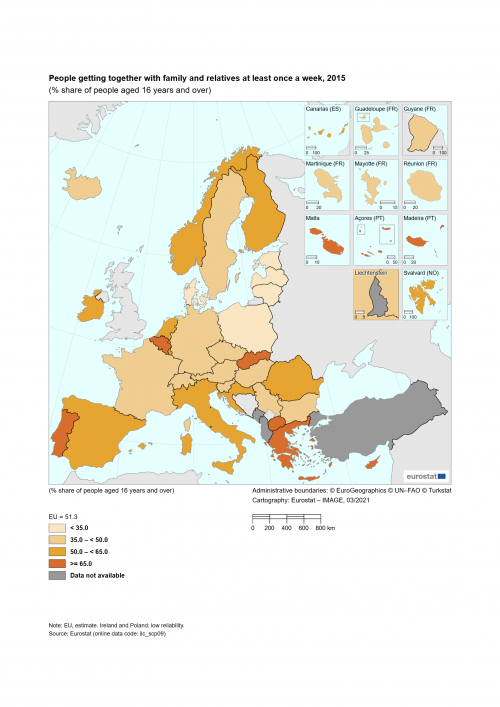
(% share of people aged 16 years and over)
Source: Eurostat (ilc_scp09)
A similar analysis is presented in Map 2, with its focus on people getting together with friends (as opposed to family and relatives). In 2015, just over half (53.0 %) of the adult population in the EU got together with their friends at least once a week; this share ranged from more than two thirds in Greece, Cyprus, Croatia, Portugal and Spain down to less than 40.0 % in Latvia and Lithuania, reaching a low of 24.8 % in Poland. Therefore, as for getting together with family and relatives, it was generally the case that people living in the southern Member States had the highest propensity to meet their friends at least once a week when compared with people living in the rest of the EU, in particular, compared with those living in the north-west of the EU. However, there were quite some exceptions too, for example Sweden and the EFTA country Norway are amongst the countries in which a large number of persons see their friends at least once a week, while in Romania the same proportion is amongst the lowest in the European Union.
A comparison between the results for Map 1 and Map 2 reveals some interesting caveats. As already noted it was quite common for people in the southern EU Member States to get together with both family and relatives as well as with friends on a regular basis, this was particularly the case in Greece, Cyprus and Portugal, as well as North Macedonia. While a high proportion of people in Sweden got together with friends at least once a week, this was not mirrored in terms of the share of people who got together with family and relatives on such a regular basis. By contrast, in Malta, it was more common for people to socialise with family and relatives each week, while a relatively low share of the population got together with friends on such a regular basis; a similar pattern was observed in Romania. At the other end of the range, Poland, the Baltic Member States and Denmark were each characterised by having low shares of their populations socialising with both family and relatives and with friends.

(% share of people aged 16 years and over)
Source: Eurostat (ilc_scp09)
The next section extends the analysis by looking at the share of the adult population that got together with family and relatives according to age. In 2015, a majority of each of the age groups shown in Figure 1 reported that they got together with family and relatives at least once a week: the lowest shares across the EU were recorded for people aged 16-24 and 25-64 years, while the elderly — in particular people aged 75 years and over — were more likely to get together with family and relatives.

(% share)
Source: Eurostat (ilc_scp09)
Among the EU Member States there was no clear pattern as to the relationship between age and getting together with family and relatives. Cyprus, Belgium, Italy, Spain, Finland, Luxembourg, Czechia, France, Slovenia, Sweden, Denmark, Estonia and Lithuania recorded a similar pattern to the EU average, with the elderly more likely to socialise with family and relatives than younger (16-24) or working-age (25-64) adults. By contrast, young adults (aged 16-24) were the more likely (than the other age groups) to socialise with family and relatives at least once a week in Ireland, Slovakia, Romania, the Netherlands, Germany, Bulgaria, Austria and Latvia. It is also interesting to note that in Portugal, Croatia, Romania and Germany people aged 75 years and over were less inclined (than the other age groups) to socialise with family and relatives at least once a week.
Figure 2 has a similar analysis looking at the share of the adult population that got together with friends according to age. There was a much clearer pattern, insofar as young adults (aged 16-24) were usually much more likely to get together with friends at least once a week than the other age groups, with a decreasing share of the population getting together with friends as a function of age. Across the whole EU, just over four fifths (80.6 %) of all young adults got together with friends at least once a week in 2015; the corresponding share for people of working age (defined here as 25-64 years) was 50.5 %, that for people aged 65-74 years was less than half (48.9 %), while the lowest share (44.9 %) was recorded for people aged 75 years and over.
This pattern was repeated in a majority of the EU Member States, with the highest share of people getting together with friends systematically recorded for young people. There were however some differences, for example: in Cyprus, Malta, the Netherlands and Austria the share of people getting together with friends was higher among people aged 65-74 years than it was for people of working-age (25-64 years), while in Denmark, Ireland and France this was also the case for people aged 75 and over (as well as those aged 65-74 years). In Denmark, Latvia and Estonia, the share of people getting together with friends was higher among people aged 75 years and over than it was for people aged 65-74 years; this might reflect, at least to some degree, the fact that those people aged 75 and over who were interviewed for the survey were likely to be in relatively good health and therefore still capable of socialising with friends (whereas individuals in poorer health are not surveyed if living in a home/hospice/other form of institution).
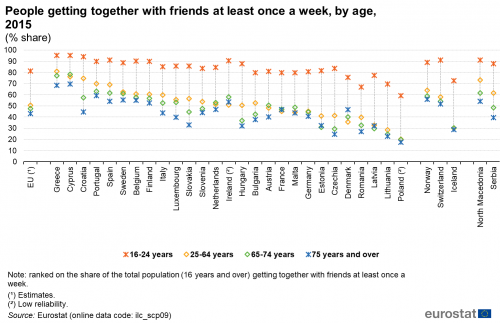
(% share)
Source: Eurostat (ilc_scp09)
The final part of this section looks at information that may be used to analyse loneliness; this is thought to be particularly detrimental to the quality of life experienced by the elderly (for example, loneliness may increase the risk of diseases such as Alzheimer’s), or people who are receiving healthcare treatment. In 2015, some 7.2 % of the EU adult population got together with family and relatives less than once a month; this share was higher for people with relatively low levels of income, as the share for people in the first income quintile was 10.4 %, compared with 4.8 % for people in the fifth income quintile.
This pattern was reproduced in each of the EU Member States, confirming that people with higher incomes were more likely to get together with their family and relatives. While the overall share was lowest in Cyprus (1.3 %), it is interesting to note that in Cyprus people in the first income quintile were 7.3 times as likely to get together with family and relatives less than once a month when compared with people in the fifth income quintile; this was the biggest relative difference among any of the Member States, with the next largest differential recorded in Ireland, where people in the first income quintile were 5.9 times as likely as those in the fifth income quintile to get together with family and relatives less than once a month.
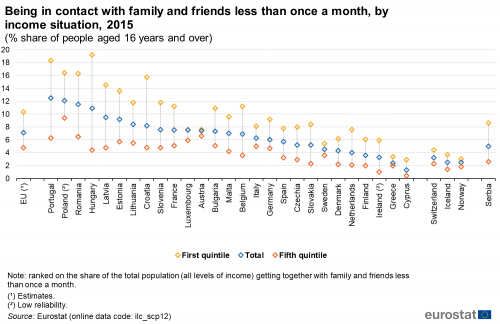
(% share)
Source: Eurostat (ilc_scp09)
Figure 4 shows a similar analysis for the frequency with which people get together with friends, again by income situation. In 2015, almost 1 in 10 (9.4 %) adults in the EU got together with their friends less than once a month; this share reached 12.9 % for those people with the lowest incomes and fell to 5.7 % among those people with the highest incomes, repeating the pattern observed for the frequency with which people got together with families and relatives.
Across the EU Member States the same pattern was systematically repeated with income appearing to be a key factor in determining how often individuals got together with their friends. This was once again particularly the case in Cyprus — which recorded the lowest overall share of its adult population getting together with friends less than once a month, 2.9 % — as people in the first income quintile were seven times as likely as people in the fifth income quintile to meet their friends less than once a month. Relative differences between these two income groups were also quite high in Croatia (where people in the first income quintile were 5.1 times as likely as people in the fifth income quintile to meet their friends less than once a month), Hungary and Czechia (4.2 and 4.0 times as high respectively).
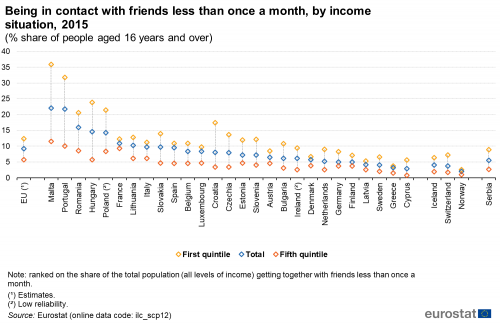
(% share)
Source: Eurostat (ilc_scp09)
Having no one to ask for help
It has been shown in the World Happiness Report[2] that life satisfaction, a subjective indicator for the quality of life, improves with the availability of practical, moral and financial support from family and friends. Within the context of EU-SILC, this area is covered by two specific questions: on the one hand, the respondent’s capacity/possibility to ask for any kind of help — moral, material or financial — from family, relatives, friends or neighbours; on the other, the presence of at least one person with whom the respondent can potentially (whether they need to or not) discuss personal matters.
Table 1 presents the percentage of people who do not have someone to ask for material help in each country and the EU as a whole. Around 19.4 % of the adult EU population is in that situation, with the younger age brackets (up to 49 years) below the EU average, and people aged 50 or older above the average. There are four Member States where more than a quarter of people say they have no one to ask for material help, with Bulgaria being on top with 27.1 % followed by Greece, Germany and Romania. At the other end of the scale are four countries where less than 10 % do not have someone to ask for material help, in descending order Belgium, Sweden, Czechia and Poland having the lowest score at 8.2 %.
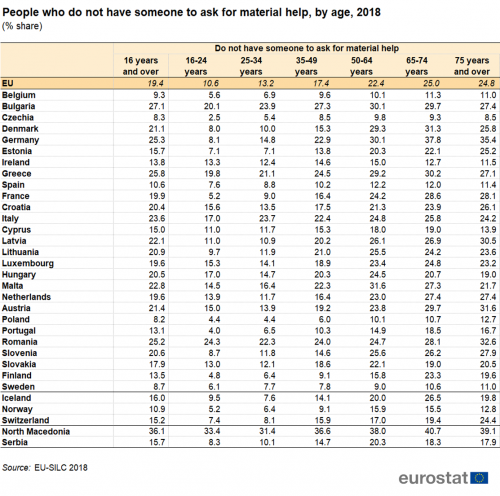
(% share)
Source: Eurostat (ilc_scp15) and (ilc_scp17)
A similar pattern is seen in Table 2, showing the percentage of persons who do not have someone to ask for non-material help, with the EU average at 9.2 %. Again, the generation below 50 years is clearly below that average whereas the older generation is equally clearly above it. In general, non-material help seems to be easier to get than material help. In Romania, the highest rate of persons who do not have someone to ask for non-material help is recorded, 19.5 % of those aged 16 years or older responding in that sense. The next highest rates are measured in Bulgaria (19.3 %) and Italy (16.3 %). There are three more EU countries with rates above 10 %: Greece, Malta and the Netherlands. By contrast, in four Member States less than 5 % of the population say they have no one to ask for non-material help. These are Poland (4.3 %), Czechia (4.1 %), Finland (3.5 %) and Sweden (3.3 %).
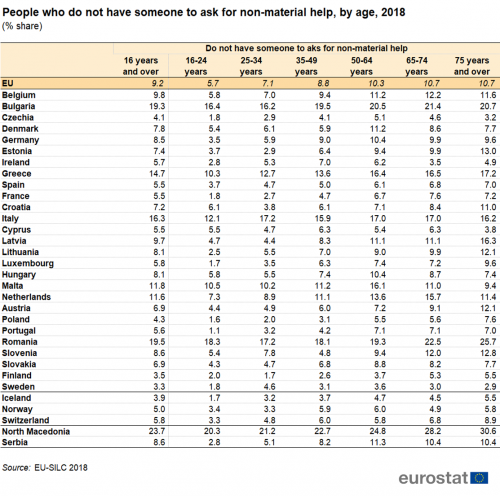
(% share)
Source: Eurostat (ilc_scp15) and (ilc_scp17)
Figure 5 scrutinizes the situation of people who do not have someone to ask for material help by income situation. In general, people from the first quintile (lowest incomes) respond twice as often than people from the fifth quintile (highest incomes) that they have no one to ask for material help (27.7 % versus 13.1 %). In all countries, Member States and non-Member States, the percentages of the first quintile where higher than those for the fifth quintile.
As regards the low income population, the responses range from 42.3 % in Bulgaria (the only country above 40 %) to 13.8 % in Czechia and Poland. There are eleven Member States where more than 30 % of people from the first quintile do not have someone to ask for material help, with 37.3 % recorded in Romania, followed by Germany (37.1 %), Hungary and Latvia (both at 33.7 %). By contrast, there are seven EU countries which register percentages below 20 %: Portugal (18,7 %), Belgium (17.8 %), Spain (16.6 %), Sweden (15.9 %), Finland (14.4 %), Czechia and Poland (both 13.8 %).
Looking at the fifth quintile of the population, Greece is the only country where more than 20 % say that they do not have someone to ask for material help (20.9 %). There are ten Member States with shares below 10 % for this category, where Sweden has the lowest rate in that income bracket at 3.4 %, followed by Czechia (4.0), Belgium (4.1) and Poland (4.9).
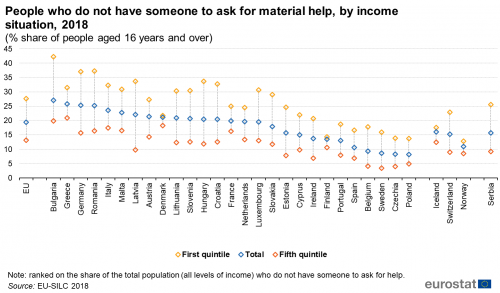
(% share)
Source: Eurostat (ilc_scp09)
Satisfaction with personal relationships
This section looks at the satisfaction with personal relationships from different perspectives, and analyses the situation by looking at different categories such as age, sex, income level and degree of urbanisation.
Within the EU, the satisfaction with personal relationships has slightly increased from 7.8 in 2013 to 7.9 in 2018 (Figure 6). In total, 19 Member States saw an increase, with Bulgaria experiencing the largest gain, from 5.7 to 6.6, but with both values still below the EU average. By contrast, five countries had falling levels of satisfaction with personal relationships, in particular Denmark, the Netherlands, Latvia (all -0.3) as well as Lithuania and Luxembourg (both -0.2). The highest levels of satisfaction in 2018 were measured in Ireland, Malta, Austria and Slovenia (all at 8.6), with nine more countries scoring above 8.0 points. All the other Member States had satisfaction levels above 7.0, except Bulgaria which recorded a value of 6.6.
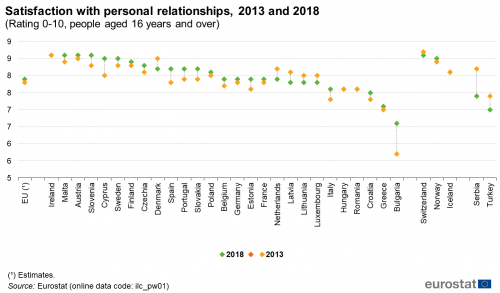
(Rating 0-10, people aged 16 years and over)
Source: Eurostat (ilc_scp12)
Figure 7 shows an analysis of the satisfaction with personal relationships, broken down by age groups. In 2018, in a majority of Member States the youngest age bracket (16 to 24 years) had higher levels of satisfaction than the average over all age groups. Only Denmark and Malta were exceptions to this rule with the younger ones being less satisfied than the population average. Overall, it appears that satisfaction levels are decreasing with age. The highest levels among the younger generation (16 to 24 years) were recorded in Slovenia (8.9) and Austria (8.8) followed by 23 countries with 8.0 points or more. Only two EU Member States had values below 8.0, namely Greece (7.6) and Bulgaria (7.4).
By contrast, the highest levels of satisfaction with personal relationships among the older generation (75 years and above) were found in Denmark and Sweden which recorded 9.1 and 9.0, respectively. In this category, the spread of answers was considerably larger than among the youngest members of society. At the lower end of the list, there are three countries with satisfaction levels below 7.0, namely Greece (6.9), Romania (6.8) and Bulgaria (5.8).

(Rating 0-10, people aged 16 years and over)
Source: Eurostat (ilc_scp12)
Figure 8 investigates the same variable from a male vs. female perspective. In 20 Member States women were more satisfied with their relationships than men, whereas in two countries the opposite was true. Five Member States showed no difference between the sexes. In general, the differences were small, the biggest ones being recorded in Denmark and Sweden, namely 0.3 points in favour of women. Romania and Ireland were the only EU countries where males rated their personal relationships higher than women (both 0.1 points). For males, the top score was reached in Ireland at 8.7 whereas the lowest was in Bulgaria, at 6.6. Females estimated their personal relationships highest in Austria, Malta and Sweden (all three at 8.7) and their lowest rating occurred in Bulgaria at 6.6.
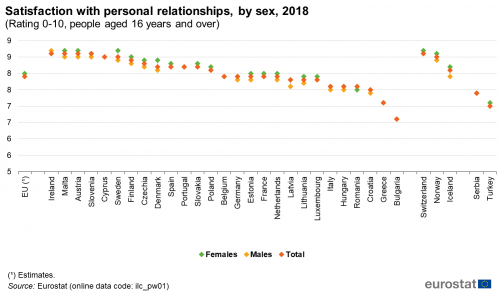
(Rating 0-10, people aged 16 years and over)
Source: Eurostat (ilc_scp12)
Yet another perspective at personal relationships is analysed in Figure 9, which looks at how people in the highest and lowest category of income rate their satisfaction with their personal relationships. Across all Member States, people with higher incomes (fifth quintile) tend to look more positively at their personal relationships than their counterparts with lower incomes (first quintile). The EU average for the first and fifth quintiles is 7.5 and 8.1, respectively. In eleven EU countries, the difference between the two groups (on a scale from 0 to 10) is somewhere between 0.1 (in Malta) and 0.5. Elsewhere in the EU, the differences are even larger, being higher than 1 percentage point in Croatia (1.2), Romania (1.4) and Bulgaria (1.5). This shows that people with lower incomes tend to accumulate multiple disadvantages.
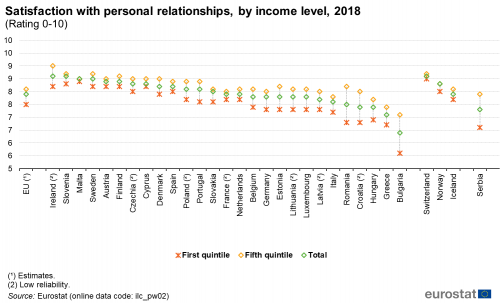
(Rating 0-10, people aged 16 years and over)
Source: Eurostat (ilc_scp12)
For people living in cities, towns and suburbs or in rural areas, the various levels of satisfaction with their personal relationships may take on different forms depending on the degree of urbanisation of their place of living (Figure 10). At EU level, all these three types of areas rate on average their satisfaction at the same level (7.9). However, within individual countries differences emerge as to where people are living. In 14 Member States, people living in rural areas tend to be more satisfied with their personal relationships than city dwellers with the biggest difference occurring in Greece (0.5) followed by Denmark (0.4). The opposite is true in ten EU countries with the largest gap recorded in Bulgaria (0.8) followed by Croatia (0.7). Hungary and Spain showed no discrepancies between the two types of living areas. Ireland has the highest average rating of satisfaction for all the types of living areas, whereas for Bulgaria the contrary holds true and their satisfaction is the lowest in all three categories.

(Rating 0-10, people aged 16 years and over)
Source: Eurostat (ilc_scp12)
Conclusions
Evidence from 2018 suggests that people from the older generation are less likely to have someone to ask for both material and non-material help. The same is true for persons from the first income quintile as compared to those from the fifth quintile. Likewise, people with higher incomes appear to be more satisfied with their personal relationships than persons with lower incomes. As regards satisfaction with personal relationships women tend to be slightly happier than men though the differences are quite small. With a few exceptions, satisfaction levels have increased between 2013 and 2018.
Source data for tables and graphs
Data sources
Within the quality of life framework, information on leisure s cover quantitative and qualitative aspects regarding frequency of social contacts and access to material and non material help, as well as a subjective assessment of the satisfaction with personal relationships.
The data used in this article are primarily derived from EU-SILC, an annual survey that is the principal European source for measuring income and living conditions, as well as the leading source of information for analysing different aspects related to the quality of life of households and individuals. All the data used in this article — covering both leisure and social interactions — come from two EU-SILC ad-hoc modules, one on Social and cultural participation (2015) and the other one on Well-being (2018); information about these topic is not collected on an annual basis.
In the 2015 module, there were a total of 15 variables collected in relation to social and cultural participation: seven in relation to integration with family, relatives, friends and neighbours; four on participation in cultural or sport events; three on formal and informal social participation; one on artistic activities. All of the data presented refer to individuals who were aged 16 and over (no information is presented in relation to households).
In the 2018 module on Well-being, there were a total of 15 variables collected on the topic, 5 on satisfaction with different areas of life, 2 on social support, 1 on trust in others, 1 on perceived social exclusion and 6 on the frequency of experiencing different types of feelings.
Context
Our subjective perception of well-being, happiness and life satisfaction is fundamentally influenced by our ability to engage in and spend time on activities we enjoy. The importance attributed by modern societies to work-life balance underlines the role that leisure and social interactions may play in our quality of life. They have a quantitative aspect (in other words, the availability of time for taking part in activities we enjoy) and a qualitative aspect (for example, the ease of access to leisure activities).
Several EU policies affect leisure: the EU seeks to preserve Europe’s shared cultural heritage (Article 167 of the Treaty on the Functioning of the European Union) in language, literature, theatre, cinema, dance, broadcasting, art, architecture and handicrafts, and to help make it accessible through initiatives such as the Culture sub-programme. To this end, the EU has also developed policies for audio-visual and media markets, including the audio-visual media services (AMS) Directive 2010/13, the Creative Europe framework programme on culture and media, as well as provisions for supporting public service broadcasting (Protocol No 29 of the Treaty on the Functioning of the European Union). In June 2016 the European Commission and the High Representative of the Union for Foreign Affairs and Security Policy adopted a Joint Communication Towards an EU strategy for international cultural relations. This provided for a number of guiding principles for EU action within the field of cultural relations, including:
- promoting cultural diversity and respect for human rights;
- fostering mutual respect and inter-cultural dialogue;
- ensuring respect for complementarity and subsidiarity;
- encouraging a cross-cutting approach to culture;
- promoting culture through existing frameworks for cooperation.
These areas are being tackled within the EU, among others, by the Erasmus+ programme, which promotes dialogue, support and participation across all areas of sport policy.
Direct access to
- All articles on poverty and social exclusion
- Quality of life indicators (online publication)
- Quality of life, see:
- Material living conditions (qol_mlc)
- Productive or other main activity (qol_act)
- Health (qol_hlt)
- Education (qol_edu)
- Leisure and social interactions (qol_lei)
- Economic security and physical safety (qol_saf)
- Governance and basic rights (qol_gov)
- Natural and living environment (qol_env)
- Overall experience of life (qol_lif)
- EU-SILC ad-hoc modules (ilc_ahm)
- 2015 - Social and cultural participation (ilc_scp)
- EU-SILC ad-hoc modules (ilc_ahm)
Notes
- ↑ Abdallah, S. and Stoll, L. (2012), Review of individual-level drivers of subjective well-being, produced as part of the contract Analysis, implementation and dissemination of well-being indicators, Eurostat.
- ↑ Helliwell, J., Layard, R., and Sachs, J. (eds.), World Happiness Report 2013, United Nations.