Merging statistics and geospatial information, 2020 projects - Germany
Integration of geospatial information and statistics – German grid cell database; 2020 project; final report December 2022
This article forms part of Eurostat’s statistical report on the Integration of statistical and geospatial information.
Full article
Problem
The project intended to address the capability to generate, process and make geospatial data available in the face of an increasing demand for grid cell-based data to support evidence-based policy advancement.
Objectives
The objectives of the project were:
- develop and install IT infrastructure needed for the generation, processing, storage and access of geospatial data (mainly points of interest and their accessibility data) at a grid level that can be merged with official statistics;
- provide an initial set of spatial data for grid cells and selected aggregation levels;
- strengthen the cooperation between federal agencies on topics of geospatial data.
Method
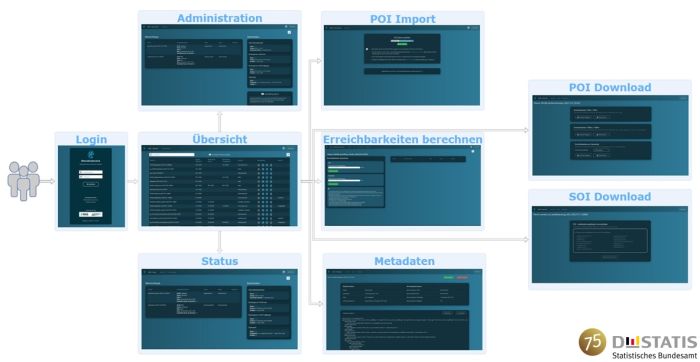
A database with a graphical user interface was developed.
- Reference geometries with square grid cells with a side length of 100 metres were used. These grid cells contain unique spatial identifiers that can be used in official statistics.
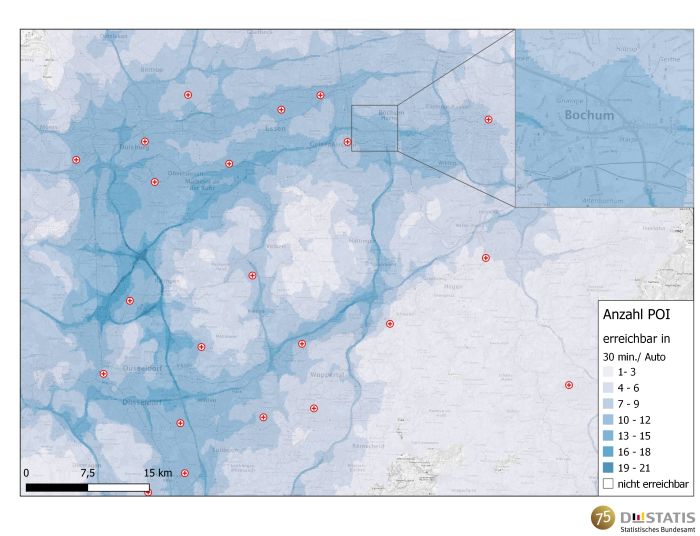
- The database was filled with points of interest (POI), most of which are only available to a limited group of users (public administration). For 15 POI topics (for example, hospitals), accessibility was calculated for pedestrians and for travel by car.
- A set of planar data for seven structures and spheres of interest (SOI), such as urban green spaces, were intersected with the grid. These represented seven land cover model classes of the Federal Agency for Cartography and Geodesy (BKG) which were also coded with their Coordination of Information on the Environment (CORINE) land cover class(es).
- Concepts and workflows for a continuous and mostly automated update of the geospatial data were developed, including generating accessibility data for POIs.
- Concepts and services were defined to facilitate the aggregation of data from grid cells to other spatial units, such as administrative units.
A concept covering the complete data life cycle was developed and implemented: adding new data (extending the database), updating, archiving and (possible) erasing of data.
An information model was implemented for metadata.
- Metadata are used for data management, identifying the corresponding dataset and relevant attributes pertaining, for example, to update frequency, validity period and spatial coverage.
- Furthermore, metadata address data lineage, providing information regarding base data (such as the valuation date of geometry data of municipalities used for data aggregation) and the tool chain with which the data were generated (such as the version information of the routing engine and the street network / network graph). Using these data items, the generation of all datasets can be traced, and the process can be repeated if required.
- The metadata contains further information on user rights.
Results
A database with a graphical user interface was developed that contains data for grid cells for POIs and SOIs, providing a possibility to aggregate the grid cells into larger area units.
The impact of different accessibility concepts (with respect to network routing) on statistical analysis and the selection of (open source) applications on technical performance/requirements were analysed.
Direct access to


