Merging statistics and geospatial information, 2020 projects - Bulgaria
Establishing access to geospatial data through linking geocoded and statistical data; 2020 project; final report 31 January 2023
This article forms part of Eurostat’s statistical report on the Integration of statistical and geospatial information.
Full article
Problem
There is a need to expand the existing geographic information system to develop ecosystem accounts as part of the broader environmental statistics and accounts.
Objectives
- Produce a mapping tool for a wide range of users to present socioeconomic statistical data.
- Link spatial data about economic activity causing pressure on the environment from one side and the state of the environment – the ecosystems – from the other.
- Establish contacts and regular data exchange with other institutions.
Method
The project involved combining data from different sources to produce a range of datasets about various units (such as individuals or businesses) for a 1 km x 1 km grid.
For several of the analyses, data from the cadastre were employed. These data required considerable work to enable them to be used. After working on the cadastre data, it was possible to link more than 4 million cadastre properties with the statistical register. For 2020, these represented 45.2 % of all employees, 51.5 % of income and 86.3 % of tangible fixed assets. For units with properties in more than one grid cell, the indicators (such as employment) were distributed across the various grid cells.
These data – linking the cadastre and statistical registers – were further developed and used in several ways.
- The boundaries of areas (adjacent to rivers) that would be inundated with floods, with a probability of recurrence once in 1 000 years, were provided by the Ministry of Environment and Waters (MOEW) as a shapefile. Combining this with the cadastre data of economic units, various economic indicators (such as employment, income and tangible assets) can be compiled for flood zones.
- Urban wastewater treatment plants (UWWTP) are installations for treating wastewater from settlements. The coordinates and capacity of all (113) UWWTPs in Bulgaria were available from the MOEW. Various indicators (such as the volume of treated/discharged wastewater and the number of served settlements) were added from the 2020 water supply, sewage and treatment survey. The coordinates of discharged wastewater from UWWTPs and the municipal sewerage system were linked with rivers.
- There are 55 municipal landfills in Bulgaria. A survey on municipal waste was used as the primary source of statistical data about landfills. The coordinates of landfills were taken from the survey, checked with the available coordinates from the European Pollutant Release and Transfer Register (EPTR). A point layer was created with the coordinates of the settlements served by each landfill.
- The survey concerning sources of emissions into the atmosphere is based on the European Monitoring and Evaluation Programme / European Environment Agency (EMEP/EEA) air pollutant emission inventory guidebook 2019. The coordinates of 171 combustion and industrial installations are available from the Bulgarian part of the EPTR. The emissions of SOx, NOx, CH4, CO, CO2 and dust were allocated to each cell (distributing the emissions proportionally across cells where required).
Other analyses were performed for the 1 km x 1 km grid using data from a range of sources.
- Data from the population census 2021 were used, classified to the 1 km x 1 km grid. 6.4 million people were allocated to the grid, while 0.1 million were not.
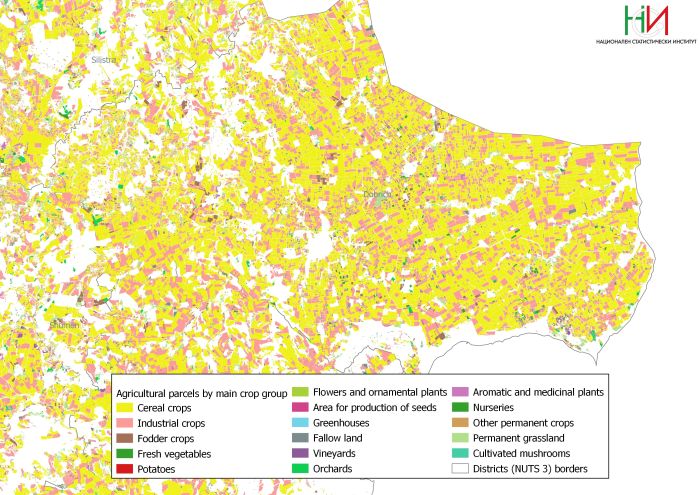
- The land parcel identification system (LPIS) provides data for the geospatial information system. It is a spatial register of agricultural parcels with information on geographic location, size (area) and a unique identifier; the register also includes the ID of the agricultural holding to which the parcel belongs. The classification of crops identified 254 types.
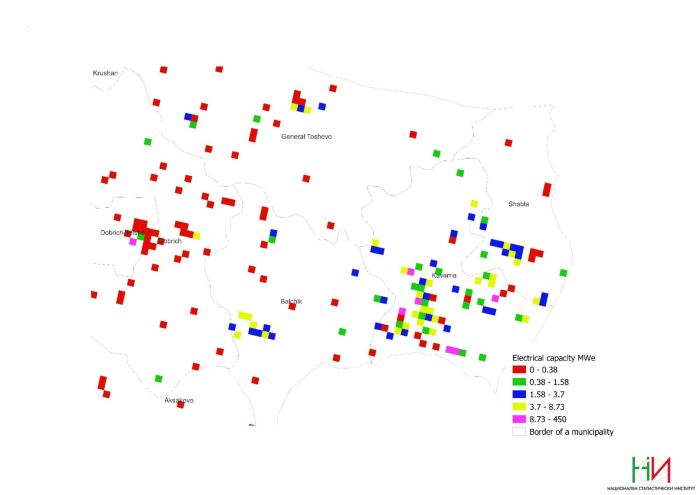
- The coordinates of energy installations for seven renewable sources were provided by the Sustainable energy development agency (SEDA), along with data for their installed power (Megawatts electric (MWe)).
- The Road Infrastructure Agency was the source of map-based information on the road network in 2019. From this, data on seven categories of emissions from road transport were calculated.
- Forest management projects (FMPs) include forest stand descriptions, presented as maps with attributive tables; these are published by the Executive Forest Agency (EFA) and are updated every 10 years. The EFA also provided data about harvested timber for 2018, 2019 and 2020.
- Coordination of Information on the Environment (CORINE) land cover information is the main data source for identifying ecosystem types and presenting their changes. The 44 land cover classes were grouped in nine ecosystem types. The gross and net changes in the ecosystem were calculated for each land cover class and each ecosystem type. Land parcels from the cadastre data were divided into seven groups by main land use and 214 classes according to the permanent use of the property. The land use of these parcels was linked with the CORINE land cover classification.
Results
A tool for spatial presentation and analysis of statistical data was obtained. The grid approach made it possible to combine information from different spatial data sources within 1 km x 1 km grid cells, to be presented on a map or within a database.
The dataset can be extended in the future, for example when a broader set of indicators become available from the 2021 population census.
Administrative contacts with other governmental bodies were established.
Direct access to


