Merging statistics and geospatial information, 2018 projects - Sweden
Delimiting activities zones for Sweden; 2018 project; final report 24 February 2021
This article forms part of Eurostat’s statistical report on the Integration of statistical and geospatial information.
Full article
Problem
Activities zones are needed for Statistics Sweden to be able to enrich the production of official statistics. These data will also be relevant for a wide range of stakeholders in public administrations, academia, private companies providing map services and the general public.
Objectives
Develop a robust method to repeatedly identify, spatially delimit and create official statistics for activities zones in Sweden. Provide a new geography framework to describe and discretely define clusters with different types of economic activity.
- Build on the results from the GeoSTAT 2 and 3 projects. Use of a point-based foundation to merge geospatial and statistical data, most significantly by way of the geocoded business register. Showcase the potential of statistical-geospatial integration following the principles of the global statistical geospatial framework. Streamline geocoded economic data from the business register, land use information and cadastral information from national mapping and cadastral agencies of Nordic countries within the production process.
- Set up a continuous, automated workflow that minimises the need for manual intervention, in particular using a unique national identifier system in administrative data and geospatial reference data.
- Link geospatial data and statistical information from multiple sources and providers to create an entirely new product demonstrating the value of data integration and formalised cooperation between data providers.
- Provide a thorough investigation of the spatial and temporal distribution of statistics, in particular of the economy and its relation to land use.
- Assess the possible inclusion of Earth observation (EO) data in the production process.
Method
Activities zones refer to geographical areas characterised either by a concentration of local units (cluster formation) with a high number of employees in the zone, or by large scale and industrial land use in the zone which has at least one local unit. Large scale and intense land use denotes a typically irreversible use of land, such as a high degree of imperviousness or the presence of industrial or institutional complexes. An activities zone measures at least 3 hectares.
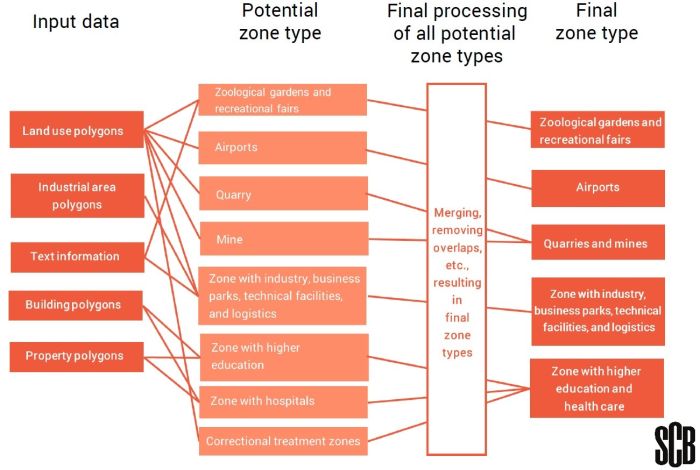
The dataset was produced by combining data for 2015 from the national cadastral map and the Swedish business registry. A tentative list of potential activities zone types was drafted and each potential activities zone type was examined. Five types of activities zones were selected: i) airports ii) quarries and mines iii) zones with higher education and health care iv) zones with industry, business parks, technical facilities and logistics and v) zoological gardens and recreational fairs.
Potential zone types were created.
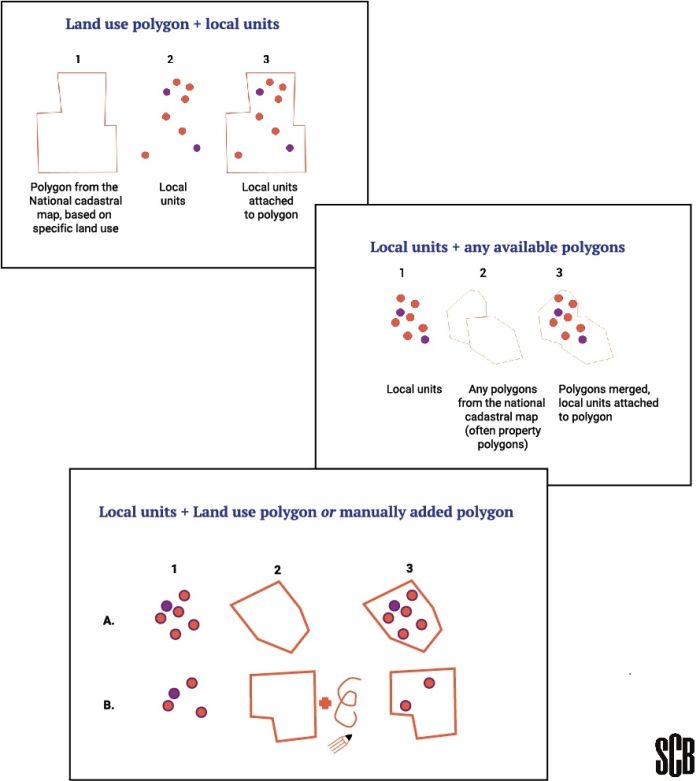
- Local units within a specific activity (based on the NACE classification) were identified along with significant polygons from the national cadastral map with a specific land use.
- Available polygons (property polygons or polygons based on specific land use) were compared with nearby local units.
- The quality of the coordinates of local units was checked and corrected when necessary and missing polygons added.
- Local units were attached to polygons. Potential activities zone types were buffered outwards, then dissolved and finally buffered inwards. This process generalised the boundaries and also merged smaller zones located close to each other into larger polygons. Zones were then clipped if they overlapped with each other or if they overlapped with an existing classification of retail zones.
- The results were checked to be sure that the zones were a minimum size (area and/or number of employees) and were not too mixed, for example with residential housing.
- Statistics were calculated for the zones. These included their area in hectares, the number of local units, the number of employees and the dominant activity of employment. The data for activities zones were aggregated to municipal, regional and national levels.
Results
Two main quality issues were identified, and remedies implemented.
- Some land use polygons in the national cadastral map were not up-to-date or were missing. Relevant local units (clusters) with a lacking polygon were identified and a polygon added (based on orthophotos). Integration of these into the national cadastral map has been discussed with the National Mapping Agency (Lantmäteriet).
- For some local units, there was erroneous or incomplete address information in the business register. The coordinates of the local unit were corrected manually (this concerned local units with around 120 000 employees). Integration of these corrections into other geospatial/statistical products was started.
In theory, the production process is fully automated. However, due to the above-mentioned data quality issues the process requires manual intervention to correct or complement data.
Official statistics based on activities zones for Sweden in 2015 were released. More than 3 400 activities zones were identified including more than 68 000 local units in which more than 1.6 million persons were employed.
Open geodata depicting activities zones were released, containing the geographic boundaries and statistical data for each activities zone.
Direct access to


