Merging statistics and geospatial information, 2017 projects - Estonia
Development of unified indicator for local decision-making; 2017 project; final report March 2020
This article forms part of Eurostat’s statistical report on the Integration of statistical and geospatial information.
Full article
Problem
Representatives of municipalities want to use data to get an overview of the situation in their own municipality and of how this compares with neighbouring municipalities. This need is particularly strong given the 2017 reform of municipalities, with many municipalities merging (the number was reduced from 213 to 79).
Objectives
To identify and calculate spatial indicators to assist evidence and fact-based local and regional decision-making.
Method
The project started with a discussion between the statistical office and representatives from two municipalities – Saaremaa and Setomaa. An overview of statistical indicators was provided, describing their meaning, usefulness, and how they could be used for decision-making. The indicators presented concerned demography, income, public transport, education and youth. There was also interest from the municipalities’ representatives for information on tourism, living standards and conditions, healthcare, economic activity, culture and indigenous people (Setos). The statistical office inquired how data are used within municipalities and what kind of data municipalities consider that they are lacking when decisions are made.
Various indicators and methods were tested, and a consistent methodology was developed for displaying the results spatially. For example, these actions looked at the distribution of the population and the location of various services to investigate accessibility. Possible types of analysis that were explored concerned:
- service areas – distance (both time and location) from the service provider,
- distance analysis – the shortest distance to the service,
- mobility between home and work/school,
- various indices based on accessibility.
A selection of 10 indicators was made for use by municipalities, to be combined into five subindices and an overall index.
| Indicator | Subindex |
|---|---|
| Population change | POPULATION SUBINDEX |
| Share of people aged under 65 | |
| Birth rate per 1 000 women in fertile age (aged 15–49) | |
| Share of people with higher education | INNOVATION SUBINDEX |
| Number of entrepreneurs per 1 000 people | |
| Number of 2nd level EMTAK fields of economic activities | ECONOMIC ACTIVITY SUBINDEX |
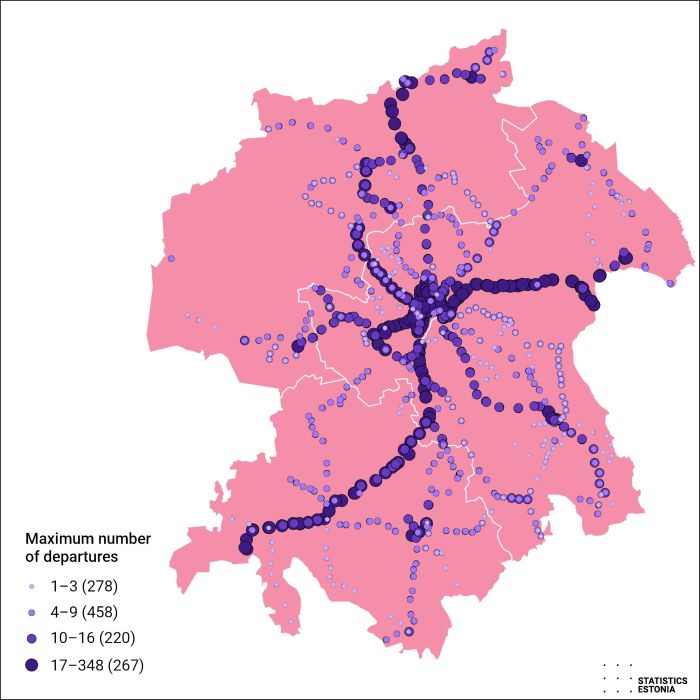
A selection of seven indicators was made for use by a government ministry for assessing services, four for education, and one each for youth centres, sport centres and public transport. Some of these have Sustainable Development Goal (SDG) counterparts. Indicators were produced for all municipalities and territorial communes. A territorial commune is an administrative unit made of villages with a sense of a ‘single community’ or ‘being unified’. In practice, some small islets were excluded from the calculations. Most data were from 2017 and 2018, with some from 2015 or 2016. Depending on needs of municipalities and other users, these data will be updated every few years or even annually.
Results
The selected indicators were compiled and made available in an online map application.
Direct access to

