Merging statistics and geospatial information, 2015 projects - Finland
This article forms part of Eurostat’s statistical report on Merging statistics and geospatial information: 2019 edition.
Final report January 2017
Full article
Problem
A lack of official statistics allowing commuting times and distances to be analysed led to the development of a new database that merged big data and official statistics to provide information on commuting patterns and an experimental model for sustainable commuting.
Objectives
The objective of this project was to conduct a feasibility study for estimating commuting time and distance statistics with traffic sensor implementations: a) comparing a traditional approach with a big data approach for communing time, and b) taking into account public transport to form an annually updated enriched commuting database. The models for the project were built for both commuting time and distance covered by driving, cycling and using public transport within the national network.
Method
This study used extensively a set of population statistics stored in Statistics Finland’s data warehouse, constructed from several administrative datasets and statistical data files. Dwelling and workplace coordinates were updated annually so that the reference period for statistics was the last week of the year; there was a 22-month lag for workplace coordinates. Home and workplace coordinates were available for 92.6 % of employed residents for the last week of 2013: 2 131 914 people were covered by the framework population out of a possible 2 301 751 in the target population. Commuting estimation statistics presented in the study were limited to those commuters having a maximum journey of no more than 200 km in distance by road between their dwelling and their workplace, giving a total study population of 2 092 132 persons, 90.9 % of the target population.
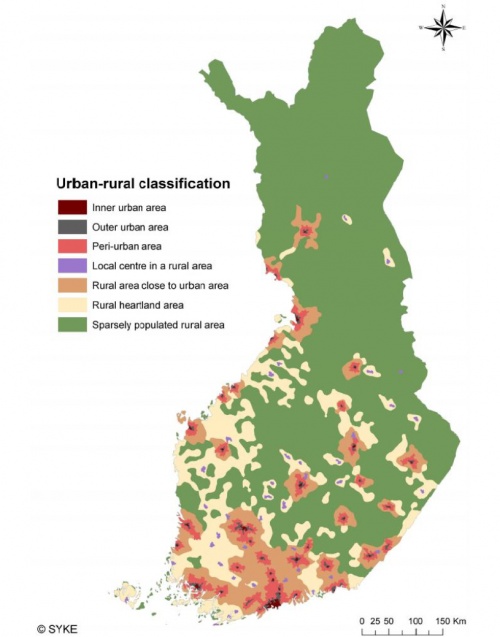
For the presentation of results, use was made of the Finnish Environment Institute’s 2014 urban-rural classification. This was based on 250 m x 250 m grid cells and used seven classes, from sparsely populated rural areas to inner urban areas; these could be grouped into three urban and four rural classes.
Road transport — car and bike
The Finnish Transport Agency (FTA) produces an open national road and street database Digiroad (Digiroad.fi). It contains relatively detailed and accurate data on the location of all roads and streets in Finland, as well as their most important physical features covering a total of 483 thousand km. The dataset is comprehensive in coverage and has a uniform presentation of data; authorities are obliged to update and maintain the data. As the target of the study was the employed population in 2014, September 2014 was selected as the specific target month for these studies as it was outside the principal holiday season. The Digiroad dataset for the fourth quarter of 2014 was used. The FTA also provided data from its systems of automatic traffic measuring devices (hereafter referred to as LAMs), road weather stations, and road weather and surface cameras. The FTA produces official statistics on traffic quantity partly based on the data from LAMs. The target traffic data for this study contained information on average speeds and average numbers of passenger vehicles for each LAM station during a specific time interval of the day, for weekdays between 7 and 8 a.m. over the period from 1 to 26 September 2014.
The speed estimation for using a private car followed a rather complex estimation structure. Speed estimations for each road element were formed by using several feature attributes of the national road and street database (Digiroad.fi), enriched by the FTA’s traffic sensor data. Cycle commuting was modelled in a more straightforward, simplified manner, based on the shortest non-hierarchical paths (including separate cycle paths and excluding motorways). The average speed for cycle commuting was assumed to be 17 km/hour and an upper limit of 40 km was set as the maximum distance for commuting by bike.
Public transport
The estimation of public transport accessibility was implemented by utilising two open application programming interfaces. The Journey Planner service covers Helsinki and its surrounding area whereas Journey.fi offers a wide selection of timetables across the whole country for various means of transport, although some timetables were excluded. These services provided information on public transportation timetables for individual users as well as offering large datasets via application programming interfaces. For each person, the coordinates for their home and workplace (as stored at Statistics Finland) were sent to the HTTP GET interface and in return a public transportation route (length, time, vehicle(s) needed) was received in XML format; these were read and saved to a database. The data collection process from each source lasted several weeks. Data were collected for an arrival time of 8 a.m. on 4 January 2016 (for Journey Planner) or 30 May 2016 (for Journey.fi). Journey Planner was used for people who lived and worked in the Helsinki region, while Journey.fi was used for people who lived or worked outside of the Helsinki region.
Walking routes were also considered, especially for short distances, and it was assumed that the speed for walkers averaged 70 m/minute. Note that the time measured was the time taken between departure and arrival points, and did not include any waiting time before departure or after arrival (if earlier than the planned 8 a.m. arrival time.
Results
A new database was constructed from the results of this work including the following variables: distance and time for commuting by private vehicle, cycling or public transport across the whole country, and for the Helsinki region public transport commuting distances and times. The commuting distance and commuting time were calculated as point-to-point estimates from almost every employed person’s home to a corresponding workplace, with national coverage of approximately 93 %.
Road transport — car
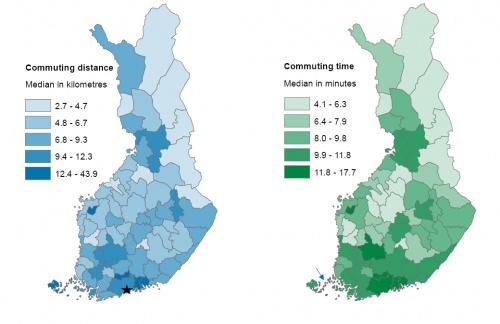
Concerning road travel, the point-to-point linear distance average between the home and workplace was 13.2 km while by road the average was 17.1 km, with an average time of 16.4 minutes. The distribution of the distance travelled was skewed: the median values were 6.0 km linear distance, 8.8 km by road and 11.5 minutes. It was skewed at both ends of the distribution, by a considerable number of short distance commutes, while other commuters sometimes faced lengthy journeys to work. For example, 5.4 % of the framework population had a linear distance between their home and work of less than 100 m.
The Åland Archipelago was a particular case: it has 495 employed persons and their commuting times varied greatly, with some linear routes over 30 km; areas such as this were challenging and required special attention. Other issues occurred when a route could not be found within 300 m of the coordinates of a home or workplace, or where the work or home coordinates were on an island for which there was no registered road or ferry access, or where errors were found in the road network data (such as a dead-end street that was wrongly coded as a one-way street).
The results were presented in a comparative manner by taking into account the urban-rural classification; they show clear differences by region and area type. Many of the more remote areas were characterised by shorter commuting distances, on average, but higher deviations. People living in inner urban areas generally had shorter commuting distances and shorter times to work except in the largest cities: commuters in the Helsinki region, Turku and Tampere all had longer commuting distances and commuting times, with quite a low level of deviation; conversely, the time and distance covered by commuters from regions surrounding the capital of Helsinki had much higher deviations. Peri-urban areas had longer than average commuting time and commuting distance but with relatively small deviations, while commuters from outer urban areas also had a relatively small deviation in the time and length of their commutes, although these tended to be much shorter than for commuters living in peri-urban areas. The longest median commutes were recorded for commuters living in rural areas that were located close to urban areas. In rural heartlands and in sparsely populated rural areas the time and distance covered by commuters had relatively large deviations: in the countryside many people have their workplace next to (or in) their home, but also many have a registered workplace far away.
Road transport — bike
For cycling, the project calculated that half of the working population could cycle to work in 26 minutes or less. A focus on postal code areas in the capital region (Helsinki, Espoo, Vantaa and Kauniainen, which covered 22.6 % of the employed population across the whole nation) showed that distances and commuting times clearly increased away from city centre locations on the southern coast.
Public transport
Journey Planner returned results for 98.8 % of people for whom a pair of coordinates was available, 90.6 % of all employed persons. Journey.fi returned results for 64.9 % of people for whom a pair of coordinates was available, 58.8 % of all employed persons. The results for commuting by public transport were compared with the results for commuting by car with the expectation that they would in all cases be at least as long: in 0.1 % of the cases computed using Journey Planner the commuting route by public transport was at least three times as long (as that for commuting by car) while for Journey.fi this share was 0.9 %. After analysing surprisingly long commuting times and distances for the municipality of Sipoo, these results were excluded as some public transport lines in Sipoo were not available in the journey planning applications and there were errors for some of the transport options; the identification of some errors for this municipality indicated that there could be similar but less obvious errors elsewhere.
The results (particularly for commuting times) were believed to be biased upwards by the inclusion of walking results when no public transport route was found (which in some cases may reflect missing information for available routes), and this was particularly notable for the Åland Islands. Considerably fewer than 1 in 10 of the results from Journey Planner were walking routes, whereas more than one third of the routes from Journey.fi included walking (either a walking route or missing data).
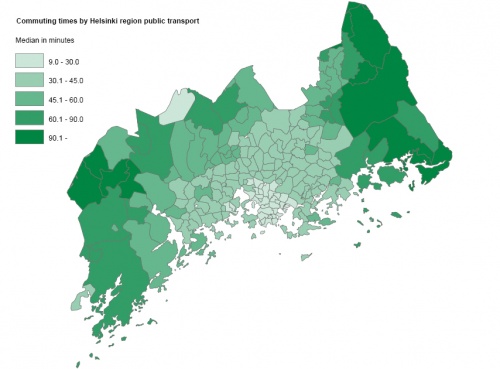
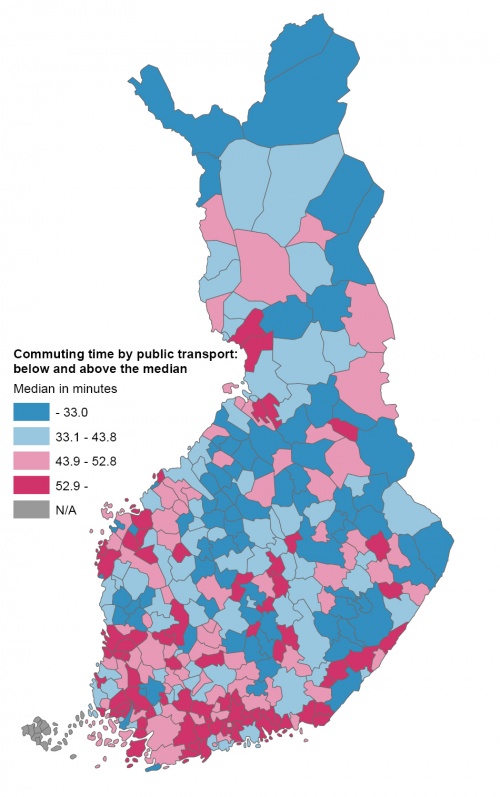
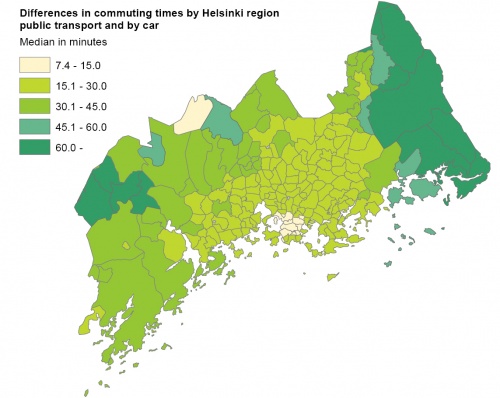
Public transportation distances and times were found to be longer in the Helsinki region. In other parts of the country there was a large variance, suggesting that there was a mixture of a relatively high number of very short commuting distances (to farms and small businesses, for example) and some very long commutes to workplaces; these results were similar to those recorded for commuting by car.
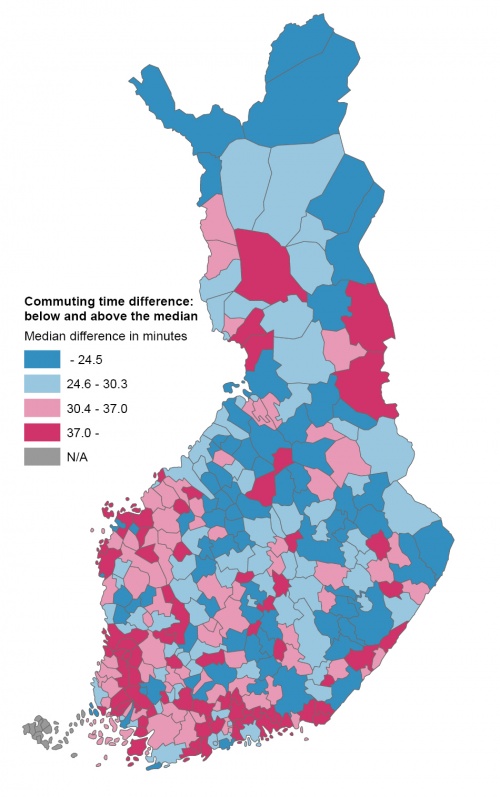
In southern Finland, travelling/commuting times were generally longer than elsewhere in the country. Based on Journey.fi data, the commuting distance from other cities to Helsinki was longer than the median commuting distance to other cities.
Comparison of road and public transport
Comparisons between different transport modes were complicated by a number of factors. The analysis based on public transport might have been hampered by missing information and the strict use of an 8 a.m. arrival time: in case of sparse public transport networks commuters may in reality arrive somewhat earlier or later to take advantage of better routes or (infrequent) connections. Furthermore, the public transport times do not allow extra time for people who arrive early for the first part of their journey. Equally, the analysis by car does not allow for any time to walk to or from the car or any time to find a parking place (which may not be parked directly at home or the workplace), and may always suffer from failing to take sufficient account of congestion and/or traffic controls, particularly in town and city centres during peak travelling times.
An analysis for three transport modes — car, public transport and bicycle — was performed for people living and working in the towns and city covered by the Helsinki Regional Transport Authority. For Helsinki and four of the six other towns in this area, median commuting times were lower for cycling than they were for public transport. In Helsinki and all six towns, cars had the lowest average commuting times, although this may be influenced by the model assuming that commuters by car could travel at average speeds of 20 km/h (which may be too high for such peak travel times, especially in some congested areas).
A second analysis was based on national results: it clearly showed differences in commuting times between the use of public transport and private vehicles for all areas.
Experimental model for commuting
An experimental model for sustainable commuting was presented as an example of a possible application of this data. This assumed that: i) journeys below 1 km would be made by foot ii) journeys between 1 km and 8.5 km would be made on a bicycle (the upper limit representing 30 minutes of cycling); iii) journeys over 8.5 km would be made using public transport if the journey could be completed in no more than 30 minutes longer than would be required by car and iv) the remainder of the journeys would be made by car. With this model, a median commuting time was estimated at 17.6 minutes, compared with 11.5 minutes if just using a car, with the model estimating that just over one third (36.8 %) of all commuters would use a car, with the remainder using one of the other three transport modes; the relatively high share of car users may reflect, at least to some extent, a potential weakness in the coverage of data for public transport.
Direct access to
Methodology

