Merging statistics and geospatial information, 2014 projects - Estonia
This article forms part of Eurostat’s statistical report on Merging statistics and geospatial information: 2019 edition.
Final report December 2016
Full article
Problem
There was no harmonised system to help generate a complete list of addresses for various statistical units. There was a lack of development for spatial analyses, for example, a methodology to disseminate statistics on economic and agricultural units through linking statistical information to geodata on economic units and agricultural holdings.
Objectives
Action 1: to improve the integration of spatial information and geo-referencing in the statistical production process (including survey design).
Action 2: to illustrate how linking geo- and statistical information and corresponding metadata may provide additional value and create new information.
Method
Action 1: during the project, data for statistical units in the statistical business and farm registers (SBR and SFR respectively) were geo-referenced. This initially involved: i) cleaning the addresses, for example to correct non-valid addresses or to add missing EHAK (the classification of Estonian administrative units and settlements) codes; ii) normalising the addresses to follow precise spelling and punctuation rules and to impose a specific structure made-up of eight components, and; iii) matching the addresses to an existing (but still under development) address data system (ADS). As such, a methodology for the treatment of non-valid addresses was developed and implemented. Cooperation with the Estonian Land Register (responsible for ADS) on the treatment of non-valid addresses in ADS continued.
A methodology was developed to create and update an integrated statistical population register for use as a frame for demographic statistics, household surveys and a register-based population census. The results of the 2011 population and housing census were adjusted for under-coverage using model-based estimates. The database was then updated annually based on registered changes, such as for births, deaths or migration (the latter covering all address changes). In 2016, the method of updating was changed to tackle problems of over-coverage resulting from incorrect migration information. The new system was based on integrating information from 14 administrative registers to look for so-called ‘signs of life’. Each person was then assigned an index based on the number of registers which recorded signs of life and those with a low index value were assumed to no longer be residents.
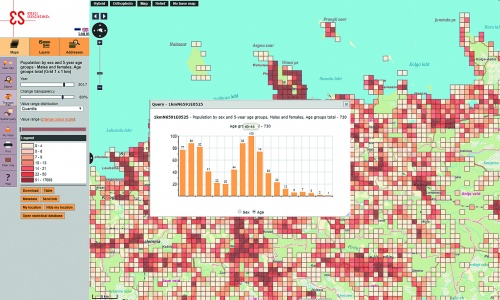
A population database (as of 1 January 2016) was created including every person’s place of residence with their full address linked to the land register (ADS). Where an address could not be linked to a place of residence it was linked to the centroid of a settlement. A 1 km² grid map of the population analysed by sex and by age group was produced and released through an application based on a statistical map.
Action 2: the geo-referencing of all data in the SBR and SFR made it possible to develop a system of spatial analyses and publications for data on the business population, business demography and the agricultural population. Note that data for business units were assigned to the economic unit’s legal address — rather than local units — for reasons of data availability; this was explained in the accompanying metadata. Equally, farm land and buildings may be dispersed across multiple grid cells or administrative or statistical units, and therefore data for each farm was assigned to the central point of each holding. The data on economic units derived from the SBR were presented in maps, both online and in publications. The dissemination of geo-referenced data on agricultural was tested but not implemented; this included the production of maps based on a 1 km² grid showing the number of holdings in each grid cell as well as the average age of natural persons who were farm holders within each grid cell. Before publishing such information, some issues of confidentiality needed to be addressed.
Methods were developed in order to publish data for grid cells. Point-based statistical data were aggregated for grid cells based on linking coordinates with individual grid cells. These data were treated for confidentiality and metadata was also prepared.
Results
The integration of spatial information and geo-referencing in the statistical production process was improved. Statistical business and farm register were fully linked to the ADS and through this the geo-referencing of data for statistical units in each of these registers was completed.
National population grid data were updated following the population and housing census for 2011 and a map of the population grid was published.
Adding value was demonstrated by illustrating the possibility of creating new information through linking geo- and statistical information and corresponding metadata. The basis for spatial analyses and a methodology for the dissemination of statistics on economic and agricultural units through a map application were developed.
New maps were displayed in the map application, based on 1 km² grid cells.
Direct access to

