Merging statistics and geospatial information, 2013 projects - Italy
This article forms part of Eurostat’s statistical report on Merging statistics and geospatial information: 2019 edition.
Final report 15 September 2016
Full article
Problem
A lack of information meant that it was not possible to visualise or analyse migratory flows into Italy from specific provinces of non-member countries (countries outside the EU) or to analyse the various areas in Italy where migrants from different countries were most inclined to settle.
Objectives
The main objectives of this project were to put in place systems to identify, map and analyse migrant flows into Italy of people from non-member countries. Using data collected from new applications for residence permits, the Italian Ministry of Interior managed a database covering the period 2012-2015 which contained information on each new migrant’s place of birth.
In order to make efficient use of this information, the project identified four main activities, to:
- normalise the place names used for the birthplaces of migrants originating from the 20 most common partner countries;
- geo-code information pertaining to each migrant’s place of birth;
- produce a set of maps detailing the birthplaces of migrants and their place of residence in Italy;
- organise a workshop so that the results could be presented, explaining how the quality of data might be improved and how tools developed during the project might be reused either by other countries wishing to conduct similar analyses or by different actors within Italy (for example, other ministries or statistical bodies).
Method
The starting point for the project was the database on new residence permits, which provided a source of information for detailing the birthplace of migrants arriving in Italy in terms of the country from which they came and the name of the city/town/village where they had been born. A decision was taken to perform an initial analysis for the 20 non-member countries that had the highest number of citizens arriving in Italy during the period 2012-2015. The top five partner countries during this period were Morocco, China, Albania, India and Bangladesh.
A normalisation process was designed so that the same birthplace names could be identified and used for each of the reference years. The first step was to create a unique table covering all four reference periods. Thereafter, superfluous or sensitive information was removed from the table to reduce its size and to make data processing more efficient, leaving a table structure that was composed of: migrant_ID, sex, country code, country name, birthplace, reference year.
Thereafter, the data was geo-coded — this operation was carried out directly within OpenRefine (a desktop application used for cleaning and transforming data sets). For the vast majority of the 20 partner countries there was a relatively small loss of information when normalising and geo-coding data entries: for example, the success rate for coding records for migrants originating from Morocco was 95.7 % and success rates of more than 90 % were recorded for most of the other partners. In a small number of cases records were lost as a result of the birthplace being such a small place that it was not contained in the Geonames database. Furthermore, there was a relatively low rate of success for normalising and geo-coding information on migrants originating from Ukraine, Moldova and Russia, where close to half of all records were discarded (this was often due to Cyrillic characters being employed or information on the birthplace being replaced by the country of birth).
Results
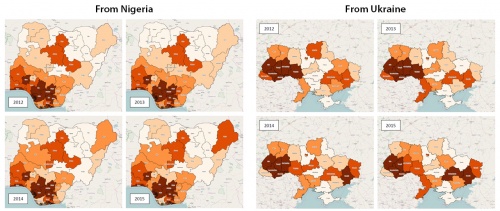
Having processed the data, the next step was to produce maps for each of the 20 partners and the four reference years. The maps detailed the flow of migrants to Italy from local administrative areas. In some cases there was little fluctuation in the flows between different years, although there were some specific cases where large fluctuations could be seen — often resulting from socioeconomic and/or political crises — for example, there was a considerable increase in the number of migrants moving from north-east Nigeria to Italy in 2014-2015 (which could be linked to increased levels of unrest in the area associated with the terrorist activities), while there was also a sizeable increase in the flow of migrants from eastern provinces of Ukraine (following the conflict with Russia).
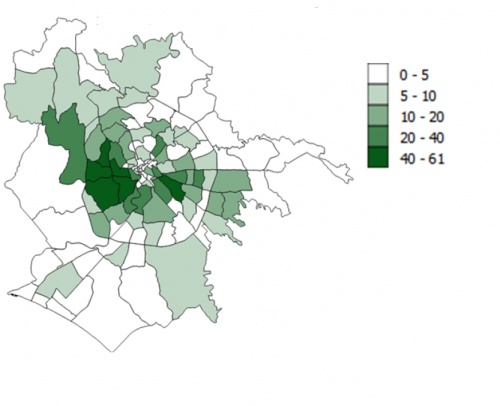
Alongside maps representing the origins of migrants who made their way to Italy, the data set was also used to construct information concerning geographic poles of migrant residence, highlighting specific (neighbourhoods of large) cities where migrants from a particular country tended to settle.
The final task carried out under this project was the organisation of a workshop in June 2016 to present the main results and to provide an opportunity for sharing knowledge, ideas and new perspectives that might be adopted when analysing migration flows.
Direct access to


