Merging statistics and geospatial information, 2013 projects - Finland
This article forms part of Eurostat’s statistical report on Merging statistics and geospatial information: 2019 edition.
Final report 29 January 2016
Full article
Problem
Traditionally, the compilation of small area statistics was an activity for which Statistics Finland charged a fee. New standards and technological developments led to a decision being taken to explore the possibility of providing these statistics for spatial analysis as free, open data.
Objectives
This project was carried out in cooperation between Statistics Finland and the National Land Survey of Finland during 2014 and 2015. Its principal aim was to implement an open source web application enabling the spatial analysis of data through an easy-to-use and innovative web application that was based on the use of spatial data infrastructure via INSPIRE-compatible web feature services (WFS) and web map services (WMS) providing direct access for reading, writing and updating data and for the transformation of data into maps.
Method
A web application was built using Oskari (open source software with a dual European Union Public Licence (EUPL) and Massachusetts Institute of Technology (MIT) license). It was developed to make using spatial data infrastructures easier, through providing tools and functionalities for distributing geostatistical information and analyses, such as allowing users to define their own maps and to embed and distribute these across their own websites.
Paikkatietoikkuna is a geoportal: it is an application developed through case story examples that were given to the project development team to stimulate improvements. One example of such a case story was: ”As a user I want to find out how many people live in the vicinity of a point feature. I want to be able to select the point by clicking on the map or by giving an address. I want to create a buffer around the chosen point and aggregate the total amount of people living inside the grid cells falling inside the created buffer area. Later I want to save and publish the results on my own map.”
As a result, the goals and aims of the project included, to:
- increase the usability of grid-based statistics (and later small area statistics);
- illustrate how the integration of geospatial and statistical information may be used to provide added value by creating new information;
- offer spatial analysis tools within a web application.
At the start of the project a decision was taken to base development work on employing INSPIRE data specifications, metadata, service sharing and geo-server technologies. As such, data were collected only once and kept in a single location where they could be maintained most effectively. The data was structured and documented so that it could be combined seamlessly with other spatial information from different sources and shared with various users and across applications. The data was stored so that information collected at one level could be shared, analysed and published at other (more highly aggregated) levels. A set of information was made readily available, allowing users to easily find what geographic information was available, how it might meet their particular needs and under which conditions it could be used.
The data sets collated as part of this project included:
- municipality-based statistical units;
- population by municipality-based units;
- educational institutions;
- industrial facilities;
- 1 km² grid statistics.
Results
Upon completion of the development work, the application was able to provide functionalities for analysis, user-defined buffer sizes, descriptive statistics, unions (the joining together of selected features into one unique feature), clipping (user-defined clipping layers to restrict/filter results), geometric filters (allowing partial or total intersections of layers), difference analysis between unique map layers (for example, subtracting the population of one period from the population of another), or heat maps.
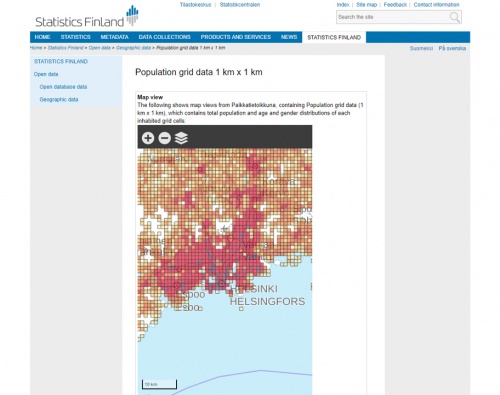
Users may log-in to the application and build customised maps from various data layers. If the resulting map is saved it can then be embedded into a webpage by means of an http link created for each user-defined map. Such maps are dynamic insofar as anyone who visits the link can move the focus of the map, zoom the map, or click on various map features to obtain more information, or edit the information displayed so that it caters for their own analytical needs.
An example is provided as to how a dynamic, embedded map can be presented. It is based on information published on Statistics Finland’s own website. The example shows an extract of the same data presented in Figure 2.
Through the development of Paikkatietoikkuna, an opportunity has been provided for users to visualise Statistics Finland’s geospatial data. One downside, identified upon completion of the project, was the need to make the interface more user-friendly, as it was considered to cater principally for professional users who already had some prior experience of using spatial analysis tools.
Direct access to


