Merging statistics and geospatial information, 2013 projects - Austria
This article forms part of Eurostat’s statistical report on Merging statistics and geospatial information: 2019 edition.
Final report February 2016
Full article
Problem
From 2011, variables on individual commuting patterns — such as commuting time or distance travelled — ceased to be available within the Austrian statistical system as Statistics Austria moved to a register-based census. Initial attempts to estimate variables for measuring commuting had implausible results, leading to a search for new methods.
Objectives
The goal of the project was to develop a set of methods to improve the quality of estimates for various measures of commuting. The population census provided a record — for each person — detailing where they lived (through a building_ID for their home address) and where they worked or went to school (through a work_ID or school_ID), supplemented by information for each individual’s economic activity status and other demographic data.
Method
The project was based on using ArcGIS10.1 software with a network analyst extension. TomTom was chosen as the data source for information on streets and routing with an in-house solution to detail numerous variables on each street (such as one-way streets, types of road, speed limits, or whether the road was in the countryside or a built-up area). The model builder and scripts were developed in Python 2.7 with SQL-scripts for tabular results.
Commuters were defined, for the purpose of this project, as employed or self-employed persons as well as pupils or students, who travelled between their place of residence and their place of work or education. As such, unemployed and other economically inactive people, as well as those who worked from home were excluded. Furthermore, people living in Austria and working abroad or people living abroad and working in Austria — frontier workers — were also removed from the population under consideration (as information on their foreign address was not always available).
The buildings and dwellings register (BDR) run by Statistik Austria contained information on the details of land, buildings and dwellings as well as structural data, such as the x,y coordinates of each building. It was combined with other data sources, such as the central register of residents, tax registers or education registers to encode personal_IDs and building_IDs that were geo-referenced.
To make use of the data from various registers, these tables had to be joined through the use of scripts so that commuting journeys made by approximately 4.3 million out of 8.4 million Austrian residents could be analysed in more detail. The coordinates for building_IDs were extracted and re-projected to allow them to be used with other data sources and the street network system, with the main goal being to model distances travelled and commuting times for each commuter.
There were several issues encountered when trying to perform this task:
- some pairs of destinations had zero distance when commuters were found to live and work on the same stretch of road;
- some buildings had the wrong coordinates (for example, the coordinates of a primary school in Vienna were found to be more than 15 km away from their true location);
- some minor alpine, forestry or private roads were found to be missing from the road network;
- some buildings were found to be located up to 5 km from the nearest road;
- transit routes through neighbouring countries were ignored in favour of the national road network.
Otherwise, it was a relatively easy task to calculate the shortest route for each commuting pair, whereas it was more difficult to model the optimised route and the driving time required. This difficulty resulted from a lack of information on speed profiles for various stretches of road from TomTom, so a model had to be developed to provide a realistic estimate of driving times (this was based on road conditions that were neither congested nor totally clear). To improve the model, a fictive set of routes was calculated using various routing engines and the results from these were used as the basis for further calibration, care being taken to select a representative sample of fictive routes that covered routes to/from and across built-up areas, suburbs and the countryside.
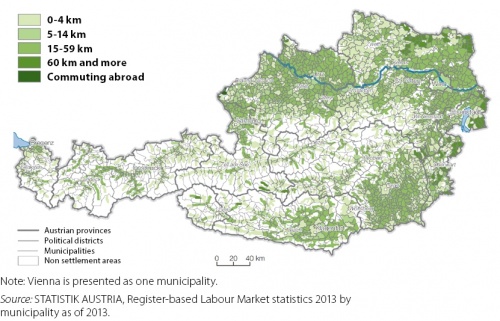
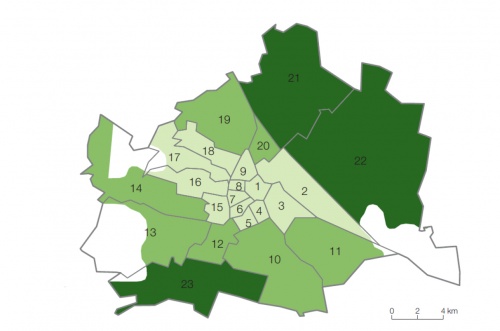
With the data, the street network and a speed model prepared, the next challenge was to find the fastest routes for the 4.27 million commuters, a task that required considerable computing power and a lengthy period of time for the scripts to be run. Once the results had been obtained, attention turned to how best to disseminate the information and aggregate house-to-house information to identify commuting zone matrices, identifying in-commuting zones (clusters of high workplace density) and out-commuting zones (residential, suburban areas).
Results
The results obtained for commuting distances and commuting times were tested and found to work well. On the other hand, identifying the optimal level of detail for analysing commuting matrices was less clear.
The work carried out as part of this project, including the algorithms created, may be reused in years to come or alternatively by statistical entities in other EU Member States, as Statistik Austria documented both the routing model and the scripts.
Direct access to


