Intra-EU trade in goods - main features
Data from March 2023
Planned update: 4 June 2024
Highlights
Trade among EU countries as a share of total trade in goods ranged from just over 27 % for Cyprus to 81 % for Luxembourg in 2022.
Four fifths of total exports of goods within the EU in 2022 were manufactured products.
Exports of goods to other Member States, 2022
This article takes a close look at recent trends, focusing on total intra-EU trade in goods and the most traded products. It presents statistics for the EU aggregate and for individual Member States for the period covering 2002 to 2022.
Statistics on international trade in goods between Member States of the European Union (EU)- especially the size and evolution of imports and exports - enable the EU and national authorities to evaluate the growth of the Single Market and the integration of EU economies. These statistics also provide EU businesses with essential information for their sales and marketing policies.
This article is part of an online publication providing recent statistics on international trade in goods, covering information on the EU's main partners, main products traded, specific characteristics of trade as well as background information.
Full article
Evolution of intra-EU trade in goods
The seasonally adjusted value of monthly total exports of goods for EU Member States to other Member States is shown in Figure 1. Between January 2002 and December 2022 exports of goods increased from €120 billion to €363 billion. There was a sharp decrease in the value of exports of goods from September 2008 to May 2009. Following this decline the value of exports of goods began to increase again. Due to the COVID-19 pandemic, exports dropped dramatically between February 2020 and April 2020. However, by December 2022 they were well above pre-pandemic levels.

(€ billion)
Source: Eurostat (ext_st_eu27sitc)
Since the introduction of the Intrastat data collection system for intra-EU trade in goods on 1 January 1993, the value of intra-EU exports of goods has been consistently higher than that of intra-EU imports of goods. In theory, as intra-EU exports of goods are declared FOB-type value and intra-EU imports of goods CIF-type value, the value of intra-EU imports of goods should be slightly higher than that of intra-EU exports of goods. The analysis presented in this article considers intra-EU exports of goods only, as it is the more reliable measure of total intra-EU trade in goods since, at aggregated levels, total intra-EU exports of goods has better coverage than total intra-EU imports of goods.
Intra-EU trade in goods by Member State
There is a wide variation in the value of exports of goods by Member State to partners within the EU (Figure 2a). In 2022, the value of export trade in goods within the EU ranged from €863 billion for Germany to just over €1 billion for Cyprus. There were seven Member States (Germany, Netherlands, Belgium, Italy, France, Poland and Spain) whose exports of goods to partners in the EU were more than €200 billion in 2020, accounting for 73 % of the total value of intra-EU exports of goods.
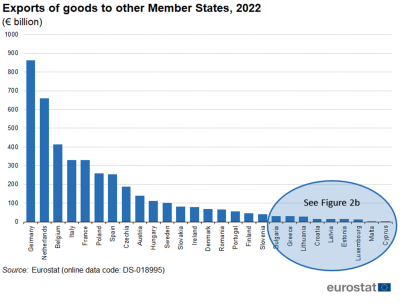
Figure 2a: Exports of goods to other Member States, 2022
(€ billion)
Source: Eurostat - Comext DS-018995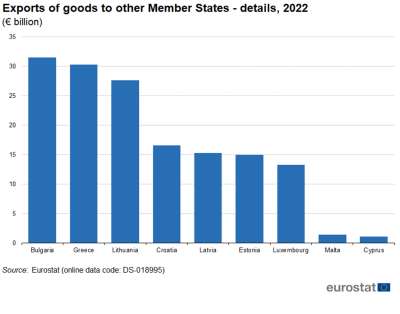
Figure 2b: Exports of goods to other Member States - details, 2022
(€ billion)
Source: Eurostat - Comext DS-018995


Between 2002 and 2022, the value of exports of goods to partners in the EU increased more than 10 % annually in average in four countries: Latvia (11.9 %), Lithuania (11.5 %), Bulgaria (11.3 %) and Poland (10.8 %). In 13 of the remaining 23 Member States annual average growth was between 5 % and 10 % and in 10 below 5 %. Member States in Eastern Europe tended to have higher growth rates. (Table 1)

(€ billion and %)
Source: Eurostat - Comext DS-018995
In 22 Member States the top three partners account for over 50 % of exports within the EU (Figure 3). For a further four Member States the top three partners have between 40 % and 50 % of exports within the EU. Only in Germany (37 %) is this share below 40 %. Germany appeared most often (24 times) as a top three partner; France (11 times) and Italy (9 times) were the next two popular partners.

(share of total Intra-EU exports of goods)
Source: Eurostat - Comext DS-018995
Intra-EU trade in goods balance
It can be difficult to interpret figures in absolute terms for individual Member States. In particular their trade in goods balances must be interpreted with caution for the phenomenon of quasi-transit.
In 2022, ten Member States had a trade surplus (Figure 4a). The surplus was highest in the Netherlands (€328.6 billion). It was also above €10 billion in Belgium (€64.4 billion), Ireland (€32.0 billion), Poland (€27.7 billion), Czechia (€25.5 billion) and Spain (€16.3 billion). There were 17 Member States with a trade deficit. The deficit was highest in France (€150.0 billion). It was also at least €10 billion in Germany (€48.1 billion), Austria (€25.5 billion), Romania (€22.9 billion), Portugal (€20.7 billion), Sweden (€20.2 billion), Finland (€14.6 billion), Croatia (€12.8 billion) and Denmark (€12.5 billion). In 12 Member States the trade balance was between +€10 billion and -€10 billion (Figure 4b).
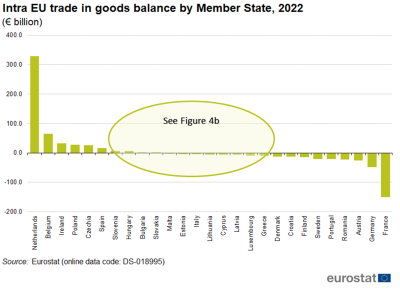
Figure 4a: Intra-EU trade in goods balance by Member State, 2022
(€ billion)
Source: Eurostat - Comext DS-018995
Figure 4b: Intra-EU trade in goods balance by Member State - details, 2022
(€ billion)
Source: Eurostat - Comext DS-018995


In 2002, 18 Member States had a trade deficit for intra EU trade in goods (Table 2). In Bulgaria, Spain, Poland and Slovenia this had changed to a surplus by 2022. In 2002, nine Member States had a trade surplus for intra EU trade in goods. In Germany, Denmark and Finland this changed to a deficit by 2022.

In 2022, the Netherlands, which had the highest trade surplus in absolute terms, had also the highest ratio of exports to imports (199) followed by Ireland (167) see Table 3. France, which had the highest trade deficit in absolute terms, ranked 22nd for its ratio of exports to imports. Its ratio of 69 was higher than or equal to that of Latvia (69), Luxembourg (58), Croatia (56), Malta (29) and Cyprus (16) which all had a lower deficit in absolute terms than France.

(%)
Source: Eurostat - goods/data/database Comext DS-018995
Table 4 considers the trade relationship of individual Member States with non-EU partners to add further context to the interpretation of intra-EU trade in goods balances. It shows the ratio of 'goods exports divided by goods imports' by Member State for trade with non-EU partners. In 2022 this ratio was highest in Denmark (137), Ireland (136) and Lithuania (127) and lowest in Greece (46), the Netherlands (50) and Malta (51).

(%)
Source: Eurostat - Comext DS-018995
Comparing Table 3 and Table 4, there were nine Member States (Greece, France, Croatia, Italy, Cyprus, Lithuania, Malta, Portugal and Romania) with a trade deficit in both intra- and extra-EU trade in 2022, indicated in the Tables 3 and 4 by a value below 100 %. There were nine Member States (Belgium, Czechia, Spain, Hungary, the Netherlands, Poland, Slovenia and Slovakia) with a surplus - indicated by a value above 100 % in Table 3 - in intra-EU trade, but a deficit in extra-EU trade. There were eight Member States (Denmark, Germany, Estonia, Latvia, Luxembourg, Austria, Finland and Sweden) with a deficit in intra-EU trade, but a surplus in extra-EU trade. Finally, only Ireland had a trade surplus in both tables.
When considering the trade relationships between a country and its trading partners, consideration must also be given to, trade in services to get a more complete picture. See for example the recent article on Trade in Services.
Intra-EU trade in goods compared with extra-EU trade in goods
In 2022, 15 Member States had a ratio of total exports to total imports between 80 % and 120 % (Table 5). Eight Member States (Greece, France, Croatia, Cyprus, Luxembourg, Malta, Portugal and Romania) had a ratio of less than 80 %, while only Ireland had a ratio of more than 120 %.

(%, total = intra-EU + extra-EU)
Source: Eurostat - Comext DS-018995
In 2022, most Member States had a share of intra-EU exports between 50 % and 75 % (Figure 5). It was above 75 % in Poland (76 %), Hungary (78 %), Slovakia (80 %), Luxembourg (81 %) and Czechia (both 82 %). Only in Cyprus (26 %), Ireland (39 %) and Malta (45 %) was the share of intra-EU exports lower than 50 %, meaning extra-EU exports were higher than intra-EU exports.

The unweighted average ratio for Member States of intra-EU exports to extra-EU exports decreased by 15 percentage points (pp) between 2002 and 2022 (Table 6). The ratio decreased in fourteen Member States. The largest decreases were in Slovakia (-306 pp), Slovenia (-129 pp) and Estonia (-103 pp). The ratio increased in thirteen Member States. The largest increases were in Bulgaria, Romania (both 45 pp) and Lithuania (41 pp).

(%)
Source: Eurostat - Comext DS-018995
Intra-EU trade in goods by main product groups
Figure 6 shows the share in intra-EU exports of goods by product type. Between 2002 and 2022, the share increased for Energy (+6 pp), Chemicals (+4 pp), Food, drinks and tobacco and Raw materials (+1 pp). It decreased for Machinery & vehicles (-8 pp), Other manufactured goods (-3 pp) and Other goods (-1 pp).

(%)
Source: Eurostat - Comext DS-018995
In 2022, in all Member States the share of manufactured goods was higher than the share of primary goods although there were considerable differences between Member States. In Ireland (9.8), Czechia (8.7) and Slovakia (8.6) the share of manufactured goods was more than eight times as high as the share of primary goods, while ratios below two were found in Lithuania (2.0), Latvia (1.9), Cyprus (1.6) and Greece (1.5).

(%)
Source: Eurostat - Comext DS-018995
Source data for tables and graphs
Data sources
EU international trade data comes from Eurostat’s COMEXT database.
COMEXT is the Eurostat reference database for international trade in goods. It provides access not only to both recent and historical data from the EU Member States but also to statistics of a significant number of non-EU countries. International trade aggregated and detailed statistics disseminated from Eurostat website are compiled from COMEXT data according to a monthly process. Because COMEXT is updated on a daily basis, data published on the website may differ from data stored in COMEXT in case of recent revisions.
Information on intra-EU trade is collected by the EU Member States using the various media placed at the disposal of the information providers. These may be paper or electronic declarations provided for at national level. The declarations are addressed directly to the competent national administrations.
European statistics on international trade in goods are compiled according to the EU concepts and definitions and may, therefore, differ from national data published by Member States.
Context
The EU's single or internal market is a market where goods, services, capital and people can circulate freely. The free movement of goods principle requires that national barriers to the free movement of goods within the EU be removed. Articles 34 to 36 of the Treaty of the functioning of the European Union prohibit quantitative restrictions on imports, exports or goods in transit and all similar restrictive measures between member countries. All measures capable of hindering directly or indirectly such imports are considered to be quantitative restrictions.
Additionally, because the 27 Member States of the European Union share a single market and a single external border, they also have a single trade policy. Both in the World Trade Organization, where the rules of international trade are agreed and enforced, and with individual trading partners, EU Member States speak and negotiate collectively.
The importance of the EU’s internal market is underlined by the fact that the proportion of intra-EU trade in goods is higher than extra-EU trade in goods in most EU Member States with few exceptions. The variation in the proportion of total trade in goods accounted for by intra-EU trade reflects to some degree historical ties and geographical location.
Direct access to