Employment statistics - utilisation of job skills
Data extracted in June 2023.
No update foreseen since data are based on an ad hoc subject module.
Highlights
In 2022, nearly 30 % of employed people in the EU aged 15-74 reported using digital devices for the entirety or most of their working time.
With 46.6 %, Luxembourg had the highest share of employed people aged 15-74 in the EU in 2022 who spent all or most of their working time using digital devices, followed by the Netherlands and Sweden, with percentages also exceeding 40 %.

This article provides an overview of skills used at work and their respective time allocations. It explores various aspects, including the use of digital devices, engagement in physically demanding tasks, tasks involving finger dexterity, performing relatively complex calculations, and reading work-related documents. The statistics presented in this article are derived from the ad hoc subject module on job skills conducted as part of the EU labour force survey (EU-LFS) in 2022. The data encompass the European Union (EU) as a whole, its Member States, and two European Free Trade Association (EFTA) countries, Norway and Switzerland.
Full article
Time spent on using digital devices
Figure 1 illustrates the distribution of employed people in the EU by the volume of working time spent using digital devices for work purposes. This encompasses the use of computers, tablets, phablets, and smartphones for work-related tasks. Phone calls are excluded.
In 2022, nearly 30 % of employed people aged 15-74 reported using digital devices for the entirety or most of their working time. For both men and women, this percentage reaches its highest point within the 30-44 age group, then declines for those aged 45-59 and 60-74. Notably, women exhibited higher shares than men, particularly in the 30-44 age group.
.png)
Shifting the focus to the age group of 25-74, Figure 2 highlights that the share of employed people using digital devices during all or most of their working time increases with the level of education. This applies to both men and women. However, when comparing sexes, among people with low or medium levels of education, women tend to report higher shares in this regard than men. However, the situation changes among those with high education, where the percentage of men is larger than that of women.

At country level, with 46.6 %, Luxembourg had the highest share of employed people who spent all or most of their working time using digital devices (see Figure 3 pertaining to the age group 15-74 years). The Netherlands and Sweden followed, with percentages also exceeding 40 %. Conversely, Hungary, Slovakia, Greece, Bulgaria, and Romania had the lowest rates, with less than 20 % of employed people using digital devices during all or most of their working time. Moreover, in Bulgaria and Romania, 47.2 % and 56.7 %, respectively, reported not using digital devices at all during their working hours.
.png)
Time spent on manual tasks
In 2022, roughly one in six employed people aged 15 to 74 in the EU were all or most of their working time engaged in manual tasks that entail intense muscular power, also referred to as hard physical work. Notably, this share was significantly higher among men than women, particularly within the 15-29 age group (see Figure 4).
When analysing age groups separately for men and women, distinct patterns emerge. Among men, the highest percentage of employed people involved in hard physical work all or most of their working time is found within the 15-29 age group, whereas the lowest percentage is observed among the 60-74 age group. The corresponding percentage among women peaks in the 45-59 age group and is lowest for the 30-44 age group.

Figure 5 illustrates the distribution of employed people at EU level, categorised by sex and age, based on the amount of time they spent on tasks requiring finger dexterity. Examples of such tasks include drawing or repairing objects. Activities like typing (on a keyboard or smartphone) and handwriting are excluded.
The data from Figure 5 reveal that a higher percentage of men were engaged in tasks involving finger dexterity for all or most of their working time compared with women, although the disparities are not significant. When comparing different age groups, for men, those aged 15-29 years reported the highest share of employed men utilising finger dexterity for all or most of their working time. On the other hand, women displayed the highest shares in the age groups of 15-29 years and 45-49 years, with equal percentages. In both sexes, the age group of 60-74 years exhibited lower percentages compared with the younger age groups.

Figures 6 and 7 show a strong correlation between educational attainment and the extent of engagement in physically demanding work or tasks that require finger dexterity. This applies to both sexes. As people attain higher levels of education, there is a significant decrease in the percentage of those primarily engaged in these types of work. This association becomes even more pronounced when examining physically demanding work, particularly among men. The percentage of men with a low level of education engaged in hard physical work for all or most of their working time is nearly seven times higher than that of men with a high level of education.
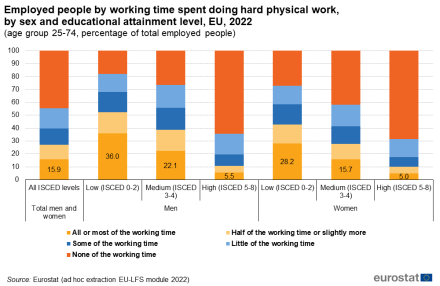
Figure 6: Employed people by working time spent doing hard physical work, by sex and educational attainment level, EU, 2022
Source: Eurostat (ad hoc extraction EU-LFS module 2022)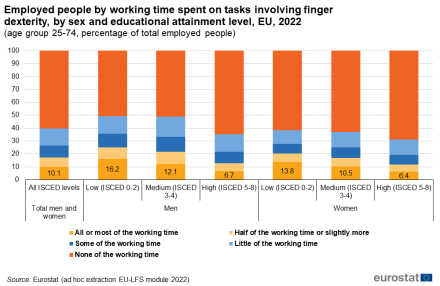
Figure 7: Employed people by working time spent on tasks involving finger dexterity, by sex and educational attainment level, EU, 2022
Source: Eurostat (ad hoc extraction EU-LFS module 2022)


At country level, more than one fifth of employed people spent all or most of their working time doing hard physical work in Italy (25.3 %), Ireland (22.1 %), Slovakia (22.0 %), Greece (20.4 %), and France (20.2 %). In contrast, in the same situation were less than one in twelve of their counterparts in Luxembourg (7.8 %), the Netherlands (7.3 %), and Sweden (7.0 %) (see Figure 8).
.png)
The highest percentage of employed people that spent all or most of their working time on tasks requiring finger dexterity was recorded in Slovenia (21.2 %), followed by Italy (14.8 %), and Ireland (14.1 %) (see Figure 9). By contrast, the corresponding percentage in Cyprus, Czechia, Bulgaria, and Slovakia was lower than 5 %. Moreover, in Cyprus and Slovakia, together with Luxembourg, 75 % or more of employed people spent none of their working time on tasks requiring the use of finger dexterity.

Time spent on cognitive tasks
In 2022, within the EU, one in ten employed people aged 15-74 dedicated more than half of their working time to performing relatively complex calculations (4.2 % spent all or most of their working time on these calculations, while 6.0 % spent half of their working time or slightly more) (see Figure 10). Complex calculations refer to computations that go beyond simple integer numbers; they encompass fractions, percentages, and other related calculations. These calculations may involve the use of calculators, or software, or can be done manually or mentally.
The share of employed men who spent more than half of their working time on relatively complex calculations was slightly higher compared with that of women. For both sexes, this percentage shows an increasing trend from the age group of 15-29 years to 30-44 years, reaching its peak during this age range. Then, for the age groups 45-59 and 60-74, the percentage of people engaged in relatively complex calculations more than half of their working time consecutively declines.

As can be seen in Figure 11, in 2022, approximately three out of twenty employed people in the EU dedicated more than half of their working time to reading work-related documents (5.9 % allocated all or most of their working time to this task, while 9.5 % devoted half of their working time or slightly more). The term ‘reading work-related documents’ specifically means reading complex and detailed written materials that require specific skills or knowledge to comprehend. These may include technical complaints, publications, acts, contracts, technical guidelines, technical reports, bills, and similar materials. Simple documents such as emails or letters are not taken into account.
Similarly to relatively complex calculations, the percentage of employed people who dedicate more than half of their working time to reading work-related documents increases from the age group of 15-29 years to 30-44 years, reaching its highest value during this age. Then, it decreases for the age groups of 45-59 and 60-74 years. Women recorded a higher percentage than men in this regard, with the most significant difference observed in the age group of 15-29 years. One exception to this pattern emerged within the age group of 60-74 years, where men exhibited a slightly higher percentage than women.

Figures 12 and 13 reveal a significant increase in the share of employed people who spend more than half of their working time on complex calculations and reading documents as their level of education rises. Those with a high level of education exhibit a percentage which is approximately four times or more above that of their counterparts with a low level of education.
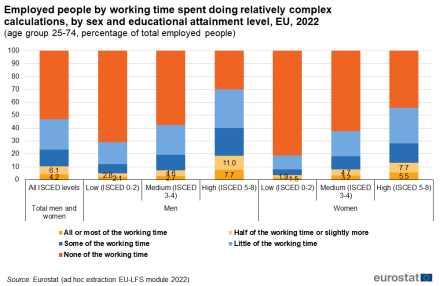
Figure 12: Employed people by working time spent doing relatively complex calculations, by sex and educational attainment level, EU, 2022
Source: Eurostat (ad hoc extraction EU-LFS module 2022)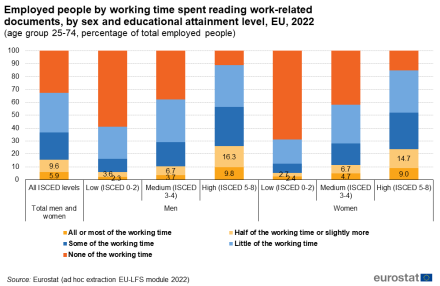
Figure 13: Employed people by working time spent reading work-related documents, by sex and educational attainment level, EU, 2022
Source: Eurostat (ad hoc extraction EU-LFS module 2022)


Figure 14 displays a strong positive correlation between the share of employed people who dedicate more than half of their working time to reading work-related documents and the share of those who spend more than half of their working time engaged in relatively complex calculations. The highest percentages for both of these measures were recorded in Austria, France, Luxembourg, Latvia, and Malta. Furthermore, Ireland exhibited a relatively high percentage for engaging in relatively complex calculations, while Slovenia stood out with a relatively high percentage for reading work-related documents.

Similar figures to Figures 3, 8, and 9, but for complex calculations and reading work-related documents, are available in the Excel file attached to this article.
Overview by economic activity
As shown in Figure 15, the NACE sections ‘Financial and insurance activities’, ‘Professional, scientific and technical activities’, and ‘Information and communication’ had the highest shares at EU level of employed people spending all or most of their working time using digital devices, doing relatively complex calculations, and reading work-related documents. At the same time, the highest percentages for hard physical work were recorded in the sections ‘Construction’, ‘Agriculture, forestry and fishing’, and ‘Activities of households as employers’, while the highest percentages for finger dexterity were found in ‘Other service activities’, ‘Construction’, and ‘Manufacturing’.

Source data for tables and graphs
Data sources
The European Union Labour Force Survey (EU-LFS) is the largest European household sample survey providing quarterly and annual results on labour market characteristics of people. EU-LFS covers the resident population, defined as all people usually residing in private households.
Since 1999, an inherent part of EU-LFS has been the modules. These were called 'ad hoc modules' until 2020. From 2021 onwards, they are called either 'regular modules' when the variables have an 8-yearly periodicity or 'modules on an ad hoc subject' for variables not included in the regular datasets. In 2022, EU-LFS included an ad hoc subject module on job skills.
For further information on the EU-LFS modules, please refer to the article EU labour force survey - modules on this subject.
Coverage: The 2022 EU-LFS module on job skills covers all European Union Member States and the EFTA Member States Norway and Switzerland. For Cyprus, the survey covers only the areas of Cyprus controlled by the Government of the Republic of Cyprus.
All figures in this article refer to the main job of employed people.
European aggregates: EU and EU-27 refer to the sum of the 27 EU Member States.
The level of education refers to the educational attainment level, i.e. the highest level of education successfully completed. Low level of education refers to ISCED levels 0-2 (less than primary, primary and lower secondary education), medium level refers to ISCЕD levels 3 and 4 (upper secondary and post-secondary non-tertiary education) and high level of education refers to ISCED levels 5-8 (tertiary education).
Calculation of percentages
All of the figures in this article present percentages of a total. The calculation of all percentages used in this article is based on a total excluding the number of people classified in the non-response category. As such, all exhaustive breakdowns presented in the figures should sum to 100 % (allowing for rounding errors).
Context
This article is published on the occasion of the European Year of Skills in 2023.
Direct access to
Dedicated section
Methodology
Publications
- Labour force survey in the EU, EFTA and candidate countries — Main characteristics of national surveys, 2020, 2022 edition
- Quality report of the European Union Labour Force Survey 2020, 2022 edition
- EU labour force survey — online publication
ESMS metadata files and EU-LFS methodology
- Employment and unemployment (Labour Force Survey) (ESMS metadata file — employ_esms)
- LFS ad-hoc modules (ESMS metadata file — lfso_esms)