Building the System of National Accounts - supply and use tables
This article is part of a set of background articles explaining in some detail how statistics producers, such as national or international statistical institutes, may build a coherent system of national accounts (SNA), especially in developing countries. The articles are based on the official Eurostat handbook Essential SNA - Building the basics and they focus particularly on the early stages of the implementation.
Supply and use tables offer a detailed picture of the economy by providing the elements of the production process, the use of the goods and services (products) and the income generated in that production. The elaboration of these tables is a complex and challenging process, but it offers great benefits for many reasons. The aim of this article is to present the methodology, the main procedures and the data sources necessary to start and to improve the compilation of supply and use tables.
Full article
Why we need supply and use tables
Supply and use tables within 2008
The implementation programme for the 2008 System of National Accounts and supporting statistics represents the current global statistical initiative and has two main objectives in assisting countries in developing their statistical and institutional capacity:
- to make the conceptual changes from the 1968 or 1993 SNA to the 2008 SNA;
- to improve the scope, detail and quality of the national accounts and supporting economic statistics.
Three main dimensions need to be taken into account for determining implementation goals and for monitoring the progress of implementation of the 2008 SNA:
- scope of the accounts
- compliance with the SNA concepts
- quality issues.
The guidance to countries that are considering expanding the scope of their national accounts coverage in line with the recommendations of the 2008 SNA and the framework to measure the level of national accounts development at different points in time are based on the milestones approved by the UN Statistical Commission at its twenty-ninth session[1]. The supply and use tables are linked with Milestone 1 and it is important to recall that they form one of the recommended tables under the ‘minimum requirement data set’, (MRDS) included in the scope of the compilation of 2008 SNA tables and accounts (see Building the System of National Accounts - strategy).
The supply and use tables describe, in a collection of matrices, how supplies of different kinds of goods and services originate from domestic industries and imports and how those supplies are allocated between various intermediate or final uses, including exports. These tables involve the compilation of a set of integrated production and generation of income accounts for industries. The compilation of supply and use tables is a natural step towards the 2008 SNA implementation, with positive impact on all phases described within the present set of background articles.
Benefits of supply and use tables
Compiling supply and use tables requires exploiting all available data and information from the economy and society, in a logical way. The end result is a reliable and balanced set of national accounts, including the estimation of key aggregates like GDP in current prices and in prices of the previous year.
The main advantages of compiling supply and use tables are summarised below.
Advantage 1: Integration of GDP estimation approaches
Supply and use tables offer an ideal framework for the integration of the three approaches to calculating GDP.
More information about GDP estimation methods is presented in basic concepts and in main aggregates of the article 'System of National Accounts - basic concepts'.
The supply and use framework enhances the accuracy of both production and expenditure approaches of GDP estimation, as it is consistent not only for the overall economy, but also at each individual product level. Estimating GDP through supply and use tables is the best way to make sure that both results for GDP (estimated by the production approach and by the expenditure approach) are equal since there is no room for a statistical discrepancy. Compilation of these tables involves balancing uses and supplies at a detailed commodity level and in this process the accuracy of both GDP calculations (by production and by expenditure) are enhanced.
The supply and use tables are weaker with respect to the income approach of GDP estimation; operating surplus and mixed income are usually estimated by using a residual result from the other two approaches. To respect the income approach to calculating GDP, data from the profit and loss accounts of companies can be added, based on the reconciliation of information between industries and sector accounts (see Figure 1).

Advantage 2: Goods and services account, production account and generation of income account included
Supply and use tables also enable the first three accounts to be compiled: goods and services account, production accounts by industry and sector, and generation of income accounts by industry and sector.
Figures 2 to 9 illustrate the links between institutional sectors and supply and use tables through a numerical example.
The institutional sector accounts for one economy are presented in Figures 2, 3 and 4:
- Institutional sector accounts for one economy

Figure 2: External account of goods and services

Figure 3: Production account
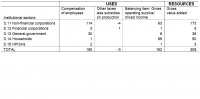
Figure 4: Generation of income account


The resources and uses elements of each institutional sector are separated by industry. In the example, the industries are grouped into the three main categories:
- primary sector, which includes agriculture, forestry and mining;
- secondary sector, which includes manufacturing, construction and production of electricity and other utilities;
- tertiary sectors where services are included.
The link between institutional sector accounts and industries is presented in Figures 5 and 6.
- Link between institutional sector accounts and industries
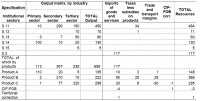
Figure 5: Resources
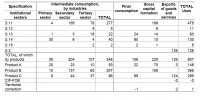
Figure 6: Uses
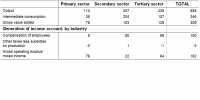
Figure 7: Production and generation of income account, by industry


Based on the previous data, the final supply and use tables (Figures 8 and 9) are estimated.
- Final supply and use tables
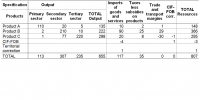
Figure 8: Supply table
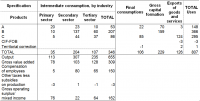
Figure 9: Use table


More information about institutional sector accounts is presented in basic concepts and in main aggregates of the article 'System of National Accounts - basic concepts'.
Advantage 3: Integrator framework
The estimation of national accounts is based on various statistical and administrative data sources. The framework proposed by the supply and use tables enables an efficient analysis and comparison of data. Inconsistencies between the different primary sources, lack of information for some indicators, or poor quality of data used for GDP compilation can be detected and improved by integrating these factors in the detailed common framework provided by the supply and use tables. The approach provides a firm basis for making the appropriate corrections and adjustments to the information from primary sources in order to obtain consistent estimates of GDP. Making estimates by residuals (estimating a variable by first estimating all other variables included in one identity presented in the supply and use tables) for some specific products or by extrapolating figures for periods in which less reliable information is available are two examples of the methods applied in the framework provided by the supply and use tables.
In the same way, the supply and use tables contain the full framework for establishing the connection between the various valuation concepts used in national accounts. The distribution of margins, taxes and subsidies on products are included since they are used to pass from basic prices to producers’ prices and finally to purchasers’ prices.
The relationships between different valuation concepts in national accounts are presented in the article System of National Accounts - basic concepts.
Advantage 4: Basis for further developments in the statistical system
Detailed supply and use tables offer the best framework for the calculation of GDP in current prices and in the prices of the previous year following the 2008 SNA recommendations. The inconsistencies between supply and use elements highlighted in the framework represent the ways for further improvements and developments of data sources. The following example illustrates this situation with the aid of Figure 10.
Let us consider the identity for the product ‘shoes’ in a given economy A. For this product, based on data sources presented in column 2 of Figure 10, elements of the supply and use tables are estimated.

An inconsistency can be observed between the supply and the use of this product. To eliminate this inconsistency and to ensure the base identity of the supply and use tables, a deep analysis of the data sources and indicators calculated is required. In economy A, it is known that the quality of the structural survey is acceptable for some indicators, but cannot provide good information concerning change in inventories; external trade statistics provide a sound data source especially for goods. In these conditions, it is necessary to analyse the data obtained from other sources, and the attention is focused on the Household budget survey (HBS). The comparative analysis of the sources based on the inconsistency of the data highlights its weaknesses. In the example presented, it is assumed that the HBS is the weak source because the results provided are not relevant for the entire population and the non-response rate is very high. It is one of the sources that have an impact on the quality of the indicators.
Based on the inconsistency detected and the analysis of sources, the statistical institute has reason for putting in place actions for improving these statistics; based on the example presented, the further activity should be oriented towards improving the quality of the HBS.
What should a national accountant do in the situation described above? He/she cannot wait for the improvements, which would take two to three years to filter through the system. Based on the other information (e.g. turnover of retail sale companies or agriculture data) and applying the commodity flow method, indicators of final consumption expenditure of households are corrected. Also knowing that the quality of the change in inventory estimation using the structural survey is weak, this data is changed based on additional information. The final results are presented in column 4 of Figure 10. This column represents the row of the product ‘shoes’ in the supply and use tables.
For the benefit of the countries in the early phases of 2008 SNA implementation, one must stress that a substantial amount of resources is required to build an integrated supply and use framework for the first time. This work involves establishing all the individual product balances, the development of appropriate techniques for incorporating the primary sources, and new software for handling the supply and use system. The investment may lead to considerable changes in working processes and may provide significant progress towards a better integration of activities. In this respect, the supply and use tables help the national accountants as well as the management of the statistical system to understand the data requirements for national accounts compilations and to correspondingly assess the gaps and weaknesses in the information system.
Compilation of supply and use tables on a regular basis not only helps to improve national accounts, but also to improve the statistical capacity of the countries that use these tables.
The article Building the System of National Accounts - strategy presents the main aspects related with the compilation of a national accounts strategy.
Advantage 5: Supply and use tables, benefits for users
The data presented in the supply and use tables form the basis for the estimation of other indicators, as well as for economic analysis and forecasting. The International Comparison Program (ICP) is a worldwide statistical partnership to collect comparative price data and compile detailed expenditure values of countries’ gross domestic products (GDPs), and to estimate purchasing power parities (PPPs) of the world’s economies. Using PPPs instead of market exchange rates to convert currencies makes it possible to compare the output of economies and the welfare of their inhabitants in real terms (that is, controlling for differences in price levels). The Global Office of ICP 2011 recommends the use of the supply and use tables framework by the countries for compiling and providing values of GDP expenditures.
Supply and use tables are used as a tool for economic analysis and forecasting. The tables provide different information about the cost of the production, the structure of these costs, the structure of the capital formation, final consumption, the needs for imports, the export competitiveness, etc. For example, if the government decides to build a new high-speed railway, it is necessary to know the impact this will have on various branches of the national or regional economy. For the construction proposed, the construction company will need steel for the rails, electric pylons and also pre-stressed concrete for the bridges and other major construction works. The result will be an increase in demand for the products of the steel and concrete industries. But this is not all. The firm will also need to buy new excavators and cranes not produced within the country, hence the imports of these items will increase (additional financial resources will be necessary to cover these imports). The framework of supply and use tables can provide the information necessary to build the development strategy in the respective field.
In order to serve more specific purposes, supply and use tables can be developed by introducing alternative and/or supplementary classifications, which are:
- more detailed product or industry classifications in line with national conditions and requirements;
- more detailed geographical breakdown for imports and exports;
- classification of compensation of employees by some criteria (level of education, if employee is working part-time or full-time, etc.).
Basis for building supply and use tables
Structure of supply and use tables: aggregates and accounting identities
Supply and use tables represent matrices describing the domestic production processes and the transactions in products of the national economy, by product and industry. These tables show:
- the structure of the costs of production and the income generated in the production process;
- flows of goods and services produced within the national economy;
- flows of goods and services with the rest of the world.
The elements of a supply table are:
- domestic output by industry;
- imports: goods, services, purchases of residents abroad (no adjustment needed if included in the balance of payment statistics);
- trade margins;
- transport margins;
- taxes on products,
- subsidies on products.
The elements of a use table are:
- intermediate consumption by industry
- exports: goods, services, purchases of non-residents in the domestic economy (no adjustment needed if included in the balance of payment statistics)
- household final consumption expenditure
- final consumption expenditure of NPISHs
- government final consumption expenditure: individual consumption and collective consumption
- gross capital formation: gross fixed capital formation, change in inventories, valuables.
Simplified supply and use tables are presented in Figure 11.

In the supply and use tables, the resources (another name for ‘supply’) are equal to the uses, by definition. Thus, the following three accounting identities (in a general form) must be fulfilled by each product/commodity entering into the classification of supply and use tables:
- Identity by industry:
Output by industry = Input by industry.
For each industry: Output = Intermediate consumption + Gross value added.
- Identity by product:
Total supply by product = Total use by product.
This identity is only valid when supply and use are estimated in the same prices (purchasers’ prices or basic prices). For each product the supply and use are estimated in purchasers’ prices.
Supply at purchasers’ prices = Output at basic prices + Imports at basic prices + Trade margins + transport margins + Taxes (less subsidies) on products.
Use at purchasers’ prices = Intermediate consumption + Exports + Final consumption expenditure + Gross capital formation.
- Identity for gross value added (GVA)
Total GVA = Σ GVA of each industry
where the GVA = Output – Intermediate Consumption of each industry.
When adding the table of Value added allocation in the supply and use framework, one must complete another accounting equation (by industry).
Output – Intermediate consumption = Value added = Compensation of employees + Other taxes on production, net + Operating surplus/mixed income.
More information concerning the estimation of GVA is presented in the section on accounts and main aggregates in the article Building the System of National Accounts - basic concepts.
The compilation of the supply and use framework dataset cannot be seen as being independent from the compilation of the other accounts of the system. Here, the goods and services account, the production account, and the generation of income account by industry are integrated.
Supply and use tables are the central framework for all kinds of tables by industry, e.g. those on output, value added, compensation of employees, employment, operating surplus/mixed income, taxes (less subsidies) on production, gross fixed capital formation, consumption of fixed capital and capital stock.
Information from supply and use tables is the starting point for constructing the symmetric input-output tables. The industry by product information in the supply and use tables can be converted into symmetric tables. A symmetric input-output table is a product-by-product or industry-by-industry matrix describing the domestic production processes and the transactions in products of the national economy in great detail; it rearranges supply and use tables in a single table. The major conceptual difference between a symmetric input-output table and supply and use tables is the fact that the former presents statistics concerning products by product or industries by industry. So, in a symmetric input-output table either a product or an industry classification is employed for both rows and columns.
As the supply and use tables are one of the recommended sets of data necessary for the 2008 SNA implementation, this article will not present the input-output table methodological aspects.
Classifications
Supply and use tables integrate all main classifications used in national accounts statistics.
Detailed information concerning the statistical classifications is presented in the article Building the System of National Accounts - business register and statistical classifications.
The main classifications used in the supply table are summarised in the following list:
- For domestic products (which is the preferred term used for ‘commodities’): Central product classification Version 2 (CPC Ver.2), or a national/regional classification compatible with CPC Ver.2;
- For industries: ISIC Rev.4, or a national/regional classification compatible with ISIC Rev.4;
- Imports must be classified by product in a manner consistent with that used for domestic production. Since imports (and exports, too) are classified based on the HS or SITC and not according to CPC, this correspondence is not easily ensured. Finding a level of aggregation of the trade data that is sufficiently detailed but also consistent with domestic production may be a factor in determining the level of detail to be adopted in the supply and use tables. The detailed correspondence table between SITC, CPC and ISIC must be used for this purpose.
The level of detail by industry/product is established by each country, according to its economic specificity. Also, the following elements could have a significant impact on the level of available details included in the supply table:
- availability and quality of primary sources data
- importance of industries/products to the country and its cultures
- current national accounts compilation practice
- staff resources
- time schedules for production and publication of the tables.
However, the guiding factor for establishing the detail of the supply and use tables is that there is generally a direct relationship between the size of the tables and the quality of data provided. Therefore, countries have to choose the size of supply and use tables on the basis of the factors presented above.

In the use table, there are some specific classifications:
- Final consumption expenditures are estimated using classifications by purposes: COICOP for households, COPNI for NPISHs and COFOG for general government. The transition from these classifications to product classification (CPC Ver.2) is made internally by national accountants using correspondence tables and the supply and use tables balancing framework.
- Gross fixed capital formation is initially obtained by type of assets, with the 2008 SNA classification by assets being the recommended classification. They are integrated into use tables based on a conversion into CPC Ver.2 classification, the one used to balance the supply and use of each product.
- The allocation of exports by product requires the same conversion between SITC or HS codes and CPC classification, as for the allocation of imports.
- The four types of inventory identified in the 2008 SNA (materials and supplies, work-in-progress, finished goods and goods for resale) are classified by product based on the classification used for each one of them (CPC Ver.2 or the national classification). This allocation is relatively difficult, especially for goods for resale or for materials and suppliers and is carried out during the exercise of balancing the supply side with the use side for each product.
The elements of output, intermediate consumption and value added are classified by industry, using ISIC Rev.4, or the national classification compatible with the international one.
Valuation issues
The main identity of supply and use tables is their equilibrium by product. In order to obtain this and to balance total supply with total use, both supply and use must be evaluated in the same way. The most usual way to achieve this is to raise total supply to purchasers’ prices, taking into account the use of the estimation of components.
The purchaser’s price[2] is the amount paid by the purchaser, excluding any deductible VAT or similar deductible tax, in order to take delivery of a unit of goods or services at the time and place required by the purchaser. The purchaser’s price of goods includes any transport charges paid separately by the purchaser to take delivery at the required time and place.
The basic data used to compile the supply and use tables have different valuations:
- Production/output data are valued at basic prices.
- Intermediate consumption and final uses are usually valued at purchasers’ prices.
- Imports are valued at CIF prices – price of goods delivered at the frontier of the importing country, or the price of a service delivered to a resident, before the payment of any import duties or other taxes on imports or trade and transport margins within the country – Cost Insurance and Freight.
- Exports are valued FOB – price of goods at the frontier of the exporting country, or the price of a service delivered to a non-resident, including transport charges and trade margins up to the point of the border, and including any taxes less subsidies on the goods exported – Free On Board.
In these conditions, supply and use tables cannot be balanced and made consistent if their elements are valued using different prices.
The transition from supply at basic prices to purchasers’ prices requires:
- reallocating trade margins;
- reallocating transport margins;
- adding taxes on products (except deductible VAT);
- deducting subsidies on products.
A similar transition is applied to transform use at purchasers’ prices into use at basic prices. The estimation of transitions in both types of prices is an important part of the balancing process. In practice, both types of balances may be needed to build a supply and use table. Both alternatives deal with or require similar kinds of adjustments, i.e. for taxes less subsidies on products and trade and transport margins by product.
In order to pass from one price to another, the valuation matrices play an important role. These matrices bridge the gap between the valuation of purchasers’ prices and the valuation at basic prices and vice-versa. The valuation matrices comprise all flows that are related to the supply and use of trade and transport margins and the supply and use of taxes less subsidies on products. The supply-side valuation matrices are needed to balance supply and use at purchasers’ prices and the use-side valuation matrices are needed to transform the use data from purchasers’ prices into basic prices. Figure 13 shows the valuation matrices and their role in the compilation of the supply and use framework in purchasers’ prices.

Trade margins
Wholesalers and retailers are treated as supplying services to their customers by storing and displaying a selection of goods in convenient locations and making them easily available for customers to buy. Their output is measured by the total value of the trade margins realised on the goods they purchase for resale.
The margins on some goods may be negative if their prices have to be marked down. They must also be negative on goods that are never sold because they go to waste or are stolen. The concept of trade margins can be applied for specific goods, for trading activities of a statistical unit, for the trading activities of industries, and for the total trading activities of the economy.
In practice, the output of a wholesaler or retailer is given by the following identity:
output = value of sales,
+ value of goods purchased for resale and used for intermediate consumption, compensation of employees, etc.,
– value of goods purchased for resale,
+ value of additions to inventories of goods for resale,
– value of goods withdrawn from inventories of goods for resale,
– value of recurrent losses due to normal rates of wastage, theft or accidental damage.
More information concerning wholesale and retail distribution is presented in Chapter 6: The production account of The 2008 SNA, European Commission, IMF, OECD, World Bank, 2009.
Trade services are usually distinguished between wholesale and retail sale; an important distinction with respect to the allocation of the trade margins of the use categories:
- wholesale is the resale (sale without transformation) of new and used goods to retailers, industrial, commercial, institutional or professional users, or to other wholesalers;
- retail sale represents the resale (sale without transformation) of new and used goods, mainly to the general public, for personal or household consumption.
Trade margins are the measurement concepts of trading activities in the system, regardless of whether this is done by traders, as their main activity, or by other industries, as part of their secondary outputs. The estimation of the trade margin is made, usually, based on data from structural business statistics or from specific trade surveys. These sources provide data on total trade margins by industry, which then need to be transformed into data by product. Based on the valuation prices of the supply and use tables, the compilation of trade-margin matrices can start either from the supply side or from the use side.
- Trade-margin matrices on the supply side
Usually, available data sources provide information concerning the trade margins by industry. In order to use this information in the supply and use tables, it should be transformed into data by product.
Special attention should be paid to the level of detail at which the trade-margin matrices are compiled. It is preferable for the product level in estimations to be more disaggregated than the level of detail of the final supply and use tables. This is in order to meet the needs of the commodity-flow method, to allow the use of different product-margin ratios, and to provide desirable details for the compilation of certain use data (e.g. to allocate the products and their margins to the purpose categories of private consumption expenditures).
As a general working procedure, the main steps to estimate the trade margins in the supply table are as follows:
1. To separate trade turnover into wholesale and retail sale trade turnover
In structural business statistics, a distinction between wholesale and retail trade turnover is often surveyed in trade industries but not in other industries (this depends on the quality of the surveys). However, in such cases the value of products purchased for resale need not distinguish between wholesale and retail sale. This means that some adjustments should be made based on the characteristics of the economy and the kind of industry concerned. As an example, the bakery industry may be considered: the trade of small bakeries is likely of retail sale type, whereas the trade of large bakeries is almost certainly of wholesale type.
2. To estimate the trade turnover by product
Two trade turnover matrices of industries by product are estimated, one for wholesale and one for retail trade turnover. The information required for this step is usually very poor and plausible assumptions must be made. For example, it would not be wrong to assume that hotels are trading in souvenirs, newspapers, journals and food and beverages, and that museums are trading in books, multimedia products and so on. For trade industries, the estimation of the margins by product is very difficult, taking into account the large variety of products sold in the shops. Based on the economic characteristics and the use of all available information, assumptions are made and applied to split the trade turnover by product. In order to validate the results, it is essential to check them with the supply of the goods (domestic production and imports) and to analyse the relationship between wholesale and retail trade turnover.
3. To estimate the trade margin matrices by product
The trade margin-matrix can be estimated by multiplying the trade turnover matrices (elaborated in step 2) by the assumed product-margin ratios. Margin ratios represent the share of a trade margin in relation to the trade turnover at the product level (product groups) or at the industry level, which would give information on the average margin of that industry. For this transformation there are, in principle, two options:
- for each industry the average margin ratio of that specific industry is applied for all the products traded (based on the industry technology);
- a specific product-margin ratio is applied to all trade turnover of that product irrespective of the industry (product technology). It should be stressed that all the estimations are made separately for wholesale and retail trade.
The results obtained by product are checked with the total trade margins by industry. The differences are then analysed and, based on the information available, adequate adjustments are operated.
- Trade-margin matrices on the use side
Data availability to estimate trade margins by product in use tables is much poorer than for the supply-side; for the buyers (such as households or government), it is impossible to know the share of the trade margins in the price they have paid. All the distribution channels before the final seller are certainly totally unknown to the buyer.
For these reasons, the calculation of the use-side trade-margin matrices is based on plausible assumptions and is balanced with the estimated total supply of the trade margins. It could be assumed that in intermediate consumption only wholesale trade services are involved (at least for some industries and for the others, a share of the wholesale as source for the consumption is estimated). In the case of private consumption expenditures, the retail margins may be allocated, with some exceptions, when consumers have access to the wholesale channel directly. Some of the products bought in retail trade might have been delivered from wholesalers, whereas others are delivered directly from the producers of the goods.
Similar assumptions may be made for capital formation, for which mostly the wholesale channel is more important although to a very small extent the retail sale channel is also significant (e.g. products bought by private households when constructing their own dwellings or making major repairs). In inventories only wholesale margins can be involved, but not retail sale margins. However, the problem is that, for obvious reasons, one cannot allocate margins to changes in stocks, but only to stock data, more specifically stock data at the end of the period. In practice, this means that trade margins will be allocated only to increases in stocks. For exports one can assume that only wholesale margins are involved; also with some exceptions, the most important relates to the goods bought by non-resident travelers (tourists).
The procedure of trade-margin allocation to single use elements starts with the flows for which the best quality information is attained or the assumptions that seem to be the most plausible. For the trade-margin estimation in the use table, the details available from the supply-side should be utilised as much as possible; this refers particularly to the details of products. The resulting use-side trade margin matrices should also be checked for overall plausibility, both with regard to the relationships between allocated wholesale and retail trade margins, as well as to the relationships between the use data at purchasers’ prices and the allocated trade margins.
Transport margins
Transport margins, another valuation component in the supply and use tables, represent freight transportation services of products when paid by the buyer of the product or when invoiced separately by the seller.
Transport margins include the following cases in particular:
- the invoiced value of the transport of goods from the place where they are manufactured or sold to the place where the purchaser takes delivery of them. The transport is made by a third party and the amount is invoiced separately to the purchaser;
- the transport of goods arranged by the manufacturer or by the wholesale or retail trader in such a way that the purchaser has to pay separately for the transport costs even when the transport is done by the manufacturer or the wholesale or retail trader himself.
So, if the producer agrees to deliver the product to the purchaser without explicit charge, the cost of delivery is included in the basic price. Only if the purchaser is explicitly invoiced for the delivery is there a specific transportation margin that is part of the purchaser’s price.
Based on this definition, all of the following transportation costs are not recorded as transport margins, because they do not contribute to the valuation difference between basic prices and purchasers’ prices.
- If the manufacturer or trader transports the goods himself, these transportation costs are not included in the basic price of the manufacturer’s or trader’s output and represent an ancillary activity of the unit.
- If the manufacturer arranges for the goods to be transported without a separate invoice for the transport services, these transport costs are included in the basic prices of the manufacturer’s output.
- If wholesale and retail traders arrange for goods to be moved from where they take delivery of them to where another purchaser takes delivery, these costs will be included in the trade margin if no separate charge is made for transportation to the purchaser (i.e. these costs will be part of the intermediate consumption of the wholesale and retail traders).
- If a household buys goods for final consumption and pays for transport to a third party, these transport costs are recorded as final consumption expenditure on transport services and not included in some trade or transport margin.
- If a domestic carrier transports goods form country A to country B through the domestic territory (transit transport), this is not considered a transport margin because it does not relate to goods that form part of domestic supply and use; these transportation services are recorded under export of services.
- Transportation services of domestic carriers outside the domestic territory are not part of the transport margins, but rather export of services.
- Freight transportation of used goods, scrap and waste, earth and similar freight connected with construction projects are also not part of transport margins as these goods are not considered products.
The complexity of the transport margin is important, not only because of the different kinds of margins (for each type of transport: road, railway, water, air, pipeline) but also because of the definitions themselves. Also, the data availability gives rise to many practical elaboration problems. The relationship between the supply of goods and the transport margins connected with them is much looser than in the case of trade margins. Several reasons can be given for this fact: the transport costs are usually not related to the value of the goods transported; a lot of transportation is done as ancillary activity; and the way transportation costs are paid might differ from product to product and from transaction to transaction.
As in the case of trade-margin matrices, it is recommended to start the estimation of the transport-margin matrices with the supply-side for the same reason: there is no direct information on the amount of transport margins included in the purchasers’ prices of the uses. The main steps of the estimation procedure are similar to those for trade-margin matrices.
The quality of transport-margin data depends very much on available data sources; usually there are data from transport statistics (in physical terms, providing data on the transport distance, whether domestic, cross-border or transit transport, the transport volume in terms of weight and ton-kilometers, and the kinds of goods transported and covered by different modes of transport). The physical data have to be multiplied by appropriate transport tariffs (transport prices). Such tariffs vary between the goods transported, transport distance and by different kinds of transport vehicles.
Another important data source is the structural survey (for more information concerning statistical sources, see the article Building the System of National Accounts - statistical sources).
Structural surveys can provide detailed information concerning the transportation costs paid by the seller or the value of the invoiced transport services, by type of goods transported.
To find out more, consult Chapter 14: The supply and use tables and goods and services account of the 2008 SNA, European Commission, IMF, OECD, World Bank, 2009.
Taxes and subsidies on product matrices
The 2008 SNA defines three types of product taxes:
- value added type taxes (VAT)
- taxes and duties on imports, excluding VAT
- taxes on products, except VAT and import taxes.
Other taxes on production are included in the basic price measurement of output and other subsidies on production are excluded so do not feature in the adjustment for taxes that converts a valuation at basic prices to purchasers’ prices.
When output is at basic prices, the taxes column contains total non-deductible VAT on products, taxes and duties on imports excluding VAT, export taxes and taxes on products excluding VAT, and import and export taxes. When output is at producers’ prices, the taxes column includes only taxes and duties on imports (excluding VAT), plus total non-deductible VAT on these products.
The compilation requirement of the taxes and subsidies matrices refers to the elaboration of the column vector in the supply table. The taxes less subsidies are shown by product. In the first step of the estimation process, it is necessary to classify the different product taxes/subsidies according to the product classification used; such as, for example, the sugar taxes are attributed to group 235 of CPC Rev.2, tobacco products to group 250 and so on, or to the appropriate more detailed level of the classification in use. The same has to be done for the product subsidies.
The second compilation step, with respect to the product taxes/subsidies, refers to the allocation of the product taxes/subsidies on the use side (intermediate uses and final uses) at purchasers’ prices. For those product categories for which product taxes/subsidies have been allocated, the share of the tax/subsidy component in the purchaser’s price has to be calculated. This step needs to be based on the appropriate taxation basis according to the tax legislation of each country.
Subsidies are recorded as if they were negative taxes on products or negative taxes on production. Only subsidies on products (if any) are entered into the column for the tax adjustment to the valuation of supply; they appear with a negative sign to indicate they reduce the value of purchasers’ prices rather than increasing it.
Statistical unit and data sources
The statistical unit and data sources are linked in the sense that the data collected from various sources could match directly or must be adjusted based on supplementary information in order to meet the methodological requirements of the supply and use tables.
The 2008 SNA recommends the use of local kind-of-activity units, as this type of unit presents all the characteristics necessary for the analysis of technical and economic relationships. In consequence, institutional units must be partitioned into smaller and more homogeneous units with regard to the kind of production. Local kind-of-activity units are intended to meet this requirement as the best practice-oriented operational approach.
The article Building the System of National Accounts - basic concepts outlines the relationships between enterprise, local unit and establishment.
The quality of supply and use tables depends on the level of disaggregation used for their compilation, availability of data sources, and human resources. The construction of supply and use tables following the 2008 SNA methodology is very data demanding and uses information available in the statistical system from all sources namely censuses, surveys, administrative data, various studies and expert judgments. The data requirements for constructing supply and use tables go beyond those required for preparing goods and services accounts in national accounts, because the data needs to be at the individual product level.
For compiling high-quality supply and use tables, it is necessary to have detailed and independently available data at product level for each component of the tables. Only in these conditions it is possible to mix and confront different sources of data through the supply and use framework, so that weaknesses in the data systems, including their conforming to national accounts concepts, are identified and appropriate adjustments are applied for the estimation of indicators.
In reality, the data sources available (especially, in developing countries) is much less than ideal, and this has a direct effect on the quality of supply and use tables. However, supply and use is the ideal framework (with its built-in cross-checks and balances) to maximise the quality of national accounts, even with limited source data. Therefore, it is all the more important to use the supply and use framework for national accounts compilations (and in particular for GDP) when source data is incomplete. In such situations, countries may be required to adopt commodity-flow approaches, or use auxiliary data sources such as studies or ratios from neighbouring countries or similar economies.
The main data sources required for the compilation of supply and use tables can be summarised in the following way:
1. Classifications:
- standard Industrial classification of all economic activities, Revision 4 (ISIC, Rev.4)
- Central product classification Version 2 (CPC, Ver.2)
- Standard international trade classification (SITC, Rev.4)
- Classification of individual consumption by purpose (COICOP)
- Classification of the functions of the government (COFOG)
- institutional sectors, e.g. non-financial corporations, general government, households, etc.
2. Registers
- Statistical business register.
3. Data sources for supply tables:
- agriculture, livestock, forestry and fishing:
- agricultural censuses, annual agricultural surveys on crop and livestock production,
- specific agriculture surveys: area and yield crop production, prices in agriculture, land use statistics/surveys, household income-expenditure surveys etc.,
- administrative data: administrative statistics on agriculture, livestock, forestry and fishing, administrative data maintained by local and regional traditional authorities, imports and exports of agriculture products, data from veterinary authorities.
- mining, manufacturing, construction, services:
- economic census, annual enterprise surveys covering all non-agricultural economic activities,
- specific statistical surveys: manufacturing industry surveys on turnover and number of employees and on product production, construction and/or investment surveys, labour force surveys, wholesale and retail trade surveys, data on indicators of output of services (freight-ton kilometers, passenger kilometers, number of vehicles on road, etc.), price statistics surveys,
- administrative data: administrative data on utilities (electricity, gas and water supply, post and communications, transport, airlines, mining, etc.), construction permits, government budget statements on revenues and expenditures, financial statements of non-financial units (companies/corporations government owned and private), tax data disaggregated by product, financial statistics from central banks, reports from regulatory agencies of insurance companies.
- Taxes and subsidies on products:
- administrative data: VAT value, other taxes provided by tax authorities, subsidies data.
- Imports:
- statistical data: special surveys for imports (such as on electricity).
- administrative data: imports of goods provided by customs, balance of payment.
4. Data sources for use table:
- final consumption expenditure:
- statistical data sources: household income-expenditure surveys, retail trade surveys, price statistics surveys,
- administrative data: government budget statements (revenues and expenditures), tax data on selected products such as alcohol, tobacco, motor vehicles, financial statements of NPISHs.
- gross capital formation:
- economic census, annual enterprise surveys covering all non-agricultural economic activities, annual agriculture survey,
- specific statistical surveys: construction and/or investment surveys, capital expenditure and inventory surveys,
- administrative data: construction building permits, government expenditures on investment, financial statements of non-financial and financial units and of NPISHs.
- exports:
- statistical data: special surveys for exports (such as electricity),
- administrative data: exports of goods provided by customs, balance of payment.
5. Other data:
- prices: consumer price, producer’s price, import price, export price.
More information concerning statistical business register, classifications and statistical data sources is presented in the article Building the System of National Accounts - business register and statistical classifications.
The administrative and statistical data sources presented are indicative, and may differ from country to country, but they provide an image of the enormous and exhaustive data needed for the compilation of supply and use tables. In some countries, especially in developing countries these sources may not be available. These countries may have to resort to a combination of these sources, collecting the data from a mix of different sources and applying commodity flow approaches, in order to compile the supply and use tables. At the same time, the lack of the necessary data for supply and use tables represents a starting point for further developments.
The article on strategy from this series of articles on Building the SNA presents the main phases of national accounts implementation strategy and development.
The available data sources and the economic interest and development of one country may restrict the estimation of the components of the supply and use tables, only at broad commodity level (for example, cereals, food products, fuel, personal services, tourism, travel, energy consumption, etc.), rather than at an individual product level; in such cases, a further breakdown of broad product-level expenditures into detailed product levels can be made on the basis of small surveys or even using ratios from neighboring countries with similar economic structure and combining this with expert opinions.
Compilation of supply and use tables
The methodological concepts and methods that are used in national accounts are also required for the compilation of supply and use tables. Examples of such methods are the commodity flow method, the balancing method or the double deflation method. In addition to the general compilation methods of national accounts, specific estimation procedures are needed and applied in the elaboration of supply and use tables.
Compilation steps
The compilation of the supply and use framework dataset following the 2008 SNA methodology is a very complex process depending on the full integration of the current accounts and accumulation accounts. This forms a set of interrelated tables that is fully compliant with all other accounts of the national accounts system. The balancing of the supply and use tables ensures the consistency between the various parts of the national accounting system.
The supply and use frame consists of several tables:
- Supply table at basic prices, which consists of two sub-matrices: the table of domestic output and the table of imports.
- Valuation tables, which comprise information on taxes less subsidies on products, trade margins and transport margins. These valuation tables allow the transformation of total supply at basic prices into total supply at purchasers’ prices.
- Table on intermediate consumption at purchasers’ prices presenting the input requirements of goods and services for the production of the outputs of each industry.
- Table on final uses at purchasers’ prices (unbalanced), which includes: household final consumption expenditure, general government final consumption expenditure, final consumption expenditure of non-profit institutions serving households (NPISH), gross fixed capital formation, changes in valuables, changes in inventories and exports of goods and services.
- Value added at basic prices by industry: compensation of employees, other net taxes on production, consumption of fixed capital and net operating surplus.
The compilation of these tables and their integration in a coherent framework is based on three main steps:
1. The first step is the compilation of the five tables presented above, based on available data sources, in current prices and in the prices of the previous year.
2. The second step is the analysis and balancing of these five tables in order to ensure the consistency of the system. The balancing procedure is an iterative procedure and it involves:
- balancing the supply and use tables at purchasers’ prices,
- compiling the valuation matrices,
- transforming the supply and use tables into basic prices,
- balancing the supply and use tables at purchasers’ prices and at basic prices.
3. The final step is the final balancing in both current and constant prices (at previous years’ prices). The result is the supply and use tables, balanced, in purchasers’ prices or in basic prices (the valuation matrices which allow the estimations of tables in these different prices are balanced, too).
The compilation steps are presented in Figure 14.

The non-balanced tables presented in the first step of the compilation procedure based on the available data sources, allow starting the balancing of the supply and use and input and output. Balancing is necessary in order to achieve identity between supply and use for each product, and to establish the identity between output and input for each industry. At the same time, balancing allows to identify inconsistencies of basic data and estimation methods used for the national accounts indicators included in the supply and use tables. It should be noted that it is recommended in order to achieve full consistency if the system is to balance the supply and use tables simultaneously in current prices and in the prices of the previous year.
Methods
Elaboration of supply and use tables requires specific methods. The main concern in the process of the compilation of supply and use tables is the collection of coherent and consistent data provided by different statistical and administrative sources. Besides the specific methodology used for the compilation of each component, further estimation methods have to be considered in order to be able to estimate each element of the supply and use system in the condition of weak, insufficient or missing data.
Usually, the data available are insufficient and not comprehensive enough in order to meet the supply and use methodological requirements; or, it can be the case that certain key data cannot be collected at all. In general, there are several aspects of dealing with difficulties in the compilation of supply and use tables: missing data, coherence of the supply and use system, consequences, and documentation.
1. Missing data
Certain data necessary to compile indicators of supply and use tables are not available in the official statistics or administrative system. In order to obtain them from other providers, or to access some additional information useful to develop assumptions and work hypotheses, several options could be followed:
- Use of information coming from private companies in charge of observations of a specific part/aspect of the economy for which there are no data in statistical or administrative systems. For example, when intermediate data on advertising costs are not available as separate items in business surveys one could probably base the estimates on data from private marketing or research companies observing the advertising market, even though the data are often not comprehensive enough, or the classifications used differ from the official ones.
- When monetary data are not available, some physical data related with the respective flow, can be used. One example of this is the number of private households connected to the internet which may serve as a basis for an estimate of the payments by private households for internet fees.
- Studies or expert advice from research institutes, chambers of commerce, trade associations, or other similar organisations may serve as proxies, indirect indicators or for checking certain estimates.
- Use of information from the ‘big players’ in some specific industries. For example, telecommunication companies, including radio and television, may provide their revenue data by branches of their customers, supermarket chains may be asked about data on their sales by product, railway companies have detailed data on the goods they transport, etc.
2. Coherence of the supply and use system
Estimates of some components, even when data sources are available, are based on the identities and coherence principle of the supply and use framework. The application of the commodity flow method adheres to this principle. All products presented in the supply side are correlated with the uses components and vice-versa. Constructing product balances almost always requires the compilers to use their judgment about the relative reliability of individual components of supply and use, and to make assumptions to fill data gaps.
Commodity flow is based on the identity by product:
Resources = Uses
The commodity flow method presents a clear advantage in identifying many flows. For many products, by their nature, it is possible to identify whether they are current or capital goods, and even where they are used. For example, an aircraft or a tractor can only be capital goods that are used in transport services or in agricultural sectors respectively; haircut services go to the final consumption of households. A detailed structure of supply and use tables provides a better possibility to use expert knowledge to supplement data sources in allocating products to different uses.
For example, the estimation of construction as an element of private consumption of households based on the commodity flow method is presented in figures 15, 16 and 17.
The commodity flow method is applied for the product ‘wheat’ in the economy A. Figure 15 presents the available data source and value of indicators used. Data collected are included in the accounting equation by product, specifically for the supply and use tables. The first estimations are presented in Figure 16. The discrepancy must be removed and the first step towards doing this is the analysis of the data sources in order to identify the strongest sources that allow the calculation of indicators in line with SNA methodology. The example presented uses the commodity flow method by analysing the data sources described below.
- The reliable data are for intermediate consumption, household consumption expenditures, imports and exports and transport margins.
- Output includes only the production of the enterprises estimated based on the structural survey, so the output of household farms is not covered.
- Less reliable data are for change in inventories because the stock of wheat available to the household producers is not included (in this case because there is no other information for these figures available).
The existing discrepancy is due to the fact that the household production of wheat and its change in inventory are not included in the estimations. Taking into account that no other information is available, the commodity flow method is applied. In order to simplify the example, it is assumed that the household production is consumed by households for their own consumption and that no trade activity is involved. This means that it is not necessary to adjust the trade margins already calculated.
The difference will be attributed to two elements, from different tables. In the example presented, it is assumed that the entire household production was consumed and there are no changes in inventory. So the discrepancy was considered to represent the household production of wheat and its value is the balancing item.
The adjusted data are presented in Figure 17.
- Example of commodity flow method

Figure 15: Data sources and indicators used
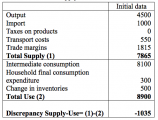
Figure 16: First estimations of supply and use for ‘wheat’
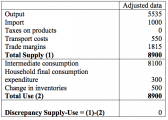
Figure 17: Adjustment of supply and use for ‘wheat’


The example presented illustrates one specific situation in which the source of the discrepancy between the supply and use tables for one product was identified and eliminated using the commodity flow method. In practice, the compilation process of supply and use tables reveals many different situations and any general method to eliminate the inconsistency between the two tables can be applied. The analysis of data sources and of methods used for the estimation of supply and use elements in relation with the 2008 SNA requirements provides the right way to ensure the identity between the tables.
When a certain flow is adjusted based on the analysis made, this obviously affects other flows that are closely associated with it either as suppliers of input or as consumers. To make the adjustments more systematic based on the commodity flow approach, it is necessary to take into account inter-industrial relationships; separate blocks of sectors should be set up and assigned in relation with the elements included. A block should include industries that are closely related in terms of input requirements. For example, cement, ceramic tiles, and windows and doors would definitely be required in construction, therefore these products can be used to cross-check estimates of construction, particularly for the household sector in developing countries. Some of these blocks of sectors may be:
- agriculture, fishing, manufacture of food products and beverages, hotels and restaurants, household final consumption;
- metal and machinery industries, construction, gross fixed capital formation;
- quarrying and non-metallic mineral products, construction;
- manufacture of textile and textile products, footwear, household final consumption;
- chemical industries, including plastic products, etc.
When the block of sectors is established, a deep analysis of the characteristics of the economy in the country, as well as the technical relations between industries is required.
3. Documentation
The compilation of supply and use tables is a complex process; for this reason, documentation of the basic data and the methods that can be used, the problems encountered, and the results achieved is highly recommended. Such an inventory is important for building a special process of supply and use compilation.
Documentation is useful, in particular, for the following purposes:
- obtaining information on the sources and methods of estimations for each single supply and use component; in the case of non-identity between supply and use, the information is used to understand the difference and to identify the element with a low quality of estimation which can be adjusted in the balancing procedure,
- evaluating the quality of the data and outlining the strategy for balancing,
- avoiding the repetition of changes and destruction of already balanced data,
- identifying the missing data issues and problems (data quality).
A documentation system for the compilation of supply and use tables should be integrated in the framework of the overall documentation system of national accounts. An essential feature is the documentation of all stages of the compilation of ‘hard’ data in terms of sources and ‘soft’ data in terms of estimates and adjustments, for each cell of the supply and use system.
Links between survey data and final national accounts data should be maintained in the system, in particular for survey data, coverage adjustments, conceptual and valuation adjustments, quality adjustments and balancing and coherence adjustments.
To find out more, consult the methods to estimate supply and use tables components presented in the Handbook of Input-Output Table Compilation and Analysis, Studies in Methods, Series F, No. 74, UN 1999, Part two: Compilation of SNA supply and use tables as well as in the Essential SNA - Eurostat Manual of Supply, Use and Input-Output Tables, Eurostat, European Communities, 2008.
The methods presented above illustrate three aspects:
- Due to the coherence of the accounting framework, it is possible to calculate data indirectly by using the identities of supply and use.
- It is very important to work on a detailed product classification level in order to allocate supply or use flows correctly.
- It is necessary to be armed with specific additional information of exogenous or independent data and information useful to improve the estimates or at least to be able to perform cross-checks. If only supply data are taken into account for estimating the use figures, it would not be possible to evaluate basic data and check consistency.
Balancing
One central feature of the SNA is the balancing process of the system. Balanced macroeconomic data can be derived on a more aggregated level by applying the production, income and expenditure approaches. However, the better option is to balance the system at the same time for the sector accounts and the supply and use tables at a much deeper level of products and industries. In an ideal situation, supply and use tables would be based on perfect knowledge and the two sides would present a perfect balance for each commodity. But of course, in the real world, both the supply and use tables contain many estimates because the sources for almost all commodities are incomplete and the two sides will usually not be perfectly balanced.
Balancing is not just necessary in order to achieve identity between supply and use for each product, and identity between output and input for each industry. Balancing also allows for tracing inconsistencies of basic data and estimation methods used. It is useful to have the balancing of the supply and use system both at current prices and constant prices, simultaneously.
The balancing procedure starts when an estimate is available for every component of the supply table, the use table and the valuation matrices based on all available administrative and statistical sources, on supplementary assumptions and information. The analysis of data with respect to the main identity of the system (Supply = Uses) underlines the inconsistencies in the estimates. The differences can be caused by inaccuracies and inappropriate methods in the preceding estimates, errors in the specification items or in the classification of products, or simply calculation errors. The main task of the compilers of supply and use tables is to detect these inconsistencies and solve them.
Because of a huge amount of data and information used in the supply and use tables, detailed by tens, hundreds or sometimes even thousands of products, it is very important to follow a systematic approach to solve the problems. Fortunately, a number of useful instruments are available in a supply and use system to tackle the problems.
1. Ensuring the basic identities for current and constant prices. Any difference between total supply (including margins and taxes) and total use (at current and constant prices) for any product points to an inconsistency. This observation is the starting point for going back to the data and analysing the problem in detail.
2. Checking plausibility and credibility, represents a search for unexpected ratios among data. If something appears to be implausible, one has to look for an acceptable explanation by analysing the underlying sources and discussing the data with experts in the concerned area. Some examples of plausibility checks are:
- comparing the share of each supply component in the total supply (the same for use table components),
- comparing the share of the use categories with total supply, over a set period of time,
- comparing price indices used on the supply side and the main use categories,
- comparing volume indices of output, intermediate consumption and value added,
- comparing price indices of output and price indices of intermediate consumption elements.
All the checks on plausibility and credibility are established based on the type of inconsistency detected in the supply and use tables. Inconsistencies may be caused by errors and inconsistencies in the data provided by statistical units (enterprises, establishments, households etc.) and by administrative sources, or errors created by the employees who work in the compilation of supply and use tables (poor experience, lack of statistical and economic knowledge, etc.). As the resources for national accounts are limited, a systematic approach is required for balancing. In this process of balancing, it is evident that large inconsistencies require more attention than smaller ones.
3. Automatic procedures for balancing are essential in the preparation and management of the supply and use system. The computer plays different roles in the compilation process, from the calculation in the preparation stage to the development of appropriate solution for supply and use balancing. The most widely used method of automatic balancing is called the RAS method[3]. It is used to revise the internal entries in a matrix so that they agree with the margin totals. RAS is used when the margin totals – total supply/use of commodities, or total gross output by kind of activity, for example – are believed to be correct but the breakdown inside the matrix is not consistent with the margin totals. When a benchmark supply and use table is being compiled, manual balancing should be carried out until the remaining differences have been reduced to a minimum (a general rule is that the row and column totals should sum to within ±5% of the known correct marginal figures). RAS and similar procedures will produce a balanced matrix even if the discrepancies are large but the resulting table may be very misleading. Automatic balancing methods cannot judge the reliability of the numbers they are adjusting. That is the task of the national accountants.
To find out more, consult the Handbook of input-output table compilation and analysis, Studies in Methods, Series F, No. 74, UN 1999, Chapter 9: Updating input-output tables: RAS methods, as well as the Eurostat Manual of Supply, Use and Input-Output Tables, Eurostat, European Communities, 2008, Chapter 14: Updating and projecting input-output tables.
One established piece of software used for constructing supply and use tables is ERETES; it provides assistance in compiling national accounts that comply with the international standards such as the 1993 or 2008 SNA. In particular it has been designed to produce two important outputs namely the supply and use table and the Integrated Economic Account Table.
To find out more, consult the ERETES website and the Handbook on Supply and Use Table: Compilation, Application and Practices Relevant to Africa, ACS, UNECA, 2012.
4. Error-search procedures. Based on the countries’ experience in balancing supply and use tables, it is advisable to split up the supply and use system into smaller parts covering a limited number of rows and to search for the main errors at this level. Sector experts will be responsible for the smaller packages of the supply and use system. An integration system must be as simple in its operation as possible. At the same time, it is necessary for the experts working on balancing to have access to the common database and the files containing the complete supply and use system. In addition, automatic procedures can help to eliminate the small discrepancies between supply and demand. This is often done with the help of proportional corrections. Experience shows that the combination of manual and automatic statistical techniques and procedures is the best workable solution to establish a supply and use system.
In summary, the main steps of compiling balanced supply and use tables are the following:
- To collect all information on target totals and the values that can be entered directly into the system as predetermined. Here it is assumed that these have already been prepared and that all data from sub-systems that produce input to the balancing process have already been compiled.
- To create an initial version of the product balances. This version can be compiled using automatic processes, but at this stage a number of unsolved problems will remain: for some products supply will not equal uses, or for most categories of use the totals will usually differ from their targets. This step will be referred to as ‘Automatic balancing’.
- To manually adjust the product balances. The unsolved problems are closely examined and solutions are applied. This step will be referred to as ‘Manual balancing’.
- The differences between target totals of the indicators and the values are removed, except where such differences are considered acceptable. In this step, trade and transport margins, and VAT are finally adjusted to their targets. This step will be referred to as ‘Final balancing’.
To find out more, consult Eurostat Manual of Supply, Use and Input-Output Tables, Eurostat, European Communities, 2008, Chapter 8: Balancing Supply and Use.
Supply and use tables at current and constant prices
The 2008 SNA requires the compilation of supply and use tables at current prices, as well as at constant prices.
Supply and use tables provide an excellent compilation framework for constant price estimates because:
- the tables include an available overview of the extensive set of transaction data, price indicators, and volume indicators;
- they provide a check on the numerical consistency, reliability, and plausibility of supply and demand;
- due to the accounting framework, they require volume indices and deflators of several variables, at different levels of aggregation, interrelated in a systematic way;
- in a supply and use system at current and constant prices, the whole data set can be balanced taking into account the uncertainties of the underlying estimates;
- the supply and use tables give the opportunity to compare the constant price estimates of values at basic prices with those at purchaser’s prices, in relation to the valuation elements, such as trade and transport margins, and taxes on products.
The compilation of supply and use tables in current and constant prices can be carried out in two ways:
- The sequential approach: first, completing the compilation process at current prices (data collection, adjusting the data and balancing); second, deflating these tables; and finally, the values at constant prices are balanced.
- The simultaneous approach: compiling supply and use tables in both prices (current and prices of the previous year) and balancing them ‘at the same time’. At the end of the compilation process, tables at current as well as at constant prices are available.
For the compilation of supply and use tables, it is recommended to follow the simultaneous approach. Its main advantage is that it gives the possibility of analysing value, price and volume indices in relation to each other. The result of this analysis is an improvement of estimates, not only in constant prices, but in the current prices, too. This approach offers the opportunity to check the data by comparing price and volume indices, and the simultaneous balancing at current and constant prices may result in a better allocation of corrections than separately balancing the tables at current prices or constant prices.
A country compiling supply and use tables for the first time will normally start with the estimates in current prices. After that, for the next exercise, it is recommended to organise the compilation procedure of current and constant prices at the same time. Where there is a lack of data sources or their quality is poor, the insufficient prices data can be adjusted based on a simultaneous analysis of resources and uses of products in the economy in current and constant prices. In this way, some of the questions encountered while compiling a constant price table are answered in the inconsistency of data in current prices, and vice-versa.
The compilation process of supply and use tables is summed up in a column-row-column scheme, irrespective of the approach adopted (sequential or simultaneous):
- Filling the columns of the tables (industries and final consumption categories) with data from various sources, adjusted to national accounts concepts,
- Balancing process performed on the rows meaning that the supply and use tables are balanced at product level. The decisions made during this step have an effect on production and intermediate consumption of the industries and, as a result, on their value added,
- Analysing the results obtained by column, more specifically the value added by industry. The unacceptable values mean going back to the analysis by rows and making the necessary corrections.
To a certain extent it is an iterative process.
Applying the simultaneous approach to the compilation of supply and use tables imposes special requirements on the data set. The data at current prices are included in the system after they are deflated so an important step is estimating data in prices of the previous year. Every transaction, output, and intermediate and final consumption must be described in terms of the product at current prices and in prices of the previous year. The methodology applied in the supply and use tables for the estimation of indicators in current and constant prices follows the 2008 SNA requirements.
The article Building the System of National Accounts - volume measures presents the conceptual background of price and volume measures in national accounts, the main data sources and methods used for the annual estimates.
In order to calculate indices, it is necessary to have values at current prices of the previous year. For every entry in the supply and use table, three values must be available: a value for the year t at prices of t-1, and a value at current prices for years t-1 and t. This set of data allows the national accountant to carry out the double check of data consistency; even if the results at current prices look plausible, analysis of the volume and price data can presents serious problems. When prices change rapidly, it is evident that analysis in volume terms is to be preferred.
When the balancing phase has been completed, the users have at their disposal a system of tables containing consistent and detailed data on values, volume changes and price changes of goods and services. In addition, this system includes detailed information on levels and trends in primary incomes and final demand in both nominal and volume terms. The links between these tables are presented in Figure 18.

To find out more, consult the Handbook of input-output table compilation and analysis, Studies in Methods, Series F, No. 74, UN 1999, Chapter 11. Input-output tables and production accounts in constant prices; Eurostat Manual of Supply, Use and Input-Output Tables, Eurostat, European Communities, 2008, Chapter 9: Supply and use tables at constant prices as well as The 2008 SNA, European Commission, IMF, OECD, UN, World Bank, 2009, Chapter 14: The supply and use tables and goods and services account.
Concluding remarks
The compilation of supply and use tables for the first time in order to meet the objectives of Milestone 1 of the 2008 SNA implementation is very laborious, requires a large investment of human resources and is time consuming. This investment, although costly, is necessary to ensure the quality of the national accounts estimates and to provide useful and coherent information to the users.
The supply and use tables have a special role in the compilation of national accounts, by providing the framework that guarantees the consistency of all indicators, in current and constant prices. Their elaboration represents an important part of the national accounts compilation process; in general terms, the main advantages are the following:
- supply and use tables are the most efficient way to incorporate all basic data, be it administrative or statistical, aggregated or detailed, in a systematic way, in order to estimate national accounts;
- supply and use tables achieve consistency in the national accounts indicators at a detailed level, thereby ensuring their quality in the framework of the supply and use tables;
- the framework of the supply and use tables includes the components of the production, income and expenditure approaches to measuring GDP, thereby enabling a coherent and balanced estimate of GDP both in current prices and constant prices;
- the balanced supply and use tables provide consistency and coherency between the first three accounts of institutional sectors: Goods and Services Account; Production Accounts by industry and sector; and Generation of Income Accounts by industry and sector.
The implementation of the supply and use tables in the current practice of the statistical office is a crucial decision and is based on:
- availability of data sources supporting their implementation;
- capacity of the unit in charge with the compilation of supply and use tables;
- needs of users and advantages for the national accounts and statistical system development.
After the decision has been taken, the strategy for the implementation is elaborated. All phases of the 2008 SNA strategy presented in the article Building the System of National Accounts - strategy should be completed with a special part dedicated to the compilation of the supply and use tables. Special attention should be paid to the organisation of the national accounts department, which is responsible for the elaboration of the supply and use tables. Setting the tasks and the work flow inside the department is based on the number of experts and their professional capacity because development of the supply and use tables is a complex process and requires not only a very good knowledge of national accounts methodology, but also a deep understanding of all economic and social indicators existing in the statistical and administrative system as well as the economic phenomena of the country.
Questions for practitioners
- Do you intend to compile supply and use tables in your country? When will you be able to provide the first estimations?
- Has a strategy been developed for the implementation of the supply and use tables?
- Is there demand for supply and use tables in your country from the government, economists, etc.? Is the statistical office prepared to respond to these demands?
- If you have supply and use tables, to what extent are they used in the economy and by whom? Does the statistical office provide methodological support to the users in order to get familiar with the methodological requirements?
- What are the main problems encountered in the process of supply and use table compilation? How have they been solved? Are they integrated in the general strategy of the statistical system development?
Direct access to
- Building the System of National Accounts (online publication, overview of all articles)
- Essential SNA - Building the basics
- Eurostat Manual of Supply, Use and Input-Output Tables
- Eurostat’s ESA 95 manual on Input-Output: Valuation matrices (First complete draft) Norbert Rainer, paper presented 13th International Conference on Input-Output Techniques 21-25 August 2000, Macerata, Italy
- United Nations - The 2008 SNA, European Commission, IMF, OECD, UN, World Bank, 2009; Chapter 6: The production account; Chapter 14: The supply and use tables and goods and services account
- The African Centre for Statistics (ACS) United Nations Economic Commission for Africa (UNECA) - Handbook on Supply and Use Table: Compilation, Application, and Practices Relevant to Africa (Draft version of 25 January 2012)
Notes
- ↑ Report of the ISWGNA at the twenty-ninth session of the UNSC, document E/CN.3/1997/12.
- ↑ The correlations between the three types of prices are presented the section on fundamentals for national accounting of the article Building the System of National Accounts - basic concepts
- ↑ The iterative proportional fitting procedure (IPFP, also known as biproportional fitting in statistics, RAS algorithm in economics and matrix raking or matrix scaling in computer science) is an iterative algorithm for estimating cell values of a contingency table such that the marginal totals remain fixed and the estimated table decomposes into an outer product. Source: http://en.wikipedia.org/wiki/Iterative_proportional_fitting