Building the System of National Accounts - administrative sources
This article is part of a set of background articles explaining in some detail how statistics producers, such as national or international statistical institutes, may build a coherent system of national accounts (SNA), especially in developing countries. The articles are based on the official Eurostat handbook Essential SNA - Building the basics and they focus particularly on the early stages of the implementation.
The aim of this article is to highlight the fact that the status and quality of the statistical infrastructure make a decisive contribution to the compilation and quality of national accounts. One of the main pillars of statistical infrastructure, administrative data sources, is identified and described in this article. Administrative data sources may be subject to special treatment to meet SNA requirements.
The other main components of statistical infrastructure, business register and statistical classifications and statistical data sources have their own articles.
The statistical information required for compiling national accounts is based on administrative sources. The arguments favouring the use of these sources for statistical purposes when compiling national accounts highlight their importance. This article outlines the main elements for transferring administrative data sources into national accounts indicators.
Full article
What are administrative sources?
The term ‘administrative record’ encompasses any record resulting from fiscal, taxation or other authority requirements, created to facilitate the administration or operation of government programmes, or to supervise and oversee compliance with legal obligations by certain segments of society.
Administrative processes are set up in response to legislation and regulations. Each regulation (or related group of regulations) results in registering institutional units – enterprises, persons, etc. – bound by that regulation and in a data set. The register and data are referred to collectively by the statistical office as an administrative source.
Administrative sources contain information that is not primarily collected for statistical purposes, but is used by statistical offices. Some examples of administrative sources include the following:
- value added tax (VAT) data;
- personal income tax data;
- business (including corporate) taxation data;
- social security data;
- business registration and administration records;
- business accounts of corporations;
- records held by Central Banks;
- records (other than VAT) held by Customs and Excise Authorities;
- records of government (central and local);
- records held by associations of employers, of employees and of businesses and professions;
- records held by other private sector bodies, e.g. credit-rating agencies, non-profit units, etc.
The use for statistical purposes of administrative sources requires a careful evaluation of their conceptual base, classification and time reference.
The use of administrative data offers several advantages:
- They are ‘cheaper’ than other sources and often even free.
- They provide complete, or almost complete, coverage of the population to which the administrative process applies. Generally they have very high response rates, no survey errors, providing more accurate and detailed estimates of sub-populations.
- The timeliness of the statistical variables derived from administrative sources is improved. This is particular the case for annual ad hoc surveys, which are based on administrative sources via the business register (however this does not apply to short-term indicators).
- They reduce the response burden on businesses.
- They may increase business register quality, which is why statistical surveys are carried out.
Although there are many good reasons for using administrative sources, there are also a number of problems:
- The most important problem for a statistical office, and implicitly for national accountants, is obtaining access to administrative sources. This may be because there is no legal framework in place between the statistical office and the authority gathering the data. Sometimes, it may respond to practical issues relating to data transfer (formats, details, responsibilities, ways of collection, etc.). This problem can be easily avoided if agreements and memoranda of understanding (clearly establishing frequency, data format and any relevant information for data transfer) are signed between the statistical office and the administrative authority.
For more detailed information concerning the access to administrative data sources see Building the System of National Accounts - strategy.
- The information used in administrative sources does not directly correspond to the statistical indicator definitions. The process of converting concepts used in administrative units (which may often be equivalent to legal units) to national accounts will be presented later.
- The classification systems used within administrative sources may be different from those used in the statistical world, or may be applied differently, depending on the purpose of the administrative source. When possible, it is preferable to rely on several administrative data sources.
- Another common problem relates to timeliness. Data may either not be available in time to meet statistical needs or may refer to a period that does not coincide with that required for statistical purposes, e.g. a tax year may not coincide with the calendar year required for structural business statistics.
- Administrative sources are generally set up for the purpose of collecting taxes or monitoring government policies. For this reason, they are susceptible to political change. If a policy changes, administrative sources may be affected in terms of coverage, definitions, thresholds etc., or possibly even abolished completely.
Despite these problems, administrative data is an important data source. The use of these sources for compiling national accounts has an important effect on the quality of results.
Transition to national accounts
One important phase in the national accounts compilation process is the translation of information from the administrative source into national accounts concepts.
The compilation process of national accounts is presented in the section, The 2008 SNA implementation strategy, in Building the System of National Accounts - strategy.
The main administrative sources used for compiling national accounts are the financial statements of the stakeholders involved in different economic actions.
National accounts are virtually standardised worldwide, while business accounting (financial statements) is still in the process of international harmonisation.
The International Accounting Standards Committee (IASC)[1] was created in 1973 to establish basic accounting standards referred to as IAS (International Accounting Standards) and then International Financial Reporting Standards (IFRS). Since its creation, IASC has issued and implemented accounting standards which were then changed, or abolished, or replaced by new ones, in line with the economic environment at the time.
Data quality increases in pace with the degree of standardisation of private accounts. However, even when business accounts are not compiled using a strictly standardised basis, they may be used for compiling national accounts, especially for sectors of the economy dominated by a small number of very large enterprises.
In general, the main rules and methods for business accounting (IAS/IFRS) are consistent with those of the SNA. Examples are: recording transactions in accounts using the accrual principle, double-entry principle and use of balances, monetary valuation, and internal consistency of the accounts system.
Depending on the specificity of each country’s business accounting, national accountants may apply certain ‘bridge tables’ that serve to convert business accounting indicators (obtained at mezzo-economic level like, for example, sectors of activity) into national accounts aggregates, albeit in a rough format. Due to the fact that micro-indicators do not exactly fit the requirements of the SNA aggregates, the transition is completed by applying certain adjustments, such as: conceptual adjustments, adjustment to achieve accounting consistency with other sectors and adjustments for exhaustiveness.
Preparation of ‘bridge tables’, as part of compiling a national accounts strategy, follows the phases outlined below:
- identification of administrative data sources;
- analysis of content in respect of national accounting methodological requirements;
- collection of data source indicators;
- translation of each indicator from administrative data sources into national accounts concepts;
- application of adjustments to meet national accounting requirements;
- estimation of the national accounts indicators.
‘Bridge tables’ are used for non-financial and financial corporations, for government and for the rest of the world using the existing administrative data source format.
Financial statements of non-financial corporations
IAS 1 is the reference standard for the ‘Presentation of the financial statement’, whose proposed structure is applied as such for non-financial corporations (or enterprises). Various other standards regulate specific accounting issues pertaining to the activities of an enterprise.
Enterprises disclose their accounting information by using at least two accounting statements:
- the income statement, covering income and costs transactions during the financial year, considered as flow accounts;
- the balance sheet, showing the value of assets and liabilities at the end of the financial year, covering stock accounts.
International standards also require information on:
- cash flow statement, which specifies an enterprise’s sources and uses of cash from operating, investing and financing activities, during the financial year; its aim is to present real cash flows and it is similar to the SNA in the sense that internal transactions for depreciation and reservation are not taken into account.
- accounting policies and explanatory notes, offering valuable details about how the information already disclosed was completed.
Compilation of national accounts using data from non-financial business accounting is easier if the income statement is presented by nature (origin of the expenditures such as: depreciation, purchase of materials, transport costs, employee benefits, and advertising costs) instead of by function (destination of expenditures such as: costs of sales, selling and administrative expenses).
The income statement is mostly used for drawing up the production account of non-financial enterprises. Output and intermediate consumption can be roughly calculated as follows (assuming the availability of an income statement presented mostly by nature):
Output = Output sold + Output held as inventory + Capitalised output + Sales of goods bought for resale – Purchases of goods bought for resale + Changes in stocks of finished and semi-finished products + Changes in stocks of goods bought for resale + Other operating income
Intermediate consumption = Purchases of raw materials and supplies – Changes in stocks of raw materials and supplies + Other purchases and external charges + Other operating costs
Compensation of employees corresponds to the expenses incurred by an enterprise in relation to its employees, a definition which is also used in private accounting, so that there are relatively few adjustments to be made to convert data from business accounting to national accounting.
Other indicators may be estimated using information from the financial statements:
- Taxes and subsidies are recorded in an enterprise’s financial statement. Business accounts are generally operated exclusive of deductible VAT so that the information on input VAT and output VAT often only appears in the notes to the accounts. Other production taxes and other production subsidies appear in the income statement. The tax on profit paid during the course of the financial year may be found either in the income statement of the previous financial year, or in the sources and uses of funds statement for the financial year or in the appended tables.
- Property income includes interests, dividends, rents on non-produced assets and equity earning. Interest received and paid appears in the income statement, and must be adjusted for financial intermediation services indirectly measured (FISIM). Income received from investment must also be increased by commission deducted at source. Dividends received appear on the credit side of the income statement. Conversely, dividends paid by an enterprise appear neither on the income statement, nor on the balance sheet, and it is therefore necessary to consult another document such as the sources and uses of funds statement. Reinvested earnings on direct foreign investment cannot be gleaned directly from either the balance sheet or the income statement, and can only be estimated on the basis of supplementary information about company shareholders. Property income allocated to policyholders is deducted from insurance premiums paid by an enterprise by applying a ratio calculated from the accounts of insurance companies.
- Other current transfers are rarely identifiable as such in business accounting as they are often grouped with other items under ‘other income’ or ‘other expenses’.
- Gross fixed capital formation is defined in national accounting as the difference between acquisitions and disposals of fixed assets. These two components may be separately extracted from business accounting (especially from the balance sheet) by type of assets. However, the main impediment to directly transposing these two information items to national accounts is due to their evaluation, as national accounts requires valuing them at current market prices. The best way to value acquisitions is to use a reconciliation schedule between the opening and closing book values of fixed assets. This schedule, which has been made mandatory by the IFRS standards, provides information on acquisitions and the various elements that allow a transition from the opening value of the assets to their closing value, maintaining their fair value. On the other hand, when assets are valued on the basis of an amortisation schedule, the reconciliation schedule only provides information on disposals valued at historic cost. To translate the disposal price when estimating national accounts, capital gains or capital losses made on these disposal operations need to be taken into consideration. When this information is not expressly shown in the income statement, disposal value may be reconciled with the historical cost taken from the reconciliation schedule which appears in the cashflow statement. For all enterprises, payments must differ very little from disposals. Available accounting documents should allow for distinguishing tangible fixed assets from intangible fixed assets and financial fixed assets.
- The balance sheet in national accounting is very similar to that of business accounting, in particular where the latter applies the concept of fair value. Two main limitations need to be pointed out: possible differences in classification and evaluation at historic cost of assets. Information contained in the balance sheet may be used to value fixed assets. National accountants generally use perpetual inventory methods (PIM) to value them.
Figure 1 presents a simplified ‘bridge table’, with no other adjustments, when very few indicators are available from accounting statements, on the hypothesis that cash-flow statements can provide information on actual flows (at current valuation).

From the numerical example, the main indicators can be estimated
Output = 32 200 (1) + 500 (2) + 80 (3) + 300 (4) - 100 (5) = 32 980
Intermediate consumption = 15 000 (6) + 10 000 (7) – 300 (8) = 24 700
Gross value added = Output (32 980) – Intermediate consumption (24 700) = 8 280
After establishing the rough ‘bridge table’, the transition from business accounting to national accounting may be completed by making some adjustments to base data – mostly for compiling value added.
The main adjustments that can be made are:
- Conceptual adjustments
Conceptual adjustments are required because of differences in the concepts used in country-specific private accounting and in national accounting. The nature of the adjustments applied to each indicator is diverse, but sometimes the same adjustments can be applied for consistency. They vary among countries, thus no comprehensive list can be supplied; however a few examples can be presented:
- In the case of output, adjustments are applied for the transition to basic price. The turnover of enterprises is generally net of VAT but often includes taxes on products. Contrarily, subsidies on products are rarely included in turnover. Therefore, data resulting from business accounting needs to be adjusted by deducting taxes on products and adding subsidies on products in order to obtain the basic price.
- Own-account output for research and development is part of output. In business accounting it is not valued and an adjustment must be made to the total value when translating it to national accounting.
- Adjustment for deliveries between establishments belonging to the same enterprise impacts on the value of output and intermediate consumption. Such deliveries are not usually the object of a sale and although they do not appear in the accounts system of an enterprise, they have to be recorded in the national accounts where they correspond to an output and/or intermediate consumption by one establishment delivered to another establishment belonging to the same enterprise.
- Adjustment for holding gains/losses in stock valuation. Holding gains/losses may appear whenever elements from the income statement are deducted from elements valued in the balance sheet. In business accounting, stock changes are measured by the difference between the closing stock value and the opening stock value. In national accounting, the stock changes correspond to the difference between entries into and withdrawals from stock. For example, an intermediate consumption of raw materials generally originates not directly from a purchase, but from a withdrawal from stock.
- In the case of output, adjustments are applied for the transition to basic price. The turnover of enterprises is generally net of VAT but often includes taxes on products. Contrarily, subsidies on products are rarely included in turnover. Therefore, data resulting from business accounting needs to be adjusted by deducting taxes on products and adding subsidies on products in order to obtain the basic price.
In national accounting, a withdrawal from stock must be valued at the market price at the time it took place, while business accounting values a withdrawal from stock at its historical cost (i.e. at the price of the goods item at the time they were purchased). The difference between the two prices is considered in national accounting as a holding gain or a holding loss.
- Consumption of fixed capital included in national accounts is different from the depreciation concept existing in the accounting system and adjustments are necessary.
- Consumption of fixed capital included in national accounts is different from the depreciation concept existing in the accounting system and adjustments are necessary.
- Adjustments for consistency with the accounts of other sectors
This adjustment applies in particular to taxes and subsidies. Taxes and subsidies derived from the accounts of an enterprise must be equivalent to those received by or paid by general government. In practice, this is not the case. Data from business accounts has to be adjusted because usually information relating to general government is more reliable than those drawn from the statistics of enterprises. - Adjustments for exhaustiveness
They are applied to improve the coverage of national accounts aggregates. They can depend on various situations such as: absence of an enterprise from statistical files, exemption from tax and social declarations, and evasion.
An example with the main adjustments necessary to obtain national accounts indicators is presented in Figure 2.

Financial statements of financial corporations
There is a wide variety of financial units in the world. To describe them all is beyond the scope of this handbook, so only the financial units that best describe the three main types of financial services (financial intermediation, financial auxiliary services and insurance and pension schemes services) will be explained.
- Banks
Banks are deposit-taking corporations whose main activity is financial intermediation. They have liabilities in the form of deposits or financial instruments (such as short-term certificates of deposit) that are close substitutes for deposits. Their accounting is internationally standardised, using the structure required by IAS 1, but also in accordance with other standards (such as IFRS 2 ‘Share-based payment – Vesting conditions and cancellations’, IAS 23 ‘Borrowing costs’, IFRS 7 ‘Financial instruments: disclosures’, etc.).
Banks accept deposits from units wishing to receive interest on funds for which the unit has no immediate use and lends them to other units whose funds are insufficient to meet their needs. Each of the two parties pays a fee to the bank for the service provided, the unit lending funds by accepting a rate of interest lower than that paid by the borrower, the difference being the combined fees implicitly charged by the bank to the depositor and to the borrower. From this basic idea emerges the concept of a ‘reference’ rate of interest (R*). The difference between the rate paid to banks by borrowers and the reference rate R* plus the difference between the reference rate R* and the rate actually paid to depositors represents the costs for Financial Intermediation Services Indirectly Measured (FISIM).
Figure 3 shows the simplified bridge table for banking institutions linking income statement transactions (as stated by IAS/IFRS and European Directives on Accounting) to SNA transactions and a fictitious numerical example (first column of the table) to show how to estimate the output and the intermediate consumption.

From the numerical example, the main indicators can be estimated:
FISIM = FISIM loans + FISIM deposits = [78 820 (3) – 4 378 889 (1) x R*] + [512 500 (2) x R* – 61 830 (5)] = 13 137 + 15 458 = 28 595
Output = 28 595 + 10 950(6) = 39 545
Intermediate consumption = 2 980 (7) + 10 480 (9) = 13 460
Gross value added = 39 545 – 13 460 = 26 085
R* - reference rate of interest, with no service element (usually an inter-bank borrowing and lending rate); let us assume that R* = 1.5%
Estimates for other SNA transactions from financial statements adopt the same approach as for non-financial corporations, bearing in mind the fact that no subsidies are usually offered to financial institutions and that classified taxes must be made consistent with the rest of the institutional sectors, as described for non-financial corporations.
- Insurance services
Insurance services are specific financial intermediations. The accounting statements of insurance companies are regulated by international standards, such as IAS 1.
Expenses are in general disclosed by function, although classification by nature (including wages and salaries) may be found in the Notes to financial statements.
The output of insurance services in 2008 SNA is particularly important. The formula for compiling output is described separately for non-life insurance and life insurance. Within the SNA, the output of the insurance industry is determined in a manner intended to mimic the premium-setting policies of insurance corporations. Output is usually compiled using income statements, while the technical account is the main part of the income statement which relates exclusively to insurance activity.
The basic method for measuring non-life insurance output is the following:
Total premiums earned, plus premium supplements, less adjusted claims incurred (the 2008 SNA, Chapter VI: The production account, paragraph 6.185).
Figure 4 offers a model of a simplified bridge table for non-life insurance institutions linking income statement transactions (as set out in IAS/IFRS and European Directives on Accounting) to SNA transactions, plus a fictitious numerical example to show how the main indicators are calculated.

From the numerical example, the main indicators can be estimated:
Output = Premium earned (25 700 (1) – 40 (6)) + Premium supplements (700 (5)) + Other technical income (100 (3)) - Adjusted claims incurred (6 500 (4) + 90 (8)) = 19 870
Intermediate consumption = Net operating expenses (3 000 (7)) – Wages and salaries (800 (7e)) – Depreciation (250 (7f)) = 1950
Gross value added = Output (19 870) – Intermediate consumption (1 950) = 17 920
The output of life insurance is based on the following formula:
Premiums earned, plus premium supplements, less benefits due, less increases (plus decreases) in life insurance technical reserves (The 2008 SNA, Chapter VI: The production account, paragraph 6.195).
The simplified bridge table for life insurance institutions linking income statement transactions to SNA transactions is shown in Figure 5. As usual, a numerical example is also provided in the table and calculations of the main indicators below the table.

From the numerical example, the main indicators can be estimated:
Output = Premium earned (13 000(1) – 30(7)) + Premium supplements (4 600(2)) –Difference of gains and losses in realisation of investments (40 (3) – 60 (12)) – Benefit due (3 000(5)) – Changes (+/–) in technical reserves (100(6)) = 14 490
Intermediate consumption = Net operating expenses (5 000 (8) – 1 250 (9) – 900 (10)) + Investment charges (30 (11)) + Other technical charges, net of reinsurance (1 (13)) = 2 881
Gross value added = Output (14 490) – Intermediate consumption (2 281) = 11 609
Government financial statement
Administrative data sources for the general government sector are a central element in compiling national accounts. Statistics for government units and public corporations are often derived directly from the microdata in the government financial accounting database and are based heavily on accounting information. The development in recent years of International public sector accounting standards by the International Public Sector Accounting Standards Board of the International Federation of Accountants has increased the need for clear guidance on the compilation of government finance statistics so that detailed accounting data can be transposed correctly into the framework of the SNA. Such guidance is especially important when government financial accounts are compiled on a cash basis and must be converted to an accrual basis to comply with SNA accounting methods.
Essentially the presentation of government finance, based on the budgets of government units (state, central, local, social security, etc.) consists of transactions that increase net worth leading to an aggregate called ‘revenue’ and transactions that decrease net worth leading to an aggregate called ‘expense’. In addition, there are two main balancing items: ‘net operating balance’ and ‘net lending or net borrowing’. Additional accounts can be shown for other economic flows and balance sheets.
Revenues include all resources acquired by governments as recorded in the SNA current accounts and capital transfers receivable recorded in the capital account. Revenues comprise: taxes, social contributions including grants, other current revenue (property income, market sales of goods and services, fines, penalties and forfeits, voluntary transfers, miscellaneous and unidentified revenue) and capital transfers receivable.
Expenses may be defined as all uses incurred by governments as recorded in the SNA current accounts and capital transfers payable as recorded in the capital account. Specifically, expenses cover: production expenses (compensation of employees, intermediate consumption and consumption of fixed capital), interest payable, grants, social benefits, other current expenses and capital transfers payable.
Net lending or net borrowing is the amount a government has available to lend or must borrow to finance its non-financial operations. Net lending or net borrowing can be calculated as the net operating balance less the net acquisition of non-financial assets, or as total revenue less total outlays.
Government budgets in each country are determined by law, being first adopted, and then executed during the period (year). Data are allocated to SNA elements, according to two classifications of expenses:
- Economic classification of expenses
- Functional classification - Classification of the functions of government (COFOG).
Figures 6 and 7 offer an example (not exhaustive) of how each transaction extracted from government data contained in the budget income and expenses (here the State budget) are linked to SNA transactions. Note that each budget may contain, under the main titles, specific items according to specific necessities of the government units in each country.
From budgetary execution data, functional classification allows direct classification by activity. Thus, COFOG is more appropriate than ISIC for classifying government expenditure because the COFOG list of functions is more detailed than the ISIC list of activities, having been drawn up specifically to take into account the range and diversity of government activities.
- Simplified bridge tables for the State budget

Figure 6: Simplified tables for the State budget: Income - Note: SNA transactions are presented in Building the System of National Accounts - basic concepts, Figures 3-5.
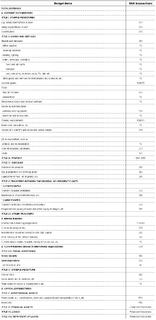
Figure 7: Simplified tables for the State budget: Expenses - Note: SNA transactions are presented in Building the System of National Accounts - basic concepts, Figures 3-5.


- Balance of Payments
The balance of payments (BoPs) is the main data source that describes the international transactions used for building accounts for the rest of the world sector of SNA.
The 2008 SNA uses the same macroeconomic framework as the 'Balance of payments and international investment position manual' 6th edition (BPM6).
The Balance of Payments includes all the transactions between residents and non-residents during a specific time period.
International accounts cover accounts for current transactions (current accounts), accumulation accounts and balance sheets. The three current accounts are the goods and services account, the primary income account and the secondary income account. The primary income account corresponds to the allocation of primary income accounts in the SNA and the secondary income account corresponds to the secondary distribution of income account in the SNA. The structure of balancing items in the balance of payments is somewhat different from that in the SNA, in that each account has its own balancing item and another that carries forward to the next account.
With respect to the capital account, the transactions covered are more restricted than those covered in the SNA, including only acquisitions and disposals of non-produced non-financial assets and capital transfers.
In the description of the rest of the world accounts, exports, for example, are treated as a use by the rest of the world and imports as a resource from the rest of the world. Thus the BPM6 entries are the mirror image of the SNA entries.

Concluding remarks
The use of administrative data sources is an important aspect of the national accounts estimation process. Statistical offices attempting to reach the first milestone for compiling the SNA must pay special attention to the identification, collection and uses of administrative data (following the phases presented in Building the System of National Accounts - strategy).
Figure 9 shows the main administrative sources according to which national accounts indicators can be estimated. The list is very synthetic, because administrative sources depend on country organisation, level of economic development and the way in which international recommendations are applied.

Questions for practitioners
The use of administrative data sources for compiling national accounts requires the following issues be answered:
- What is the administrative data in the country? What is its content, frequency, and deadline for dissemination? Could it be useful for national accounts purposes? Do you use them?
- What is the current situation concerning the use of administrative sources for statistical purposes?
- Is it possible to gain access to these sources? Do agreements and memorandums for collaboration need to be set up?
- Are the proper ways of collecting administrative records and using them for statistical purposes in place? Have all administrative data sources been examined to determine to what extent the data they contain can be used to support the statistical programme?
- Do 'bridge tables' exist for translation from accounting indicators to NA concepts?
- Have the procedures for transforming from business to national accounting concepts been defined and fully understood by survey and national accounts staff?
- Does there exist a strategy for improvement of the use of administrative sources?
In many developing countries and small islands, the problem of accessing the data sources needed for compiling the SNA does not only depend on the lack of basic statistical data, but also on legal and institutional arrangements: administrative data may be used for national accounts purposes if it is mandated by law and regulations. Under these conditions, the most important problem (lack of available data sources) may be resolved by creating the conditions for accessing administrative data.
Direct access to
- Building the System of National Accounts (online publication, overview of all articles)
- Afristat - Guide methodologique pour l’elaboration des comptes nationaux dans les états membres d’Afristat, Serie Méthodes No.4, 2001, Chapter II-III: 'Le comptes des administrations publiques'; Chapter II-IV: 'Le commerce extérieur et la balance des paiements'; Chapters II-VII: 'Le traitement des données d’entreprises'
- Fritz B., MPRA - Uses of National Accounts; History, International Standardization and Applications in the Netherlands, Eagle Economic & Statistics, Working paper 2008-1; Chapter II: The early estimates (1660-1930); Chapter III: Revolutionary decades (1930-1950); Chapter IV: The era of the international guidelines (1950-.)
- IAS Plus: Summaries of IFRSs and IASs
- IMF - Balance of Payments and Investment Position Manual (BPM6), sixth edition, 2009
- OECD
- Policy Uses of National Accounts: An OECD Perspective, paper presented to the joint ECE/Eurostat/OECD Meeting on national accounts, 2002
- Understanding National Accounts, Lequiller F., Blades D., OECD 2006
- United Nations
- 2008 SNA, European Commission, IMF, OECD, UN, World Bank, 2009; Chapter 1: ‘Introduction’; Chapter 22: ‘The general government and public sector’; Chapter 26: ‘The rest of the world accounts and links to the balance of payments’
- National Accounts: A practical introduction, Studies in Methods, Series F, No.85, UN 2003; Chapter VIII: SNA framework for the total economy
- A Systems Approach to National Accounts Compilation, Studies in Methods, Series F, No.77, UN 1999; Introduction
- Use of Macro Accounts in Policy Analysis, Studies in Methods, Series F, No.81, UN 2002; Chapter II: The role of macroeconomic and social accounting in policy analysis; Chapter III: Uses of National Accounts in economic analysis
- International Standard Industrial Classification of All Economic Activities - Revision 4, Statistical papers, Series M No. 4/Rev.4, UN 2008
- Links between business accounting and national accounting, Studies in methods Series F, No 76, UN 2000
Notes
- ↑ This was replaced in 2001 by the The International Accounting Standards Board (IASB)