Archive:Urban-rural typology update
Updated urban-rural typology: integration of NUTS 2010 and the latest population grid
Statistics in focus 16/2013; Author: Regional statistics team
ISSN:2314-9647 Catalogue number:KS-SF-13-016-EN-N
This Statistics Explained article is outdated and has been archived - for recent articles on European cities see here.
The Urban-rural typology classifies the NUTS-3 regions of the European Union (EU) into three different categories: predominantly urban, intermediate and predominantly rural. The methodology used to do this has remained unchanged (see here).
However, the typology has been updated by taking the latest version of the NUTS classification and population grid into account. In the following text, the term 'update' refers to these changes. The aim of this article is to explain and present the impact of these changes on the main indicators released in accordance with the Urban-rural typology.
Urban-rural typology
The Urban-rural typology is a geographical typology based on the definition of urban versus rural grid cells of 1 km² each. The typology classifies the NUTS-3 regions into three groups: predominantly urban, intermediate and predominantly rural regions. The type of region depends on the share of the regional population living in rural grid cells, also called the rural population. According to the definition, the predominantly urban regions have less than 20 % rural population, intermediate regions between 20 % and 50 % and predominantly rural regions more than 50 %.
The main inputs used for establishing this typology are the NUTS classification and the population grid. Both of these inputs have been updated. NUTS 2010 replaces NUTS 2006 and the 2006 population grid supplants the 2001 population grid. The Urban-rural typology has been recalculated taking these changes into account. The methodology applied to classify the regions has not been changed. So the differences are due to the new version of the NUTS classification and the new population grid used to define grid cells.
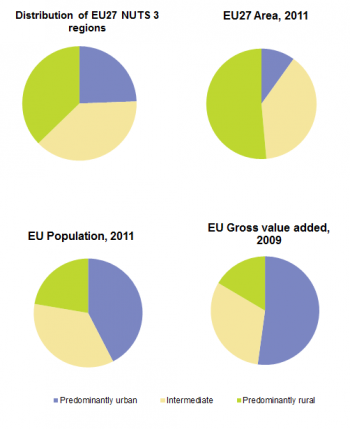
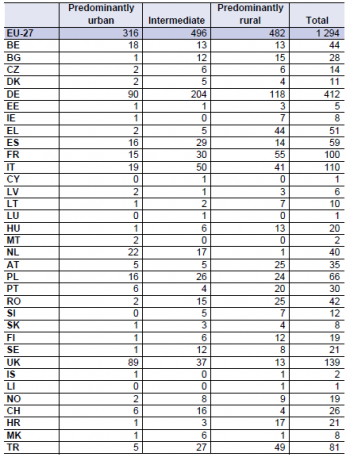
Moreover, the geographical coverage of the typology has been extended to EFTA and candidate countries, more specifically to the level 3 statistical regions of these countries, as shown in Map 1 and 2. Among the 1294 NUTS-3 regions included in NUTS 2010, 316 are classified as predominantly urban, 496 as intermediate and 482 as predominantly rural, as shown in Table 1. In Europe, 22 Member states had at least one region in each type. Ireland and Slovenia had only two types of NUTS-3 regions. All Irish NUTS-3 regions are classified as predominantly rural, except for the region of Dublin, which is classified as predominantly urban. Slovenia has 5 intermediate regions and 7 predominantly rural regions. Malta, Cyprus and Luxembourg all have only one type of region. In fact, Luxembourg and Cyprus consist of just one NUTS-3 region, classified as intermediate, and the two Maltese regions at NUTS level 3 are both classified as predominantly urban.
Impact of NUTS 2010 and the new population grid
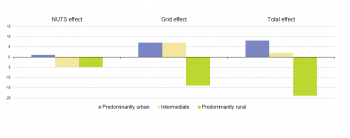
NUTS 2010 includes 1294 NUTS-3 regions while NUTS 2006 included 1303. In fact, 39 new regions have replaced 48 old regions. The new regions came about due to merges, splits or boundary shifts. Such changes occurred in 5 Member states: Germany, Finland, Italy, the Netherlands and the United Kingdom. Of the 48 old regions, 20 were classified as predominantly urban, 21 as intermediate and 7 as predominantly rural, as shown in Table 2. These regions have been replaced by 39 new regions, of which 21 are predominantly urban, 16 intermediate and 2 predominantly rural. The net impact of these changes can be called ‘the NUTS effect’ and is presented in Figure 3. As an example, the Finish region ‘Ita Uusima (FI182)’, classified as predominantly rural, has been merged with the predominantly urban region ‘Uusima (FI181)’, creating a new region ‘Helsinki-Uusima (FI1B1)’ classified as predominantly urban, as shown in Figures 2. The typology update has also brought with it other kinds of changes, as shown in Figure 2. There were no changes in Estonian regional boundaries between NUTS 2006 and 2010. Based on the new population grid, however, the share of the rural population in the region of ‘Pohja-Eesti’ is now less than 20 %, so the region has been reclassified as predominantly urban. The other changes in NUTS 2010 compared with NUTS 2006 consist of code or label changes. In terms of their boundaries, 1255 NUTS-3 regions remained the same in NUTS 2010 compared with NUTS 2006. Of these 1 255 regions, only 45 regions belonging to 13 Member states (highlighted in Table 3) have been reclassified under another type. Thus, 4 predominantly urban regions have been reclassified as intermediate, 11 intermediate regions have been reclassified as predominantly urban and 8 as predominantly rural, and 22 predominantly rural regions have been reclassified as intermediate, as shown in Table 3. Reclassifications were quite limited in number and in step. In fact, none of the predominantly urban regions has been reclassified as predominantly rural or vice versa.
The net impact of these changes can be termed ‘the grid effect’, and is presented in Figure 3. The use of NUTS 2010 and the new population grid has affected the Urban-rural typology in two ways. Firstly, there are 39 new regions, i.e. due to the NUTS effect; secondly, some of the 1255 unchanged regions have been reclassified, i.e. due to the grid effect, as shown in Figure 3.
Taking into account both effects, the updated typology now includes 8 more predominantly urban regions, 2 more intermediate regions and 19 fewer predominantly rural regions, as shown in Figure 3. This shows that the impact of the updated typology has affected predominantly rural regions to a greater extent than the other two types of regions.
Impact on the distribution of area by type of region
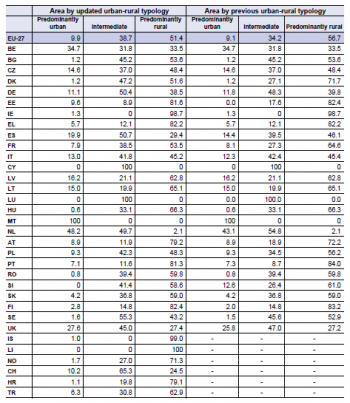
The update has also affected the distribution of area by Urban-rural typology. In order to evaluate the impact, the distribution of area by the updated typology can be compared with the distribution under the previous typology for a single reference year, namely 2011. In 2011, predominantly urban regions covered 9.9 % of EU territory, intermediate regions 38.7 % and predominantly rural regions 51.4 %.
Under the former typology, predominantly urban regions accounted for 9.1 % of EU territory, intermediate regions 34.2 % and predominantly rural regions 56.7 %.
Thus, due to both effects of the update, the area of predominantly urban regions increased by 0.8 %, that of intermediate regions rose by 4.5 % and that of predominantly rural regions fell by 5.3 %, as shown in Figure 4. As the typology remained identical in 13 Member States, the impact was quite limited, at least at EU level. However, there was some variation from country to country. The impacts were more pronounced in Denmark, Spain and Slovenia but very limited for Italy and Finland. As an example, the region of ‘Sydjylland (DK032)’ in Denmark, accounting for 20 % of the Danish area, was previously classified as predominantly rural and has been reclassified as intermediate. This reclassification fully explains the impact shown in Figure 4.
The EU population became more urban
As with area analysed in the previous paragraph, the update has also affected the distribution of the population by Urban-rural typology. In order to evaluate the impact, the same method is applied using the population for a single reference year, namely 2011. In 2011, 502 million people lived in the EU, of which 42.4 % in a predominantly urban region, 35.3 % in an intermediate region and 22.3 % in a predominantly rural region under the updated Urban-rural typology, as shown in Table 5. Under the previous typology, 41.3 % of the EU population lived in a predominantly urban region, 35.3 % in an intermediate region and 23.4 % in a predominantly rural region.
The distribution of the EU population by Urban-rural typology was only slightly affected by the update. The population increased by 1.1 % in predominantly urban regions, was almost identical for intermediate regions and decreased by 1.1 % in predominantly rural regions, as shown in Figure 5. Thus, at EU level, the impact was usually less significant in terms of population than in terms of area. However, the distribution of the Estonian and Slovenian populations was strongly affected. In fact, the reclassification of the Estonian region ‘Põhja-Eesti (EE001)’ as predominantly urban explains the 40 % impact on population distribution in Estonia, as shown in Figure 5. For Slovenia, the impact can mainly be explained by the reclassification of the ‘Osrednjeslovenska (SI021)’ region as intermediate instead of predominantly urban.
Impact on the distribution of the gross value added by type of region
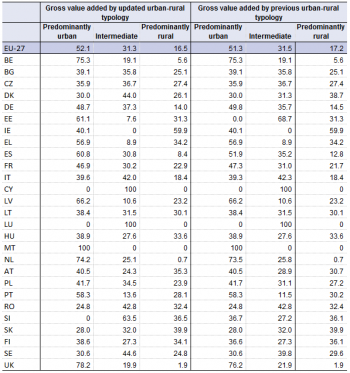
In 2009, the gross value added (GVA) produced in the EU accounted for EUR 10 575 billion, 52.1 % of this GVA being produced in predominantly urban regions, 31.3 % in intermediate regions and 16.5 % in predominantly rural regions under the updated Urban-rural typology.
Under the previous typology, 51.3% of the GVA was generated in predominantly urban regions, 31.5% in intermediate and 17.2% in predominantly rural regions, as it shown in Table 6. The impact of the update on the distribution of GVA followed roughly the same pattern as for the population, but with some differences. Thus, the impacts were more pronounced in Estonia and Slovenia, as shown in Figure 6. Around 60 % of the GVA produced in Estonia switched from intermediate to predominantly urban regions. Moreover, despite the increasing number of intermediate regions in the EU, the GVA produced by intermediate regions decreased only slightly. In fact, the GVA produced in newly classified intermediate regions was less than the GVA produced in the previous intermediate regions reclassified under another type.
Methodology
Urban-rural typology
The Urban-rural typology is based on a classification of grid cells of 1 km² as either urban or rural. To be considered as urban, grid cells should fulfil two conditions: a population density of at least 300 inhabitants per km² and a minimum population of 5 000 inhabitants in contiguous cells above the density threshold. The other cells are considered as rural. NUTS-3 regions are classified into three groups based on the classification of these grid cells:
- Predominantly urban regions/urban regions: the rural population is less than 20 % of the total population.
- Intermediate regions: the rural population is between 20 % and 50 % of the total population.
- Predominantly rural regions/rural regions: the rural population is 50 % or more of the total population. In a last step, the size of the cities in the region is considered.
- A region classified as predominantly rural by the above criteria becomes intermediate if it contains a city of more than 200 000 inhabitants representing at least 25 % of the regional population.
- A region classified as intermediate by the above criteria becomes predominantly urban if it contains a city of more than 500 000 inhabitants representing at least 25 % of the regional population.
Contiguous cells and filling gaps in the cluster typology
To determine population size, the grid cells need to be grouped in clusters. The methods presented here use three different rules for contiguity to create clusters. These three rules are explained below. 1. Contiguous including diagonals — used for urban clusters. If the central square (grid cell) is above the density threshold, it will be grouped with each of the other surrounding eight grid cells that exceed the density threshold. 2. Contiguous excluding diagonals — used for high-density clusters. If the central square is above the density threshold, it will be grouped with each of the four cells directly above, below or next to the central square that also exceed the density threshold. This means that cells numbered 2, 4, 5 and 7 can be included in the same cluster. Cells with numbers 1, 3, 6 and 8 cannot as they have only a diagonal connection. 3. The majority rule or gap-filling — used for high-density clusters. The goal with high-density clusters is to identify urban centres without any gaps. Therefore, enclaves need to be filled. If the central square is not, in its own right, part of a high-density cluster, it will be added to a high-density cluster if five or more of the eight surrounding cells (therefore including diagonals) belong to a single high-density cluster. This rule is applied iteratively until no more cells can be added.
Population grid
Statistical grid data are statistics geographically referenced to a system of (usually squared) grid cells in a grid net with Cartesian coordinates. One of the first results of the GEOSTAT project is a prototype European population grid dataset for the reference year 2006 at 1 km² resolution. The GEOSTAT 2006 dataset contains the total population of the four EFTA countries and all EU countries, with the exception of Cyprus, for which no LAU2 population data were available for the reference year 2006. 12 European countries provided national statistical grid data derived from point data sources, in most cases georeferenced population and address registers. The remaining 18 grid datasets were produced using a spatial model.
Population on 1 January should be based on the concept of usual resident population, and is the number of inhabitants of a given area on 1 January of the year in question (or, in some cases, on 31 December of the previous year). The population figures can be based on data from the most recent census adjusted by the components of population change produced since the last census, or based on population registers
Total area represents the total area of the region including inland waters; it is expressed in km2.
Gross value added (GVA)
GVA is the net result of output valued at basic prices less intermediate consumption valued at purchasers’ prices. Output (ESA95, 3.14) consists of products created during the accounting period. Intermediate consumption (ESA95, 3.69) consists of the value of the goods and services consumed as inputs by production processes, excluding fixed assets, whose consumption is recorded as consumption of fixed capital. The goods and services may be either transformed or used up by the production process. GVA is also available broken down by industries according to NACE Rev. 2 in the breakdowns collection. GVA is calculated before consumption of fixed capital.
See also
- Population grids (background article)
- Regional typologies overview (background article)
- Statistics on European cities
- Urban-rural typology (background article)
Further Eurostat information
Publications
- Eurostat regional yearbook 2013
- Eurostat regional yearbook 2012, chapter 14
- Eurostat regional yearbook 2011
- Eurostat regional yearbook 2010, chapter 15
Database
Dedicated section
- City statistics - Urban Audit
Source data for tables, figures and maps (MS Excel)
External links
- European Commission - Joint Research Centre
- European Environment Agency - Population density disaggregated with Corine land cover 2000
- European Forum for GeoStatistics
- OECD REGIONAL TYPOLOGY (pdf file, 1.93 Mb)
