Archive:Sustainable development - demographic changes
This Statistics Explained article is outdated and has been archived - for recent articles on sustainable development indicators see here.
- Data from July 2015. Most recent data: Further Eurostat information, Database.
This article provides an overview of statistical data on sustainable development in the area of demographic changes. It is based on the set of sustainable development indicators the European Union (EU) agreed upon for monitoring its sustainable development strategy. This article is part of a set of statistical articles for monitoring sustainable development, which are based on the Eurostat publication 'Sustainable development in the European Union - 2015 monitoring report of the EU sustainable development strategy'. The report is published every two years and provides an overview of progress towards the goals and objectives set in the EU sustainable development strategy.
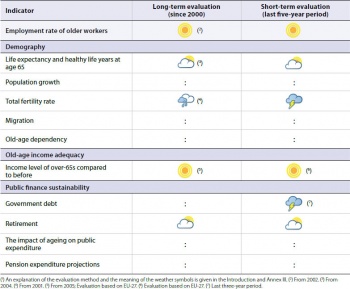
Table 1 summarises the state of affairs in the area of demographic change. Quantitative rules, applied consistently across indicators and visualised through weather symbols, provide a relative assessment of whether Europe is moving in the right direction and at a sufficient pace, given the objectives and targets defined in the strategy.
Overview of the main changes
The employment rate of older people has increased in both in the long term since 2002 and in the short term since 2009. The positive trend has been consistent for both men and women over the entire time period. Because the employment rate for older women has grown faster than for older men, the gap between men and women has narrowed slightly. Trends for other indicators in the ‘demography’ sub-theme have varied. Life expectancy at age 65 showed only moderate improvements in both the long and short terms. The fertility rate developed less favourably. Population growth varied strongly in the long run and short run. Net migration generally increased but dipped substantially after the onset of the economic crisis. Old-age dependency has increased in the long term, with even stronger growth in the short term. In contrast, the ‘old-age income adequacy’ showed continuous progress. Trends in the sub-theme ‘public finance sustainability’ have been mixed. Government debt rose substantially, while the duration of working-life has slightly but steadily progressed in both the long and short terms. From 2000 to 2008 the impact of ageing on public expenditure remained steady.
Key trends in demographic changes
Half of older workers have jobs and the gender employment gap for this group is closing
On average, 51.8 % of older workers in the EU were employed in 2014. Since 2002 the employment rate of older people aged 55 to 64 has slightly but continuously increased. As a result, the original 50 % target set in the Lisbon strategy — the predecessor to Europe 2020 — to be met by 2010 was achieved finally in 2013. Overall the employment rates of older women and older workers in total have resisted the effects of the economic slowdown, as shown by their steady upward trends. In 2014 the employment rate of older women remained roughly 13.7 percentage points lower than that of older men, with 45.2 % of older women in employment compared with 58.9 % of older men. However, a narrowing of the gender gap for this indicator can be observed. While the employment rate of older men has increased by 10.7 percentage points since 2002 and 4.3 percentage points since 2009, the increase was clearly higher for women, rising by 16.1 percentage points since 2002 and 7.5 percentage points since 2009.
Trends of population structure confirm demographic challenges
Life expectancy at age 65 in the EU was 21.1 years for women and 17.7 years for men in 2012. Since 2002 the expected years to live have increased continuously for both sexes and the gap between men and women has declined. However, from 2011 to 2012 life expectancy has fallen slightly for both women (by 0.9 %) and men (by 0.6 %). Despite the overall improvements, the years to live without any activity limitation have not followed the same positive trend. In 2012, both women and men aged 65 were expected to life on average 8.5 years in a healthy condition. In 2013, the total EU population grew by 3.4 per 1 000 persons. The crude rate of population change has been volatile over time. An increase after 2002 was followed by a temporary dip in the short term, after 2008, caused by a slowdown in both net migration plus adjustment and natural population growth. Furthermore, a considerable divergence in this indicator is visible across Member States. In 2013, the EU total fertility rate was at 1.55 children per woman, far below the replacement level of 2.1 children per woman. The indicator has increased by 6.2 % since 2001 (1.46 children per woman), but has fallen 3.7 % since 2008 (1.61). After a period of stabilisation at 1.6 children per woman until 2011, the indicator has since slightly decreased further. In contrast to the fertility rate, the crude rate of net migration plus adjustment in the EU seems to be recovering after a dip following the economic crisis. In 2013 it was 3.2 per 1 000 persons, similar to the crude rate of 2002. The EU old-age-dependency ratio, that is the ratio between the elderly population aged 65 and over and the population of working persons aged 15 to 64 years, increased continuously between 2001 and 2014 to 28.1 %. Europop2013 population projections [1] point towards further increases, up to 50 % in 2055.
Income levels of pensioners have improved continuously
In 2013 the average income level of pensioners in the EU was 55 % of the earnings of the working population aged 50 to 59. The aggregate replacement ratio has followed a moderate upward trend both in the long term, since 2005, and the short term, since 2008. Across Member States the ratio of income levels from pensions of elderly people relative to the income level from earnings of those aged 50 to 59 ranged from 37 % in Ireland to 79 % in Luxembourg.
Government debt levels are rising and drifting apart across Member States
Government debt in the EU increased substantially between 2011 and 2014, from 80.9 % to 86.8 %. A recovery from the onset of the economic crisis has yet to be seen. Government debt levels varied significantly across the EU in 2014, ranging from 10.6 % of gross domestic product (GDP) in Estonia to 177.1 % in Greece. Compared with 2009, the range between the lowest and the highest general government gross debt level of Member States has slightly increased. Many Member States reformed their pension systems to extend their population’s duration of working life and subsequently reduce the costs for pension payments by the state. Between 2000 and 2013 the duration of working life in the EU increased by 2.2 years. In 2013, men worked on average 37.7 years and women 32.5 years during the course of their life. The social protection expenditure on care for the elderly in the EU-27 has increased from 0.37 % of GDP in 2000 to 0.50 % in 2008 and further to 0.56 % in 2012. Pension expenditure in the EU is projected to remain stable at around 11 % of GDP, from 11.3 % in 2013 to 11.2 % in 2060.
Main statistical findings
Headline indicator
Employment rate of older workers
The proportion of 55 to 64 year olds in employment in the EU has increased by 13.4 percentage points over the long term since 2002 and by 5.9 percentage points in the short term since 2009. Employment rates of older women have caught up slightly with that of older men.
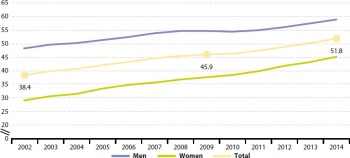
In 2014, 51.8 % of people aged 55 to 64 in the EU were in employment. This is a 13.4 percentage point increase compared with the 2002 level of 38.4 %. The positive trend has been consistent over the entire period observed for both men and women. The employment rate for older women increased substantially between 2002 and 2014, from 29.1 % to 45.2 %. In contrast, the increase for older men was smaller from 48.2 % to 58.9 % over the same period. The stronger performance of older women helped to close the gender gap in this indicator slightly. Despite substantial improvement in the employ¬ment rates of workers aged 55 to 64 in many countries over the last decade, there is still enormous potential for further growth (European Commission, 2012, p.57). Until 2011, the employment rate of older workers has been evaluated against the target set out in the Lisbon strategy and the EU SDS, to ‘increase the average EU employment rate among older women and men (55 to 64) to 50 % by 2010’. Since the target has expired, and in the absence of a new target specifically for older workers in the Europe 2020 strategy or in a revised EU SDS, the evaluation is only based on the trend over time in the 2013 and 2015 editions of the ‘Sustainable development in the European Union’ monitoring reports. Despite increasing significantly in 2014, the employment rate of older workers is still well below the rates of other age groups. While 51.8 % of older people (aged 55 to 64) were employed in 2014, the employment rate of prime-aged workers (aged 25 to 54) was significantly higher at 77.5 %. However, as the employment rate of prime-aged workers has stagnated since 2002 and even slightly decreased since 2008, the rates of older employees and prime-aged workers have converged. Increasing the employment rates of older workers has become a focus of policy actions because it is considered a promising answer to the demographic challenge of structural longevity (European Commission, 2012, p.57). A longer work¬ing life can both support the sustainability and adequacy of pensions, as well as bring growth and general welfare gains to an economy (European Commission, 2012, p.57).
- Employment rates of older workers have grown throughout the economic crisis, although at a slower pace
The economic crisis has generally not affected the proportion of older people in employment in the EU. However, the rise in the share of older workers in employment slowed temporarily during the post-crisis period. While the year-on-year increase was one percentage point or more between 2005 and 2008, it fell to 0.4 percentage points from 2009 until 2010. From 2011 onwards, the employment rate of older workers increased by more than one percentage point again, up to a rise of 1.7 percentage points in 2014. The stagnation between 2009 and 2011 was mainly caused by lower growth in the employment rate of older men. In contrast, the employment rate of older women increased steadily over the same period. Employment rates of older workers were less affected by the crisis than the rates of prime-aged and younger workers. This may be because older workers are more experienced and better integrated into the labour market. They are also more often employed on open-ended contracts. This has led to an increase in the average ages of workers in employment. However, there is a risk that this positive trend could weaken in the future. Because older workers often tend to work in the public administration, health and education sectors, they might be more likely to lose their jobs due to future public spending cuts (Eurofound, 2012, p.1). This seems already to be the case in Greece where the employment rate of older workers since 2012 has been below the 2000 level.
- How the employment rate of older workers varies across Member States

Employment rates of older workers have slightly converged across Member States since 2002. In 2014 employment rates ranged from 34.0 % in Greece to 74.0 % in Sweden. The spread has fallen by 5.2 percentage points compared with 2002, when country rates ranged between 22.8 % (Slovakia) and 68.0 % (Sweden). In 2014, the employment rate of older workers was 50 % or higher in 12 countries. The other 16 Member States had less than half of their older workers in employment and were still to reach the EU SDS target of 2010. In most Member States the employment rate of older workers increased in line with the general increase in the EU. Countries recording the largest increases over the long term since 2002 include Germany, Bulgaria, Slovakia and the Netherlands. In contrast, rates fell in Greece, Portugal and Cyprus over the same time period. In terms of short-term developments since 2009, the strongest growth in employment rates of older people has been observed in Italy, Poland, Hungary, Germany, Malta and France. In contrast, employment rates of older people fell in Cyprus, Greece, Croatia, Portugal and Slovenia. These short-term reductions are in line with falls in the employment rate of the total workforce aged 20 to 65, but are less pronounced. The discrepancies between countries are caused by several factors such as different employment sectors, retirement ages and policy initiatives (Hartlapp and Schmid, 2012, p.8). Sectorial distribution influences the employment rates by providing more or fewer opportunities to find a job or to remain employed. Older workers are mainly employed in manufacturing (14 %), human health and social work activities (11 %), education (9 %) and public administration (9 %). They tend in particular to be overrepresented in farming and the public sector (education, health and public administration) compared with young and prime-aged groups (Eurofound, 2012, p.5). The service sector, which employs more than 30 % of older workers, is of particular interest when it comes to efforts to improve the employment prospects of this age group (Hartlapp and Schmid, 2012, p.10). Differences in incentives to work longer, retirement ages, opportunities for early and partial retirement and retention of older workers also have an impact on employment rates. Furthermore, many Member States have focused on continuous skills development (employability) and provided incentives to employees and employers to ensure lifelong learning (Eurofound, 2012, pp.8).
- EU trends in employment rate of older workers compared to other countries in the world
Compared with other countries, the average employment rate of older workers in the EU is considerably lower than in the United States and Japan. In 2013 the employment rate of older workers in the EU was 51.8 %, compared with 60.9 % in the United States and 66.8 % in Japan. Among EU Member States, six countries (Germany, Estonia, Denmark, the United Kingdom, the Netherlands and Finland) had similar employment rates of older workers to the US and Japan. Norway and Switzerland had higher rates at 72.2 % and 71.6 % respectively, which were comparable to Sweden’s rate of 74.0 %. Iceland had the highest employment rate of older people in the countries observed, at 83.6 %.
Demography
Life expectancy and healthy life years at age 65
Life expectancy at age 65 increased by 6.0 % for women and 8.6 % for men in the long term between 2004 and 2012. Short-term developments since 2007 have been overall positive, although a recent change in the trend indicates a step back. Improvements are further compromised by a stagnation in the number of years to be lived in healthy condition.
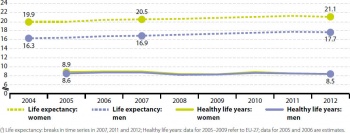
The expected number of years left to live at the age of 65 increased for men and women in the long-term period between 2004 and 2012 as well as in the short term between 2007 and 2012. For women life expectancy at age 65 increased only slightly over the entire period observed, from 19.9 to 21.1 years. Life expectancy for men started from a lower level of 16.3 years and reached 17.7 in 2012. Following an overall increase between 2005 and 2011, life expectancy fell again from 2011 to 2012 by 0.9 % for women and by 0.6 % for men. The gap between men and women’s life expectancy remained around 3.4 to 3.6 years over the entire period.
- Healthy life years at age 65 did not increase in line with longer life expectancy
In spite of the slight increase in life expectancy, the years of life without any activity limitation have not improved. In 2012, both women and men aged 65 were expected to live another 8.5 years on average in healthy condition. The statistics show that 65 year old men and women would have to live the majority of their remaining lives with activity limitations. The trends are more unfavourable for women. For them improvements in overall life expectancy have not led to a higher number of healthy life years, but to a higher proportion of remaining life lived with activity limitation or disability. In 2012, women at the age of 65 could expect to live another 21.1 years on average, with only 8.5 of them in good health.
- How life expectancy at age 65 vary across Member States
The gap between the Member States with the lowest and the highest life expectancy at age 65 stayed more or less the same for both sexes in the long-term period since 2004 and over the shorter term since 2007. In 2013 the difference between countries was slightly lower for men (5.4 years) than for women (5.7 years). Over the entire time period the average life expectancy stayed lowest in Bulgaria, Romania, Hungary, Slovakia, Latvia, Croatia, Lithuania and Czech Republic. In 2013, the expected number of years left to live for women at age 65 ranged from 17.9 years in Bulgaria to 23.6 years in France. For men the lowest level was in Latvia with 13.9 years to live and the highest in France with 19.3 years. Some of these observed differences might be due to preventable mortality (for example, lifestyle factors or accidents) or treatable mortality (deaths caused by certain conditions for which effective medical treatments are available) (Commission of the European Communities, 2007, p.43). People with lower socio-economic status or lower education level tend to have a lower life expectancy. To a large extent this can be explained by structural factors such as a more stressful lives and unhealthier lifestyles (Commission of the European Communities, 2007, p.43).

In 2012, the average life expectancy of EU citizens aged 65 was below levels observed for women and men in Liechtenstein, Switzerland, Iceland and Norway in 2013. Life expectancies in these countries were similar to the ones observed in the highest ranked Member States: France, Spain, Italy and Finland. In Turkey, the life expectancies of women and men aged 65 were 19.8 and 16.3 years respectively in 2013, slightly below the 2012 EU average. In contrast, life expectancies in the Balkan countries Montenegro, FYR Macedonia and Serbia were comparable to the life expectancies in the lowest ranked EU Member States.
- Longer life expectancy and public spending
The ageing EU population and longer life expectancies may in general lead to higher public spending on older people. However, elderly people are not just recipients of pensions or health and long-term care; rather the public health-care costs for older people depend on their health status. Because elderly people are often the ones who provide care for other elderly people, improvements in their health status may mean they are able to provide more care to others (for example, to a spouse or a parent). Furthermore, elderly people often engage in volunteer work or help look after grandchildren, thus providing important services to society that would otherwise have to be purchased in the marketplace (Rechel, Doyle, Grundy and McKe, 2009, p.15).
Population growth
Since 2002 the EU population has been continuingly growing, with crude rates of population change varying between 4.2 and 2.2 per 1 000 persons. Strong population growth between 2002 and 2007 was followed by a temporary dip in the period up to 2013, caused by a slowdown of net migration and natural growth.
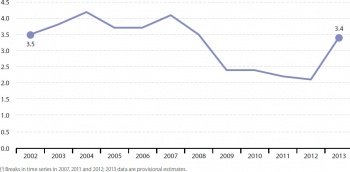
In 2013 the EU population increased by 3.4 people per 1 000 persons. In the long term, from 2002 to 2013, the crude rate of population change remained positive, indicating continuous population growth. However, the crude rate of population change has been volatile over time: an increase in the rate between 2002 and 2007 was followed by a temporary dip after 2008. This dip in the short-term was caused by a slowdown of both net migration [2] and natural growth, possibly driven by the harsher economic conditions. As a result, in 2013, the crude rate of population change was close to the levels of 2002 and 2008 (3.5 per 1 000 persons in both years).
Population growth in the EU is mainly driven by positive net migration (indicating that immigration is exceeding emigration), but also, for some countries, by positive natural change (live births exceeding deaths). In 2013, the crude rate of net migration was 3.3 per 1 000 persons and the crude rate of natural change 0.2 per 1 000 persons. From 2002 to 2013, net migration contributed more to population growth than natural growth as a result of two factors. First, net migration has increased since the mid-1980s. Second, the number of live births has fallen, while deaths have increased.
- EU population grows in absolute terms
In absolute terms, the total population of the EU grew between 2001 and 2014, from 488.2 million people to 506.8 million. In the short term since 2008 the EU population has continued to grow, but at a slower pace.
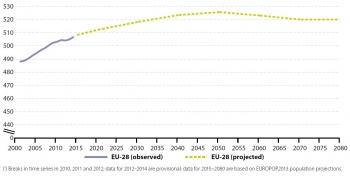
- EU population is projected to peak at 525.5 million people around 2050
From 2015 to 2080 the number of people in the EU is likely to increase by 2.3 % from 508.2 million people to 520.0 million, according to Europop2013 population projections that were built on a set of assumptions for the future developments of fertility, mortality and net migration. Around the year 2050 the population is projected to reach 525.5 million people, which is 3.7 % more than in 2014. At the same time, demographic ageing is accelerating. The share of people aged 65 and over in the total population will increase significantly in the coming decades, as a greater proportion of the post-war baby-boomer generation will reach retirement. Under the assumption that fertility will increase but still remain at a relatively low level, negative natural change (more deaths than live births) would be inevitable in the future. Positive net migration is expected to be the only factor contributing to long-term population growth.
- How population growth varies across Member States
From 2002 to 2013 crude rates of population change diverged considerably across Member States, ranging from – 9.0 to 19.1 per 1 000 persons in 2002 and from – 11.1 to 23.3 per 1 000 persons in 2013. In 2013, the population of 15 Member States increased. Population growth in terms of crude rates was strongest in Luxembourg (23.3 per 1 000 persons) and Italy (18.2), followed by Malta (9.5) and Sweden (9.3). High population growth was mainly caused by migration flows into these countries, indicated by the highest crude rates of migration among Member States in 2013. To a minor extent also natural change contributed to population growth in Luxembourg (crude rate of natural change of 4.2 per 1 000 persons), Sweden (2.4 per 1 000 persons) and Malta (1.9 per 1 000 persons). Italy experienced negative natural change (crude rate of – 1.4 per 1 000 persons). In contrast, 13 Member States, mostly in southern and eastern Europe (Bulgaria, Cyprus, Czech Republic, Estonia, Greece, Spain, Croatia, Hungary, Lithuania, Latvia, Poland, Portugal and Romania) experienced shrinking populations in 2013. In six of these countries (Cyprus, Greece, Poland and Portugal and Czech Republic and Croatia), the crude rate of population change initially followed a positive trend between 2002 and 2008 but then turned negative in the years following the economic crisis. This was largely caused by the outward migration of citizens from these countries towards other Member States and by declining fertility rates in the countries hit hardest by the economic crisis (Eurostat, 2013). Also in Ireland, which in 2007 had the highest crude rate of population change among Member States (26.7 per 1 000 persons), the rate decreased to a much lower level (3.1 per 1 000 persons) in 2013. This was caused by emigration far exceeding immigration, which is indicated by the negative crude rate of net migration since 2009 (European Commission and Eurostat, 2011, p.91). In 2013, EU average population growth in terms of crude rates was below the population growth in Switzerland (12.8 per 1 000 persons), Iceland (11.4), Norway (11.2) and Liechtenstein (7.9). Higher population growth in these countries was caused by comparably higher net migration as well as higher rates of natural increase. In Turkey, strong population growth (13.7 per 1 000 persons) was caused primarily by a very high natural increase (crude rate of 12.0 per 1 000 persons).
Total fertility rate
The total fertility rate in the EU has increased by 6.2 % in the long term since 2001 but decreased by 3.7 % in the short run since 2008. In 2013, there were 1.55 children for every woman.
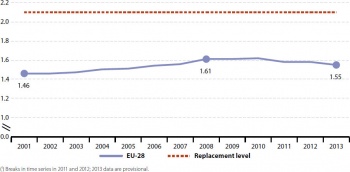
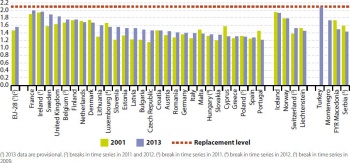
From 2001 to 2013 the EU’s total fertility rate rose by 6.2 % from an average of 1.46 children per woman to 1.55 children per woman. After stabilisation of the total fertility rate at around 1.6 children per woman in 2008, the indicator, however, decreased by 3.7 % to 1.55 children per woman in 2013. Uncertainty over future prospects due to the economic crisis may have had an influence on individual decisions to have children. The peak of the crisis (in terms of geographic reach) in 2009 was accompanied by a stagnation of total fertility rates in several countries, followed by a distinct fall. Some of the biggest declines occurred in countries hardest hit by the economic crisis. The crisis may have affected the total fertility rate in various ways. In some countries, the recession caused migrants, some of whom had high fertility rates, to return home. Certain factors, such as education level, immigration status and employment status, determine the extent to which the crisis impacts different population groups (Eurostat, 2013).
- How total fertility rates vary between Member States
In 2013, the highest fertility rates in the EU were reported in France (1.99 children per woman), Ireland (1.96), Sweden (1.89), the United Kingdom (1.83), Belgium (1.75) and Finland (1.75). In these countries the rates were close to but still below the replacement level of 2.1 children per woman. In 2013, 18 Member States had fertility rates below the EU average of 1.55 children per woman. The lowest rates were reported in Portugal (1.21), Spain (1.27), Poland (1.29), Greece (1.3), Cyprus (1.3), Slovakia (1.34) and Hungary (1.35).
- More children due to changing family models, wealth effects and childcare provision?
Family structures are changing, influenced by fewer marriages, more divorces and an increasing share of children born outside marriage. From 2001 to 2012 live births outside marriage in the EU increased from 28.5 % of total live births to 40.0 % [3]. The possibility of a flexible and less traditional family life seems to have a positive impact on individual child-bearing decisions. Countries with high rates of extramarital births even tend to have higher fertility rates than others. For example, in Belgium, Bulgaria, Denmark, Estonia, France, Slovenia and Sweden more than 50 % of children were born to unmarried women in 2012. All of these countries had total fertility rates above the EU average of 1.55 children per woman, except Estonia (1.52) and Bulgaria (1.48). Furthermore in the EU — and generally among developed countries — fertility tends to rise with wealth. The traditional stereotype of poorer families having several children seems to have given way to a resumption of pre-industrial revolution patterns whereby better-off families tend to have more children. Nevertheless, at the other end of the income range, there is a persistent association between poverty and number of children. Last but not least, child-care provision has been identified as a very important determinant of fertility levels across the EU (European Commission and Eurostat, 2011, p.69). In general, Member States that were implementers of policies to promote gender equality and participation of women in employment display higher fertility rates.
Migration
Net migration plus adjustment has been fluctuating over time. The rate increased by 52 % in the long-term period between 2000 and 2013. Due to changes in labour migration patterns, the migration rate fell to 1.4 following the onset of the economic crisis in 2008, but it rose again steeply in 2013.


In 2013 the crude rate of net migration plus adjustment was 3.2 per 1 000 persons, indicating that EU population increased due to higher immigration than emigration [4]. In the long term, net migration increased by 52 %, from 2.1 per 1 000 persons in 2000 to 3.2 per 1 000 persons in 2013. In the short term, from 2008 to 2013, the rate increased by 33 %. In the period between 1990 and 2001 net migration in the EU followed a volatile trend, with rates ranging between 0.7 and 1.4 per 1 000 persons. It then increased steeply to 3.6 per 1 000 persons in 2003, before falling back between 2004 and 2009. The drop was especially steep between 2008 and 2009, which could be attributed to the economic crisis. Immigration levels have slowed while emigration has increased in some EU countries. This seems to be the case particularly in countries that had large inflows of labour migrants in the pre-crisis period (International Organisation for Migration, 2010, p.4). Whether the increase of net migration in 2013 is a turnaround or just a temporary rise cannot yet be determined. Migration is influenced by a combination of economic, political and social factors: either in the migrant’s country of origin (push factors) or in the country of destination (pull factors). In the EU, both intra EU and external migration flows have occurred. There is some evidence that migrants from other EU countries left in larger numbers than non-EU foreigners during the economic downturn. The differing migration response among EU and non-EU foreigners may be partly due to the fact that EU migrants face fewer barriers to re-enter the European labour market compared with non-EU migrants (International Organisation for Migration, 2010, pp.3).
- How migration varies across Member States
In 2013, 15 Member States reported positive net migration. Relative to the size of the population, the highest levels were reported in Italy (19.7 per 1 000 persons) and Luxembourg (19.0), followed by Malta (7.6), Sweden (6.9) and Austria (6.5). In contrast, in 13 Member States emigrants have outnumbered immigrants. In 2013, lowest crude rates of net migration were reported in Cyprus (– 14 per 1 000 persons), Latvia (– 7.1), Greece (– 6.4), Lithuania (– 5.7), Ireland (– 5.5) and Spain (– 5.4). In six countries (Cyprus, Czech Republic, Croatia, Ireland, Portugal and Spain) net migration rates have changed from positive to negative in the years following the economic crisis (since 2008). Compared with other countries, the EU average crude rate of net migration is below the rate in Switzerland (10.2 per 1 000 persons), Norway (7.7), Liechtenstein (5.4) and Iceland (5.1) in 2013. However, it is higher than in Turkey (1.7). The Balkan countries Serbia (0.0), FYR Macedonia (– 0.2), Montenegro (– 1.5) and Albania (– 6.3) experienced zero to negative net migration in 2013.
- How does migration contribute to demographic change?
Migration affects demographic changes in various ways. In several Member States, immigration has already been beneficial in postponing population decline. First, the participation of migrants in the labour force is important for fuelling the labour market. It is especially valuable for solving specific labour market shortages in destination countries. Second, migration counteracts the ageing of societies. Migrants coming to the EU in 2012 were, on average, much younger than the population already resident in the destination countries [5]. Migrants are also often found to have higher fertility rates than the local population and therefore may boost natural population growth (Commission of the European Union, 2007, p.177). However, migration alone will almost certainly not reverse the ongoing trend of population ageing experienced in many parts of the EU [6].
Old-age dependency
From 2001 to 2014 the old-age dependency ratio in the EU increased by 4.6 percentage points to 28.1 %. Since 2009 the increase has accelerated. Population projections point towards even stronger dependency of older people on persons of working age, as the ratio is expected to increase up to 50 % in 2060.
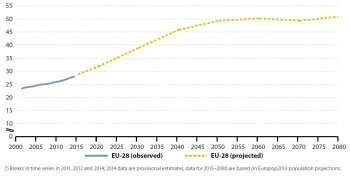
The ratio of elderly people (aged 65 and over), who are generally economically inactive, to the working age population (aged 15 to 64) in the EU was at 28.1 % in 2014. In the long run, between 2001 and 2014, the old-age-dependency ratio increased steadily from 23.5 % to 28.1 %, on average by 0.35 percentage points per year. This means that while there were 4.3 people of working age for every dependent person over 65 in the EU in 2001, this number has fallen to 3.6 people in 2014. In the short term the ratio has increased on average by 0.46 percentage points per year since 2009. The strongest increases have occurred since 2011, on average by 0.6 percentage points per year. The trend towards a growing share of older people (aged 65 and over) in the population and a shrinking working-age population (aged 15 to 64 years) has been observed for a long time. Population ageing is a major driver of the expected increase in pension expenditure in the EU.
- Projected old-age dependency ratio
Europop2013 population projections indicate that from 2014 to 2080 the EU’s old-age dependency ratio will continue to increase at an accelerating pace, reaching 51.0 % in 2080. The old-age dependency ratio is projected to peak at 50 % around 2060 and to remain close to this level until 2080. The projected increase of the old-age dependency ratio is caused by a continuous rise in the share of elderly people in the total population in the coming decades, as a greater proportion of the post-war baby-boomer generation reaches retirement. The number of people aged 65 and over in the EU is projected to rise by 58.4 %, from 94.1 million in 2014 to 149.1 million in 2080. The number of oldest-old people (aged 80 and over) is projected to increase by even more, to more than double, from 26.1 million in 2014 to 63.9 million in 2080, that represents an increase of 7.1 percentage points in the share of total population. This, in turn, is expected to increase the burden on the working age population to provide for social expenditure to support the ageing population. Several Member States have undertaken reforms in recent years to limit the increasing effect of an ageing society on public pension expenditure. In many cases, these reforms involved abolishing or restricting early retirement schemes, increasing statutory retirement ages or providing incentives to stay in the labour market beyond the legal retirement age on a voluntary basis (European Commission, 2015, p.88). Reforms of Member States pension systems are promoted in the National Reform Programmes in response to the recommendations of the European Council [7].
Old-age income adequacy
Income level of over-65s compared to before
The average income of people aged 65 and over in the EU-27 relative to the earnings of people in their 50s has increased by five percentage points in the long-term period since 2005 and by six percentage points in the short term since 2008.
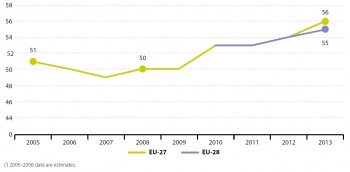
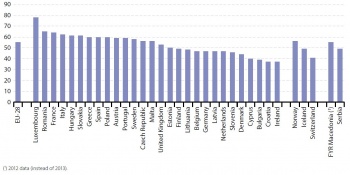
In 2013, pensioners in the EU aged 65 to 74 had on average incomes equal to 55 % of the average earnings of people close to retirement (aged 50 to 59). This is measured by the aggregate replacement ratio. In the EU-27, the ratio increased from 51 % to 56 % between 2005 and 2012. During this period there was only a slight dip to 49 % in 2007. Given the pressure on pension funds due to the effects of demographic ageing and the economic crisis, it is very unlikely that pensions of elderly people would actually increase. The increase in the replacement ratio might rather be a result of decreasing incomes of the working population due to the crisis. Besides addressing poverty, pension systems play a role in allowing retirees to maintain adequate living standards comparable with those achieved during their working lives European Commission, 2010). Over the past decade most Member States have reformed their pension systems to improve their medium and longer term sustainability as a precondition for delivering on adequacy objectives (European Commission and Social Protection Committee, 2012, p.11). However, Member States have to face trade-offs and difficult choices when trying to reconcile and optimise sustainability and adequacy concerns. Achieving the goal of cost-effective and safe delivery of adequate benefits that are sustainable is quite challenging (European Commission and Social Protection Committee, 2012, p.11).
- Older people aged 65 and above are less at risk of poverty
The share of people at risk of poverty among older people aged 65 and above has fallen continuously in the long term and the short term [8]. Compared with other age groups, older people in the EU had lower at-risk-of-poverty rates of 13.8 % (11.4 % for men and 15.6 % for women) in 2013. In contrast, young people aged 18 to 24 have been increasingly affected by the risk of poverty, with an at-risk-of-poverty-rate of 22.6 % in 2013 (21.9 % for men, 23.4 % for women) [9]. Thus, the age gap has widened over the past years.
- How the aggregate replacement ratio varies across Member States
In 2013, the replacement ratio in the 28 Member States ranged from 37 % in Ireland to 78 % in Luxembourg. Compared with the year 2005, when country rates were between 29 % (Cyprus) and 70 % (Austria), disparities across the EU stayed similar, at 41 percentage points. In 2013, Luxembourg had by far the highest aggregate replacement ratio (78 %), followed by Romania (65 %), France (64 %) and Italy (62 %). A total of 14 Member States had relative income levels of the over-65s above the EU average. The lowest rates were reported in Ireland and Croatia (37 % each), Bulgaria (39 %) and Cyprus (40 %). In 2013 the income level of over 65 year olds compared to before in Norway (56 %), Iceland (49 %), Switzerland (41 %), Macedonia (55 %) and Serbia (49 %) were in the same range as in EU Member States. Similar to the EU average (55 %), a tendency of increasing rates has been observed in these countries since 2005.
Public finance sustainability
Government debt
The general government gross debt in the EU has increased sharply from 80.9 % in 2011 to 86.8 % in 2014. There have been no signs of recovery since the onset of the economic crisis.
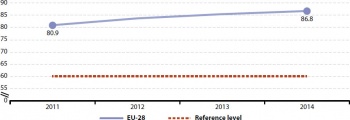
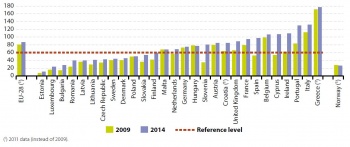
Between 2011 and 2014, general government gross debt in the EU as a share of GDP at current market prices increased by 5.9 percentage points from 80.9 % to 86.8 %. The indicator monitors progress towards the EU reference value for government debt of 60 % of GDP. The current provisions are defined in the 2012 consolidated version of the Treaty on the Functioning of the European Union (Consolidated version of the Treaty on the Functioning of the European Union, 2012). In comparison, between 2000 and 2007 government debt in the EU was close to the reference level of 60 % of GDP, but with the start of the economic crisis the trend detriorated and government debt increased considerably. This rise in the debt-to-GDP ratio is a consequence of several factors: revenue shortfalls due to the decline in economic activity, measures to support the economy, including large-scale interventions in some Member States to support the financial sector, as well as the effect of negative or very low economic growth. Recognising that high levels of government debt are not sustainable in the long-term, the new European Commission put greater emphasis on reviving growth in Europe.
- How government debt varies across Member States
In 2014 general government debt-to-GDP ratios across Member States ranged from 10.6 % in Estonia to 177.1 % in Greece. Since 2009 (respectively since 2011 for Croatia and Greece), government debt-to-GDP ratios increased in all Member States except in Hungary (– 1.3 percentage points). In 16 Member States (Malta, the Netherlands, Germany, Hungary, Slovenia, Austria, Croatia, the United Kingdom, France, Spain, Belgium, Cyprus, Ireland, Portugal, Italy and Greece) debt-to-GDP ratios stood above the 60 % reference value in 2014. The debt crisis has revealed underlying weaknesses in the fiscal situation of Member States. Member states where the debt-to-GDP ratios increased most (by more than 50 percentage points of GDP) between 2007 and 2014 are Ireland, Greece, Spain, Portugal, Slovenia and Cyprus. The variation among the Member States also has strongly increased during the crisis years. The countries that have experienced the greatest deterioration in their public finances since the onset of the crisis had already displayed high and rising macro-financial or fiscal risks in the years before its onset (European Commission, 2010). The current increases are occurring from historically high starting levels as EU countries have experienced a number of large debt increase episodes, which have tended to start from higher levels of debt each time (European Commission, 2014). From 2009 to 2013 Norway lowered its general government gross debt from 27.5 % of GDP to 26.4 %, following an even more substantial decrease in the years before. Compared to the EU average, Norway is better off, with a debt-to-GDP ratio comparable to that of Luxembourg and Bulgaria.
Retirement
Duration of working life in the EU has increased on average by 2.2 years in the long term between 2000 and 2013. This trend was also visible in the short term, with an increase of 0.8 years between 2008 and 2013. Women have been slowly but continuously catching up with men in terms of duration of working life.

In 2013 the number of years a person could be expected to be active in the labour market throughout his or her life was 35.1 years on average, and 37.7 years for men and 32.5 years for women. Between 2000 and 2013 the total duration of working life increased by 2.2 years from 32.9 to 35.1 years. Over the whole period (2000 to 2013), the duration of working life was higher for men than for woman. For women the number of years worked increased from 29.2 years in 2000 to 32.5 years in 2013. Over the same period, the working life for men started from a higher level of 36.4 years and slightly increased to 37.7 years. A slight convergence between the two sexes is visible over time, with the gap narrowing by two years between 2000 and 2013.
- Narrowing the gap in working life of women between Member States
For women, the duration of working life has converged across Member States. Since 2000, the difference between the highest and the lowest number of working years for women has decreased by 7.9 years. In comparison, the differences for men increased by only 0.6 years over the same period. In 2013, the duration of working life of women ranged from 24.9 years in Malta to 43.9 years in Sweden. For men, the lowest level was observed in Hungary with 33 years and the highest in the Netherlands with 42.4 years. In six countries (Croatia, Cyprus, Greece, Ireland, Portugal and Romania) the duration of working life for men decreased between 2000 and 2013. Romania is the only Member State where the expected years to work for women decreased as well (by five years).
The impact of ageing on social protection expenditure
In 2012, social protection expenditure on care for the elderly in the EU-25 was at 0.56 % of GDP, higher than in 2007 (0.50 %) and in 2000 (0.37 %).
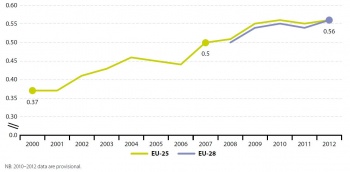
In the EU-28 and the EU-25 the share of social protection expenditure devoted to old-age care [10] in GDP was at 0.56 % in 2012. In the EU-25 the share increased from 0.37 % of GDP in 2000 to 0.50 % in 2007, decreasing just slightly in the intermediate years (2004 to 2006). From 2007 onwards, the share of social protection expenditure devoted to old-age care has kept increasing. The decrease from 2004 to 2006 may be explained by the relatively strong GDP growth rate in a number of Member States, including the Baltic countries, during the economic upturn which lasted until 2007, while spending on care for the elderly remained consistent.
Pension expenditure projections
Pension expenditure in the EU is projected to remain slightly above 11 % of GDP over the next decades. After a projected peak in 2037, expenditure is expected to decrease again.
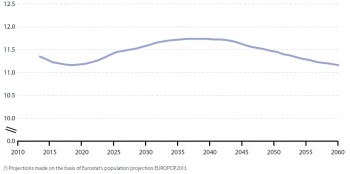
Public pension expenditure at EU level is expected to continue increasing over the next decades and to peak in 2037 at 11.7 % of GDP, before decreasing to 11.2 % of GDP in 2060. Implemented reforms will contribute to counteract the impact on pension expenditure of an ageing population. However, as these reforms are usually phased-in gradually, over several decades, the downward impact will become apparent only late in the projection period. In 2060 Denmark, Estonia, Italy, Latvia, Poland and Portugal will have lower pension expenditure as a share of GDP than in 2015.
Context
Why do we focus on demographic changes?
The EU is facing major demographic changes, including an ageing population, low birth rates, changing family structures and migration. These currently pose challenges for social policy and are likely to become even more important in the future. While the global population is predicted to rise significantly, Europe’s share is shrinking. Nevertheless, the current demographic situation in the EU is characterised by continuous population growth, even if the pace of increase has varied over time. Net migration — the difference between people entering the EU and those leaving — is for now the most important factor for population growth, and might be even more so in future. Economically productive migrants contribute to the economy through labour and taxes. Furthermore, migrant workers may alleviate the negative effects of population ageing and increasingly be needed to maintain the sustainability of pension systems. The EU Sustainable Development Strategy (EU SDS) recognises the contribution of positive net migration to meeting the challenges of demographic changes. However, because migration also occurs between Member States, it may put increasing demographic pressure on those countries where more people have left than have arrived. To a lesser extent, EU population growth is caused by natural increase, defined as the surplus of live births over deaths during a year. It is supported by moderate improvements in the life expectancy of people aged 65, as well as by the total fertility rate that has been increasing over the last decade. Still, the average number of children per woman is far below the ‘replacement level’, which is the fertility level needed to keep the population size constant without inward or outward migration. Because people live longer and births are not enough to replace the elderly population, the EU’s population is growing older. The shrinking proportion of working-age population combined with the rising number of retirees puts pressure on public finances. This is reflected by the old-age dependency ratio, which has been continuously increasing over the last decade and is expected to grow by up to 50 % in 2060. The EU is bound to tackle these challenges by increasing the participation of older workers in the labour market. Substantial progress has already been made in the employment rate of older workers (aged 55 to 64). In order to reach the target of an employment rate of 75 % for the total working-age population, set in the Europe 2020 strategy, the labour market integration of older workers has to be further improved. In this respect, the provision of incentives to work longer, an increase in the retirement age and continuous development of skills and lifelong learning are all becoming more important. Healthy public finances, reflected by general government gross debt, are essential to meet the needs of ageing populations and to promote economic growth while preventing debt from being handed down to future generations. In addition to pensions, which make up a big part of public expenditure, other expenditure might be needed to provide adequate old-age care and social protection. With an ageing population, the EU is facing trade-offs between pensions that are sustainable, on the one hand, and adequate, on the other. Besides addressing poverty, pension systems play a role in allowing retirees to maintain living standards comparable to those achieved during their working lives, thus preventing social exclusion of the elderly [11]. The shift towards longer working lives (later retirement) in the EU is essential to support the sustainability and adequacy of pension systems.
How does the EU tackle demographic changes?
The EU Sustainable Development Strategy (EU SDS) (Council of the European Union, 2006) dedicates one of its seven key challenges to demographic change. The objective is ‘to create a socially inclusive society by taking into account solidarity between and within generations and to secure and increase the quality of life of citizens as a precondition for lasting individual well-being’. The EU SDS has set the following operational objectives and targets:
- Supporting the Member States in their efforts to modernise social protection in view of demographic changes.
- Significantly increasing the labour market participation of women and older workers according to set targets, as well as increasing employment of migrants by 2010.
- Continuing developing an EU migration policy, accompanied by policies to strengthen the integration of migrants and their families, taking into account the economic dimension of migration.
The Europe 2020 strategy, set out by the European Commission in 2010 (European Commission, 2010), does not include demographic change as one of it main topics. However, two EU targets under the inclusive growth priority [12] refer to the issue. They are further specified in two flagship initiatives:
Agenda for new skills and jobs:
- To reach the objective of an employment rate of 75 % for women and men aged 20 to 64 by 2020; labour market integration of underrepresented categories (such as older workers and legal migrants) has to be improved.
- To promote a forward-looking and comprehensive labour migration policy, which would respond in a flexible way to the priorities and needs of labour markets.
European platform against poverty and social exclusion:
- The Europe 2020 strategy has set a target to lift at least 20 million people out of being at risk of poverty or social exclusion by 2020. The income level of pensioners is an indicator of the demographic change theme that is affected by this poverty target.
The 2015 Work Programme of the European Commission has stressed migration as one of ten priorities:
The European Agenda on Migration:
Developing a holistic approach covering both legal migration, to make the EU a more attractive destination for highly skilled people and companies, and improving the management of migration into the EU through greater co-operation with third countries, solidarity among our Member States and fighting human trafficking.
Further reading on demographic changes
- European Commission (2013), EU Employment and Social Situation, Quarterly Review (March 2013), Special Supplement on Demographic Trends, Publications Office of the European Union, Luxembourg.
- Council of Europe (2012), Demographic trends in Europe: turning challenges in to opportunities. Parliamentary Assembly, Doc. 12817.
- European Foundation for the Improvement of Living and Working Conditions (2013), Employment trends and policies for older workers in the recession, EF/12/35/EN.
- Eurostat website: Key to European statistics, Population (Demography, Migration and Projections).
See also
Further Eurostat information
Main tables
- Demographic changes
Dedicated section
Methodology
- More detailed information on demographic changes indicators, such as indicator relevance, definitions, methodological notes, background and potential linkages, can be found on page 141-170 of the publication Sustainable development in the European Union- 2015 monitoring report of the EU Sustainable Development Strategy.
Notes
- ↑ Population projections are what-if scenarios that aim to provide information about the likely future size and structure of the population. Europop2013, the latest Eurostat’s population projection is one of several possible population developments scenarios based on a set of assumptions for fertility, mortality and net migration.
- ↑ Note that ‘crude rate of net migration plus statistical adjustment’ includes statistical inaccuracies, which cannot be attributed to births, deaths, immigration and emigration. For the sake of readibility, ‘net migration’ is used in this section instead of the statistically correct term ‘net migration plus adjustment’. All data nevertheless refer to ‘net migration plus adjustment’.
- ↑ Eurostat (tps00018).
- ↑ Note that ‘crude rate of net migration plus statistical adjustment’ includes statistical inaccuracies, which cannot be attributed to births, deaths, immigration and emigration. For the sake of readibility, 'net migration' is used in this section instead of the statistically correct term 'net migration plus adjustment'. All data nevertheless refer to 'net migration plus adjustment'.
- ↑ Eurostat website: Statistics Explained, Migration and migrant population statistics.
- ↑ Eurostat website: Statistics Explained, Migration and migrant population statistics.
- ↑ European Commission: European Semester 2015
- ↑ Eurostat (ilc_li02), At-risk-of-poverty rate by poverty threshold, age: 65 years and over.
- ↑ Eurostat (ilc_li02), At-risk-of-poverty rate by poverty threshold, age: 65 years and over.
- ↑ More precisely, the indicator is the sum of expenditure for ‘care allowances’, ‘accommodation’ and ‘assistance in carrying out daily tasks’, as defined according to the ESSPROS methodology.
- ↑ The Europe 2020 strategy has set a target to lift at least 20 million people out of the risk of poverty and social exclusion by 2020.
- ↑ European Commission website: Europe 2020 in a nutshell, Targets.
