Archive:Statistics on commuting patterns at regional level
This article has been archived.
Highlights
In 2015, 8 % of the EU workforce commuted to work in a different region.
Cross-border commuting in the EU accounted for 0.9% of the EU workforce in 2015.
(% of total employment)
Source: Eurostat (lfst_r_lfe2ecomm) and (lfst_r_lfe2emp)
Maps can be explored interactively using Eurostat’s Statistical Atlas (see user manual).
This article describes commuting patterns across the European Union (EU): it starts with an analysis of the NUTS level 2 regions with the highest shares of outbound commuters, defined for the purpose of this article as those people who travel — at least once a week — from the region where they have their permanent residence to a different region in order to be at their place of work. The article develops by analysing commuter flows within the same country — with a special focus on London, the EU region with the highest number of commuters — before analysing cross-border commuter flows — with a special focus on Luxembourg, which has the highest proportion of its workforce commuting from neighbouring countries. The article concludes with some information on the socio-demographic characteristics of commuters.
Full article
General overview
In 2015, the total number of persons in employment reached 220.7 million across the whole of the EU-28. The vast majority (91.9 %) of the workforce lived in the same region (defined here at NUTS level 2) as where they worked, a share which includes those people who work from home. The remainder of the workforce (8.1 %) commuted to work in a different region. Outbound commuter flows in the EU-28 can be divided into two separate groups: national commuters accounted for 7.2 % of the total number of persons employed, while less than 1 in 100 people (0.9 % of the EU-28 workforce) commuted across borders.
Developments in commuting patterns
The commute to work has been driven by changes in the organisation of production, as employers experienced increased geographic flexibility, while developing transport and communications infrastructure has made it possible for goods and services to be moved more easily to customers and for employed persons to consider making longer journeys to go to work. The shift towards post-industrial economies and the rapid pace of change for information technologies has greatly reduced coordination costs and led to the potential for greater flexibility and dispersion in the workplace, redefining the relationship between home and work, such that the physical presence of (some) employees is no longer required for them to be able to carry out a day’s work. As a result, it has become more commonplace for people to work (at least some of the time) from home.
The highest rate of commuting in 2015 was recorded in Belgium, where more than one in five (21.9 %) persons commuted to work in a different NUTS level 2 region. Commuting was also relatively common in the United Kingdom, the Netherlands, Austria and Slovakia, where some 10–20 % of the workforce commuted to work in a different region. Unsurprisingly, there were low levels of commuting in many isolated, peripheral and sparsely populated regions, for example, the Greek, Spanish or Portuguese island regions or Cyprus and Malta (both considered as single regions at this level of analysis). There were also low rates of commuting in several of the eastern and Baltic Member States, for example, Bulgaria, Latvia (also a single region at this level of analysis) or Romania.
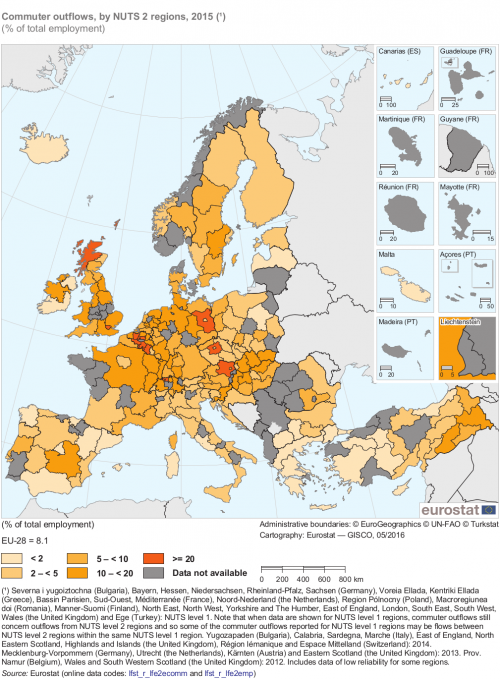
Map 1 presents an analysis of total commuter outflows for NUTS level 2 regions; it shows the share of persons living in one region and commuting to work in another (either in the same EU Member State or across a border). Among the 162 regions for which data are available (see footnote to Map 1 for more information), the highest share of commuter outflows was recorded for the capital city region of the United Kingdom, London, where almost half (48.6 %) of the workforce commuted to work in another region. Note that the data pertaining to London is presented at NUTS level 1, although these statistics were collected for NUTS level 2 regions. Therefore the data for London include commuter flows between the five different NUTS level 2 regions that compose London (two Inner London regions and three Outer London regions) as well as commuter flows from these five regions to regions outside the capital.
The size of regions impacts on their commuting rates
The results on commuting patterns in the EU that are shown in this article reflect a wide range of factors, including: population density, the size of each region, the geographical location of cities or major employers close to regional boundaries, the existence of language barriers, efficient transport infrastructures between regions, the availability of housing, and the availability of work.
The nature of the NUTS classification can play an important role, despite its aim to ensure that comparable regions appear at the same NUTS level of each classification. For example, the physical size (or area) of a region has a clear impact on its (potential) commuting rates: a journey from one end to the other of the central Spanish region of Castilla y León is approximately the same length as travelling from Luxembourg to Amsterdam, which would be a journey that includes nine different regions. It is therefore unlikely that regions with a large area will display high rates of commuting.
The location of a region can also play an important role, for example, it is unlikely that many people living in the Spanish island regions of the Canarias or Illes Balears will commute, as this would involve either a trip by air or a relatively time-consuming sea journey. In a similar vein, mainland regions with lengthy coastlines are also less likely to have high numbers of commuters insofar as the topography of the region reduces the possibilities for commuting (the same pattern may be observed in mountainous regions if they do not have good transport networks). As such, islands, isolated/peripheral regions and sparsely populated regions will tend to record relatively low commuting rates.
The NUTS classification also aims to ensure that regions are of comparable size in terms of population. However, in 2015 the largest NUTS level 2 regions across the EU-28 were the French capital city region of Île-de-France (with just over 12 million inhabitants) and the Italian region of Lombardia (with just over 10 million inhabitants), which may be contrasted with the archipelago of Åland in Finland that had almost 29 thousand inhabitants. The Île-de-France region is characterised by considerable congestion and there are frequent traffic jams on the main road arteries that lead into and out of the French capital, as well as those that encircle it. However, the definition of this region is such that it extends well beyond the city limits of Paris (as defined by the confines of the périphérique ring road) to include its surrounding agglomeration and many suburban/peri-urban developments where a large proportion of the workers travelling on the region’s road and rail networks live. As such, the statistics collected for NUTS level 2 regions consider most of the workers who live close to the French capital as not being commuters.
By contrast, regions with a small area, regions that are densely populated, and regions that border onto others in close proximity of a large agglomeration, are more likely to record high commuting rates. For example, level 2 of the NUTS classification defines the capital city regions of London, Bruxelles/Brussel, Berlin, Praha or Wien as relatively small areas, which results in higher commuting rates for their surrounding regions.
Commuting rates were generally high across Belgium and around several EU capital cities
Having established that London had the highest number of commuters in 2015, the next highest shares of commuter outflows were recorded across several regions in Belgium. Among the 10 Belgian regions for which data are available (note there are no data available for the Province Brabant Wallon where the commuting rate was also likely to be high, given this region is located close to the capital city Région de Bruxelles-Capitale/Brussels Hoofdstedelijk Gewest), the share of commuter outflows in the number of people in the region who were employed was consistently in double figures, peaking at 41.3 % in the Provincie Vlaams-Brabant (a region that surrounds the capital). Besides regions in Belgium and the United Kingdom, the top 10 regions in the EU with the highest shares of outbound commuters were completed by: Niederösterreich (28.1 %), which surrounds the Austrian capital city region of Wien; Brandenburg (24.3 %), which surrounds the German capital city region of Berlin; and Strední Cechy (21.5 %), which surrounds the Czech capital city region of Praha.
By contrast, there were 22 regions in the EU where commuter outflows accounted for less than 2 % of the number of people in a region who were employed (as shown by the lightest shade of orange in Map 1). These were largely concentrated in southern Europe and included: eight Spanish regions (including the capital city region and the island regions of Canarias and the Illes Balears); five Greek regions (including the island regions of Voreio Aigaio, Notio Aigaio and Kriti); two Italian regions (the capital city region and the island of Sardegna (2014 data)); as well as the islands of Cyprus and Malta (both single regions at this level of analysis). Commuter outflows also accounted for less than 1 in 50 of the total available workforce in five additional regions: three capital city regions that were relatively large in size/area — Yugozapaden (Bulgaria), Southern and Eastern (Ireland) and Mazowieckie (Poland); Latvia (a single region at this level of analysis); and Northern Ireland (the United Kingdom).
(% of total employment)
Source: Eurostat (lfst_r_lfe2ecomm) and (lfst_r_lfe2emp)
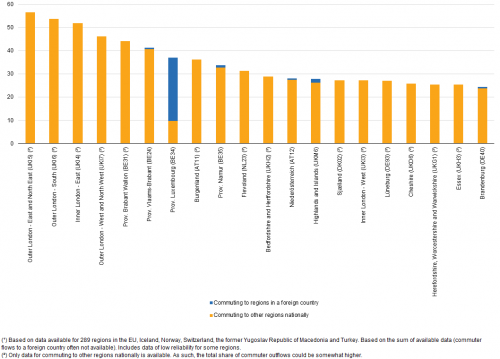
Figure 1 presents a more detailed analysis for the top 20 regions with the highest shares of commuter outflows in the number of persons in a region who were employed; the information is broken down (subject to data availability) to show whether commuters were destined for another region in the same EU Member State or were commuting across a border. Note that the coverage differs from that presented in Map 1 — as the criteria for inclusion in Figure 1 is the sum of available data (even if information pertaining to commuting to a foreign country is not available).
The high share of commuters in and around the United Kingdom capital was confirmed as the four regions with the highest shares of commuting were all in Inner and Outer London, while the fifth London region was in 15th place; note that a high proportion of the commuters that arrive in London each day work in Inner London – West. There were a number of other regions from the United Kingdom that are present in Figure 1, with high commuting rates for the workforces of: Bedfordshire and Hertfordshire, and Essex (from both of which a high number of people commute to London); Cheshire (from which a high number of people commute to Manchester); Herefordshire, Worcestershire and Warwickshire (from which a high number of people commute to the West Midlands).
There was also a relatively high share of commuting in several of the densely-populated Benelux countries. Among the Belgian regions, it is interesting to contrast the high proportion (44.2 %) of commuters in the Province Brabant Wallon who mainly commuted to the capital city region with the high share (27.3 %) of commuters in the Province Luxembourg who mainly commuted across the border to Luxembourg.
The increased data coverage in Figure 1 also highlights two additional regions, namely, the relatively high proportion of commuters in the eastern Danish island region of Sjælland and the Dutch region of Flevoland (which mainly stands on reclaimed land); both of these regions border onto their respective capital city regions — Hovedstaden and Noord-Holland — to which many of their residents commute.
(% of total employment)
Source: Eurostat (lfst_r_lfe2ecomm) and (lfst_r_lfe2emp)
While London dominated commuting patterns in the United Kingdom, there were high numbers of commuters into several of Germany’s largest cities
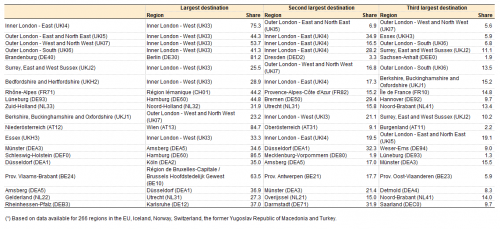
Table 1 develops the analysis by looking at three main commuting destinations for those regions with the highest number of outbound commuters; note this ranking is based on the absolute number of commuters from each of these regions (in contrast to the relative shares of commuters, as presented in Map 1 and Figure 1).
Of the 635 thousand commuters living in Inner London - East, three quarters commuted to work in Inner London - West. More generally, commuting in the United Kingdom displayed a monocentric pattern and was highly concentrated on the capital city; in fact, Inner London - West was the main commuting destination for six of the seven regions in the EU with the highest number of commuters.
As might be expected, the principal destinations for commuters were often some of Europe’s largest urban agglomerations — besides London these included the capital city regions of Germany, the Netherlands, Austria and Belgium. However, while the highest number of commuters in Germany flowed from the surrounding region of Brandenburg into Berlin, commuting patterns over the remainder of the German territory generally had a more polycentric form, as there were also high numbers of commuters flowing into Hamburg, Bremen, Arnsberg (a region which includes the cities of Bochum and Dortmund), Düsseldorf, Köln and Karlsruhe.
The only French region present among the top 20 regions with the highest absolute number of outbound commuters was the south-eastern region of Rhône-Alpes, whose regional capital is Lyon; the principal destination for its commuters was cross-border into the Swiss Région lémanique (which includes the city of Geneva).
National commuting patterns
In 2015, approximately 1 in 14 people in the EU-28’s workforce commuted between different NUTS level 2 regions in the same country. This pattern of national commuting was most developed in Belgium, where almost one in five (19.6 %) of the total workforce crossed a regional boundary to go to work. The United Kingdom also had a high share (18.4 %), while there were four EU Member States — Germany, Denmark, Austria and the Netherlands — where 9.0–12.0 % of the working population commuted nationally. In absolute terms, national commuting was most common in the United Kingdom (5.9 million outbound commuters), Germany (4.3 million), France (1.4 million), the Netherlands (1.3 million) and Belgium (893 thousand); together they accounted for approximately 80 % of all national commuters in the EU.
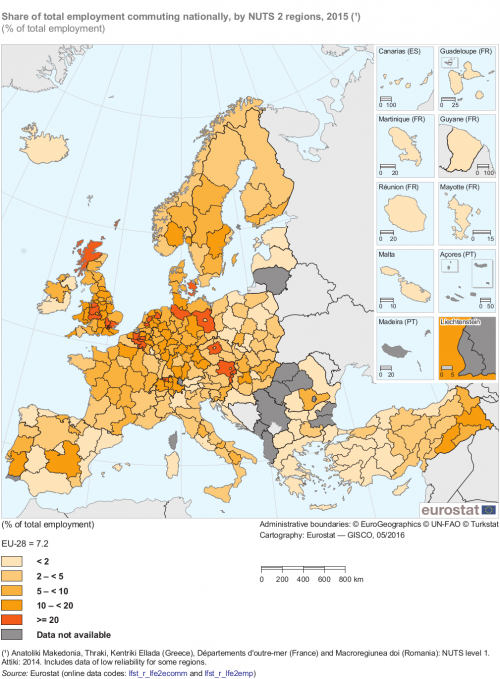
Map 2 shows the highest concentrations of national commuter outflows among 249 NUTS level 2 regions for 2015; given that the vast majority of commuting takes place nationally, it is not surprising that the results presented are quite similar to those shown in Map 1 (which covered all commuting flows, in other words, national and cross-border). The darkest orange shade identifies the 25 regions in the EU-28 where national commuter outflows accounted for at least 20 % of the workforce. National commuting was concentrated in: the United Kingdom (11 regions), Belgium (five regions), the Netherlands (three regions), Germany and Austria (two regions each), as well as single regions from the Czech Republic and Denmark. The map emphasises that commuting patterns are closely linked to population density and the size of regions, while also alluding to a high propensity for commuting around a number of capital city regions.

(% of total employment)
Source: Eurostat (lfst_r_lfe2ecomm) and (lfst_r_lfe2emp)
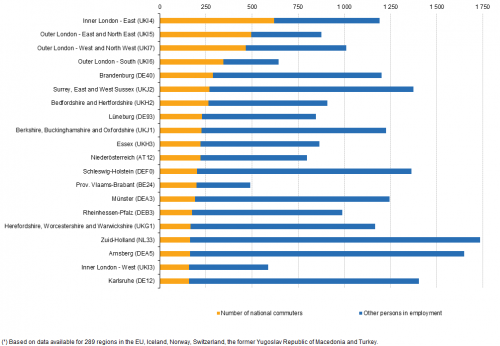
The information presented in Figure 2 is based on absolute numbers of national commuters. In 2015, Inner London - East had the highest number of national outbound commuters, some 619 thousand. It was followed by three Outer London regions, where the number of national outbound commuters was between 346 and 496 thousand; all of the other regions in the top 20 reported less than 300 thousand national commuters. In each of these four London regions, approximately half of the available regional workforce was composed of national outbound commuters — a share that peaked at 56.7 % in Outer London - East and North East. By contrast, the 165 thousand national commuters in the Dutch region of Zuid-Holland and the German region of Arnsberg accounted for no more than 1 in 10 of the workforce available in their regions, where a large majority of the workforce worked in the region where they lived.
(thousands)
Source: Eurostat (lfst_r_lfe2ecomm) and (lfst_r_lfe2emp)
Commuting in and around London
Commuters who work in London are somewhat atypical when compared with other commuters in the United Kingdom. Those commuting into London are more likely to spend longer on their daily commute to/from work, while a higher proportion of commuters in and around London make use of public transport (in particular, train and underground services); in most other parts of the United Kingdom, by far the most popular means of transport for commuting to work was the passenger car.
Commuting patterns into London are closely linked to the rail network, insofar as there is a radial pattern to the share of commuters that follows mainline rail services to towns and cities such as Harlow, Chelmsford, Dartford, Tunbridge Wells, Crawley, Guildford, Reading or St. Albans; indeed, many commuters choose to live in these places so they may be in close proximity of a railway station for commuting to work.
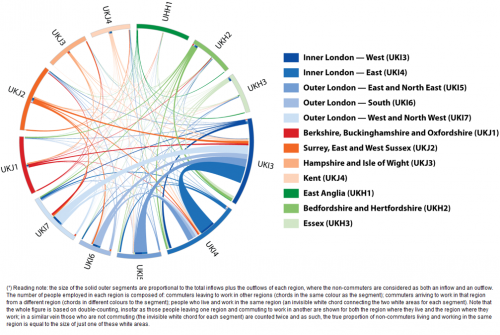
Figure 3 (see footnote for information on how to read the information presented) shows national commuter flows between a number of regions in the south-east of England. Although commuting is highly developed in the south-east of England, it is important to stress that a majority of the regional workforce worked in the same region as the one where they lived in each of the regions outside of Inner and Outer London. By contrast, commuters accounted for a majority of the regional workforce in Inner London - East, Outer London - East and North East, and Outer London - South.
Inner London - West was, by far the most popular destination for commuters in the United Kingdom, with almost 1.5 million persons commuting into this region; the second most popular destination was Inner London - East with 635 thousand commuter inflows. The three regions (from outside London) with the highest numbers of commuters flowing into Inner London - West were: Bedfordshire and Hertfordshire; Essex and; Surrey, East and West Sussex. The three regions (from outside London) with the highest numbers of commuters flowing into Inner London - East were: Bedfordshire and Hertfordshire; Essex and; Kent.
Cross-border commuting
This section switches the focus of analysis away from national commuting patterns towards cross-border commuting, in other words, it focuses on those persons who live in one country but work in another. In the majority of cases, patterns of cross-border commuting are asymmetrical: the greater the difference in average earnings or the availability of job vacancies between two regions, the more likely the region with more favourable labour market conditions will attract a higher number of cross-border commuters.
There were 438 thousand cross-border outbound commuters living in France
Although the freedom of movement may have encouraged cross-border commuting in the EU, it accounted for just 0.9 % of the EU-28 workforce in 2015. Higher shares were recorded for some of the smaller and less peripheral EU Member States, for example, 6.1 % of the Slovakian workforce commuted across a border (principally to work in Austria or the Czech Republic or Germany). In absolute terms, the highest number of cross-border commuters originated from: France (438 thousand), Germany (286 thousand), Poland (155 thousand), Slovakia (147 thousand), Italy (122 thousand), Romania (122 thousand), Hungary (111 thousand) and Belgium (107 thousand); together they provided about three quarters of all cross-border commuters in the EU.
SPOTLIGHT ON THE REGIONS
Eesti, Estonia
In 2015, a 3.2 % share of total employment in Estonia (a single region at NUTS level 2) was accounted for by residents who commuted across a border to work; this was more than three times the EU-28 average (0.9 %). Estonia shares a land border with two countries — Latvia and Russia — however, more than half of its cross-border commuters were destined for Finland (regular ferry services link the Estonian and Finnish capital cities of Tallinn and Helsinki, which are approximately 80 km apart).
©: Diego Delso, Wikimedia Commons, License CC-BY-SA 3.0
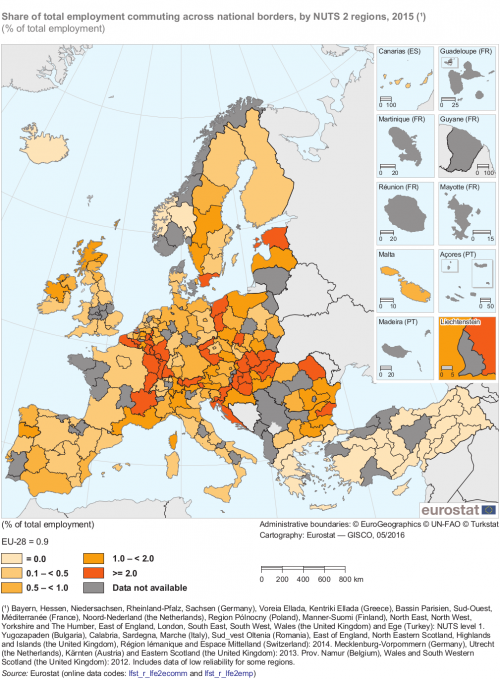
The relative importance of cross-border commuting was, unsurprisingly, generally highest among NUTS level 2 regions that share a border with a neighbouring country. Map 3 shows information for 168 regions across the EU, with 36 of these reporting that cross-border outbound commuters accounted for at least 2 % of people in their region who were employed (as shown by the darkest shade of orange); many of these regions were located in the middle of the European land mass. Indeed, a cluster of regions with relatively high shares of cross-border outbound commuters runs from the Nord - Pas-de-Calais (northern France), through the Benelux countries into Rheinland-Pfalz, Lorraine, Alsace, Freiburg, Franche-Comté and Rhône-Alpes, while another covers much of Slovakia and Hungary and then runs into Slovenia and Croatia. The share of cross-border outbound commuting was also quite high in: three regions on the western edge of Poland (Opolskie, Lubuskie and Zachodniopomorskie); two regions in the west of the Czech Republic (Jihozápad and Severozápad); the southern Swedish region of Sydsverige (which is linked to the Danish capital city region of Hovedstaden by the Øresund bridge); the Nord-Est region of Romania (which shares a border with both Moldova and Ukraine); the north-eastern Bulgarian region of Severoiztochen (which shares a border with Romania), and; Estonia (which shares a border with Latvia and Russia, and where more than half the cross-border commuters went to work in Finland).
More than a quarter of the working residents in the Belgian region of the Province Luxembourg were cross-border commuters
Cross-border outbound commuters accounted for more than one quarter (27.3 %) of people in the south-eastern Belgian region of the Province Luxembourg (which borders France and Luxembourg) who were employed. The second highest share (12.2 %) of cross-border commuting was recorded in the north-eastern French region of Lorraine (which borders Belgium, Germany and Luxembourg). These were the only regions in the EU (at the level of detail shown in Map 3) where more than 10 % of the regional workforce commuted cross-border. The third highest share (9.9 %) of cross-border outbound commuters was recorded in the western Austrian region of Vorarlberg (which borders Germany, Lichtenstein and Switzerland).
(% of total employment)
Source: Eurostat (lfst_r_lfe2ecomm) and (lfst_r_lfe2emp)
The eastern flank of France was characterised by a high number of cross-border outbound commuters
The information shown in Figure 4 is based on the top 20 European regions with the highest absolute number of cross-border outbound commuters (in contrast to Map 3 which is based on the relative share of cross-border outbound commuters in the total number of employed persons). Note also that the coverage of NUTS regions is somewhat different, as Map 3 presents some information for NUTS level 1 regions in order to maximise the number of regions that could be displayed.
SPOTLIGHT ON THE REGIONS
Rhône-Alpes, France
In 2015, two eastern French regions — Rhône-Alpes and Lorraine — recorded the highest numbers of cross-border commuters among NUTS level 2 regions in the EU, with 114 thousand and 110 thousand respectively. The majority of the cross-border commuters from the former region worked in Switzerland, while the majority of the cross-border commuters from the latter worked in Luxembourg.
©: Tabl-trai
In 2015, the south-eastern French region of Rhône-Alpes had the highest number of cross-border outbound commuters (114 thousand), although in relative terms their share of persons in the region who were employed was quite low (4.2 %). The north-eastern French region of Lorraine was the only other region in the EU to report in excess of 100 thousand cross-border outbound commuters, while the relative share of cross-border outbound commuters from Lorraine was considerably higher, at 12.2 %. There were a total of six French regions present within the top 20 regions with the highest numbers of cross-border outbound commuters; besides Rhône-Alpes and Lorraine, they included Alsace (67 thousand), Provence-Alpes Côte d’Azur (45 thousand), Franche-Comté (38 thousand) and Nord - Pas-de-Calais (30 thousand). These figures reflect, at least in part, the relatively long international border that runs down the eastern side of the French territory, as well as the large area and high population numbers covered by most NUTS level 2 regions in France.
The change in the coverage of NUTS regions in Figure 4 allows one other region to be identified, namely, the German region of Trier, where there were almost 35 thousand cross-border outbound commuters (a 12.6 % share of the number of people in the region who were employed). As such, Lorraine, Trier and the Belgian Province Luxembourg were the only regions where cross-border outbound commuting accounted for more than one tenth of the available workforce; the vast majority of the cross- border commuters from each of these regions worked in Luxembourg (see box below for more details).
Other examples of regions that are characterised by relatively high numbers of cross-border outbound commuters include the south-western German region of Freiburg and the northern Italian region of Lombardia, where most cross-border commuters were working in Switzerland (also the case for the French regions of Franche-Comté and Rhône-Alpes).
The southern Swedish region of Sydsverige is an interesting example, as its 19.1 thousand cross-border commuters were almost entirely working in the Danish capital city region of Hovedstaden. This commuter flow has only developed in recent years and has been driven by, among others, the opening of the Øresund bridge linking Malmö and Copenhagen, lower real estate prices and living costs in Sweden, and a relatively high number of job vacancies in the Danish capital. This has resulted in Swedes deciding to work in the Danish capital, but also to a number of Danes choosing to move from Copenhagen to Sweden, while maintaining their jobs in Denmark and commuting back to their ‘home’ country.
A number of other example suggests that cross-border commuting patterns may be encouraged when there are major infrastructure developments, for example, the development of high-speed train connections (such as Eurostar, Thalys or ICE) that make it relatively easy to commute longer distances.

Source: Eurostat (lfst_r_lfe2ecomm)
Cross-border commuting into Luxembourg
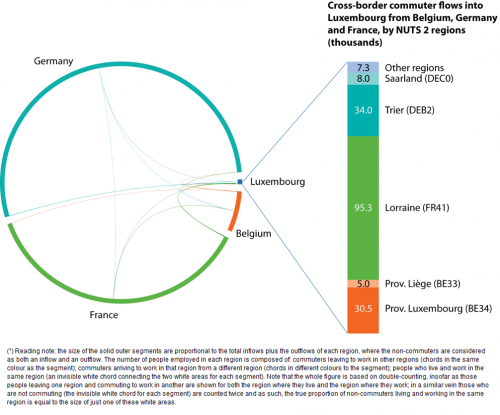
In 2015, Luxembourg (one region for the purpose of this analysis) was the most common destination for cross-border commuters in the EU (among NUTS level 2 regions), with 181 thousand cross-border inbound commuters. Its labour market attracted a high number of commuters from neighbouring countries, with approximately 42 % of the workforce in Luxembourg commuting from Belgium, Germany and France. In keeping with many regions, there was a high degree of asymmetry for cross-border commuting patterns into and out of Luxembourg. The ratio of cross-border commuters arriving in Luxembourg compared with the number leaving Luxembourg to work in another country was 31 : 1.
The high proportion of cross-border inbound commuters in Luxembourg may, at least to some degree, reflect the low level of linguistic barriers for those living across the border (as both French and German are official languages in Luxembourg) as well as the large number of subsidiaries in Luxembourg of foreign enterprises. In absolute terms, there were 97 thousand people who commuted into Luxembourg from France, which was more than twice the number who commuted from Germany (44 thousand) or Belgium (39 thousand). It is important to note that these statistics refer to the place of residence of cross-border commuters (rather than their nationality/citizenship). Indeed, the relatively high price of accommodation in Luxembourg may result in a considerable number of people (Luxembourg nationals and people from other countries) deciding to live in one of the neighbouring countries while retaining a job in Luxembourg.
Figure 5 shows that the overall impact of cross-border commuter flows between the four countries was relatively small. The 39 thousand cross-border commuters from Belgium to Luxembourg equated to 1.1 % of the total number of people in Belgium who were employed, while the shares for France (0.4 %) and Germany (0.1 %) were even lower. However, these cross-border commuter flows have a much bigger impact at a regional level. Indeed, the 31 thousand cross-border commuters from the Belgian region of the Province Luxembourg accounted for 27.0 % of the number of people in this region who were employed, while the corresponding shares for the German region of Trier (12.4 %) and the French region of Lorraine (10.5 %) were somewhat lower. Outside of the three immediate neighbouring regions, the only other regions with any sizeable commuter flows into Luxembourg were the German region of Saarland (eight thousand commuters) and the Belgian region of Province Liège (five thousand).
Analysis of outbound commuter flows by sex, age group, educational attainment and economic activity
This final section presents a set of four figures which provide alternative analyses of commuter flows according to a set of different socioeconomic factors (sex, age, educational attainment and the economic activity in which people work); note that the information collected for NUTS level 2 regions has been aggregated to the national level in order to analyse the results.
In general, men commute longer, further and more frequently than women
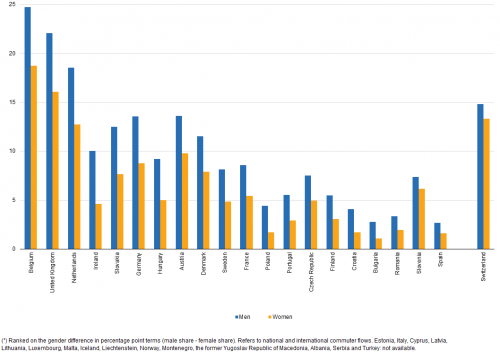
Figure 6 shows the share of male and female outbound commuters among all employed persons. In 2015, this share was systematically higher for men (than women) in each of the 20 EU Member States for which data are available; the same was also true in Switzerland. The biggest gender gaps were recorded in those EU Member States that had the highest shares of outbound commuters, namely, Belgium and the United Kingdom, where the proportion of men commuting to a different region was 6.0 percentage points higher than the corresponding share for women.
Age is another important determinant for commuting behaviour, with young people tending to commute longer and further than older people
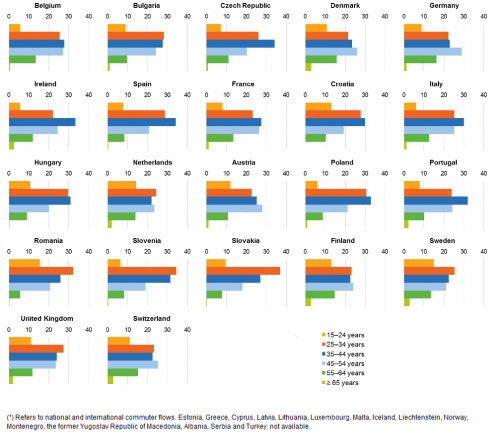
Figure 7 shows an analysis by the age of commuters for 21 EU Member States; it is based on national and cross-border commuter flows from NUTS level 2 regions. In 2015, the most common age groups for outbound commuters were generally 25–34 or 35–44 years, although in Denmark, Germany, Austria and Finland, it was more commonplace for outbound commuters to be somewhat older (45–54 years); this was also the case in Switzerland. Note that these shares reflect, to some degree, the age structure of each individual workforce, for example, there has been little or no population growth in Germany in recent years, with very low fertility rates and an ageing population; this may, at least in part, be reflected in the share of German commuters who were aged 45–54 years.
In the western EU Member States, those with a higher level of educational attainment were more likely to commute
The highest share of outbound commuters by educational attainment was recorded among those with an upper secondary or post-secondary non-tertiary level of education; this was particularly the case in most of the eastern EU Member States. In the western Member States, it was more commonplace to find that the highest share of outbound commuters was recorded among those with a tertiary level of educational attainment; this was also the case in Switzerland. Portugal was the only country to report that its highest share of outbound commuters was registered among those with at most a lower secondary level of educational attainment.
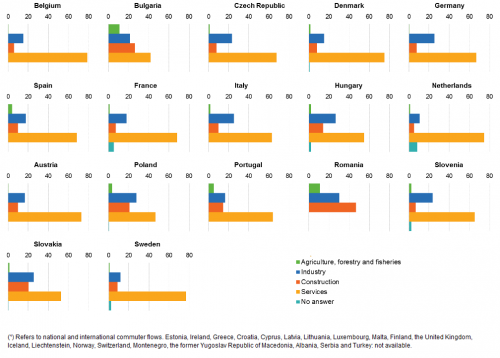
Figure 9 presents an analysis of the economic activities which provide work to outbound commuters; it is important to note that the shares presented, reflect, to a large degree, the economic structure of each economy. As the services sector accounts for the largest share of economic activity in each of the EU Member States, it is perhaps not surprising to find that the proportion of commuters working in services ranged, in 2015, from a low of 41.7 % in Bulgaria and less than half of the outbound commuting workforce in Romania and Poland, up to a high of 78.5 % in Belgium. Industrial activities generally accounted for the second highest share of commuters, although this pattern was not observed in Bulgaria and Romania, where more than a quarter of all outbound commuters worked in construction, while a higher proportion of outbound commuters in Romania worked in agriculture, forestry and fisheries than in industrial activities.
To conclude, there may be a range of different motivations that explain why some people commute to work. One of the most important is likely to be balancing the availability of well-paid job opportunities with the quality of life and affordability of accommodation. People with higher incomes tend to commute further, while managers and professionals also travel further than people in other occupational groups. This may be linked to higher paid jobs being concentrated in large urban centres and capital cities, where the quality of life is sometimes considered as far from ideal (for example, when bringing up a family). As men tend to occupy more management roles and have higher average earnings than women, this may explain, at least in part, why commuters tend to be predominantly male, within the age group of 25–44 years, and with at least an upper secondary or post-secondary non-tertiary level of education.
Source data for tables and graphs
Data sources
The data presented in this article are derived from a special analysis of labour force survey (LFS) data. The LFS population generally covers those persons aged 15 and over, living in private households. The survey follows the definitions and recommendations of the International Labour Organisation (ILO). More information on regional statistics from the LFS can be found in an article which presents a regional analysis of the labour market, or in an online publication on EU labour force survey statistics.
NUTS
The data presented in this article are based exclusively on the 2013 version of NUTS.
Defining commuters
Annual data for outbound commuters are available from 2010 onwards and are presented as numbers by NUTS level 2 region. The total number of people in each NUTS level 2 region who were employed may be analysed in terms of those who work: in the same region as their place of residence (‘non-commuters’); in a different region of the same EU Member State (‘national commuters’); in a foreign country (‘cross-border commuters’). As commuting is defined in terms of the number of persons employed, the count includes the not just employees but also the self-employed.
Commuting is defined in relation to each person’s main place of residence, with commuters exercising their occupation in a region (national or international) other than the one in which they reside. Commuters should return, on average, at least once a week to their main place of residence from the region where they are working. For international/cross-border commuters, nationality is not considered as a determining factor, as there are cases where people may move from one country to another in order to benefit from, for example, lower housing and living costs, but then commute back to their home country for work.
Context
Under the Treaty on the Functioning of the European Union (TFEU), individuals are entitled to move freely for work reasons from one EU Member State to another without suffering discrimination as regards employment, remuneration or other conditions of work and employment. Someone who works in one EU Member State but lives in another and returns there at least once a week is considered to be a cross-border commuter under EU law. During their everyday life they are subject to the laws of both countries, with the laws for their place of work determining employment and income taxes as well as most social security rights, while the laws for their place of residence determine property and most other taxes, as well as residence formalities.
Labour market mobility
In its efforts to enhance the EU’s competitiveness and foster job creation, the European Council identified mobility as a key element for achieving the goals of the European Employment Strategy (EES), which now constitutes part of the Europe 2020 strategy. Notwithstanding the efforts undertaken to facilitate mobility, in both geographic and labour market terms, the current mobility rates of workers in the EU remain relatively low.
EUROPEANMOBILITYWEEK is supported by the European Commission’s (EC’s) Directorate-General for Mobility and Transport. It is designed to encourage urban mobility solutions, which help contribute to the EU’s climate change objectives — for example, by encouraging people to walk, cycle, or use public transport more; the promotion of more sustainable modes of transport should help reduce emissions, pollution, congestion, noise and accidents.
In 2016, the EUROPEANMOBILITYWEEK campaign will examine some of the close ties between transport and economics, under the heading of ‘Smart and sustainable mobility — an investment for Europe’, providing an opportunity to present sustainable mobility alternatives and to explain the challenges being faced to induce behavioural change and make progress towards creating a more sustainable transport strategy for Europe.
For more information: http://www.mobilityweek.eu/.
Direct access to
- Regional labour market statistics (reg_lmk)
- Regional employment - LFS annual series (lfst_r_lfemp)
- Employment and commuting by NUTS 2 regions (1 000) (lfst_r_lfe2ecomm)
- Regional employment - LFS annual series (lfst_r_lfemp)
- LFS series -Specific topics (lfst)
- LFS regional series (lfst_r)
- Regional employment - LFS annual series (lfst_r_lfemp)
- Employment and commuting by NUTS 2 regions (1 000) (lfst_r_lfe2ecomm)
- Regional employment - LFS annual series (lfst_r_lfemp)
- LFS regional series (lfst_r)
- ESMS metadata files
- Regional labour market statistics (ESMS metadata file — reg_lmk_esms)
