Archive:SDG 8 - Decent work and economic growth (statistical annex)
This Statistics Explained article has been archived - for recent articles on sustainable development in the European Union see here.
Promote sustained, inclusive and sustainable economic growth, full and productive employment and decent work for all (statistical annex)
Data extracted in May 2021.
Highlights

This article provides an overview of statistical data on SDG 8 ‘Decent work and economic growth’ in the European Union (EU). It is based on the set of EU SDG indicators for monitoring of progress towards the UN Sustainable Development Goals (SDGs) in an EU context.
This article is part of a set of statistical articles, which are based on the Eurostat publication ’Sustainable development in the European Union — Monitoring report on progress towards the SDGS in an EU context — 2021 edition’. This report is the fifth edition of Eurostat’s series of monitoring reports on sustainable development, which provide a quantitative assessment of progress of the EU towards the SDGs in an EU context.
Full article
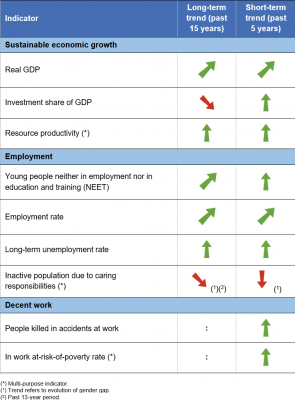
Table 1: Indicators measuring progress towards SDG 8, EU
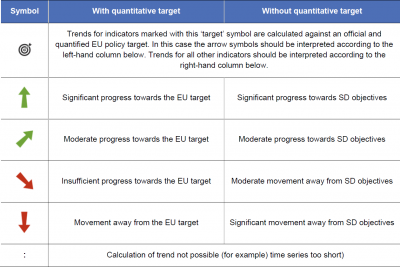
Table 2: Explanation of symbols for indicating progress towards SD objectives and targets


Real GDP

Gross domestic product (GDP) is a measure of economic activity and is often used as a proxy for changes in a country’s material living standards. It refers to the value of total final output of goods and services produced by an economy within a certain time period. Real GDP per capita is calculated as the ratio of real GDP (GDP adjusted for inflation) to the average population of the same year and is based on rounded figures.
.png)
Compound annual growth rate (CAGR): 0.6 % per year in the period 2005–2020; 0.2 % per year in the period 2015–2020.
Source: Eurostat (sdg_08_10)
.png)
Source: Eurostat (sdg_08_10)

Investment share of GDP measures the investment for the total economy, government and business, as well as household sectors. The indicator is calculated as the share of GDP used for gross investment. It is defined as gross fixed capital formation (GFCF) expressed as a percentage of GDP for the government, business and households sectors.
.png)
Compound annual growth rate (CAGR) for total investment: – 0.1 % per year in the period 2005–2020; 1.4 % per year in the period 2015–2020.
Source: Eurostat (sdg_08_11)
.png)
Young people neither in employment nor in education and training (NEET)
_evaluation_2021.png)
A considerable proportion of young people aged 15 to 29 in the EU are economically inactive. For some this is due to the pursuit of education and training. Others, however, have withdrawn from the labour market or are not entering it after leaving the education system. Those who struggle with the transition from education to work are captured by the statistics on young people who are neither in employment (i.e. economically inactive or unemployed), education nor training (NEET rate). Data presented in this section stem from EU Labour Force Survey (EU-LFS).
,_by_sex,_EU,_2002-2020_(%25_of_population_aged_15_to_29).png)
Compound annual growth rate (CAGR) for the total: – 0.7 % per year in the period 2005–2020; – 2.1 % per year in the period 2015–2020.
Source: Eurostat (sdg_08_20)
,_by_country,_2015_and_2020_(%25_of_population_aged_15_to_29).png)
Source: Eurostat (sdg_08_20)
Employment rate

The employment rate is defined as the percentage of employed persons in relation to the comparable total population. The data analysed here focus on the population aged 20 to 64. Employed persons are defined as all persons who, during a reference week, worked at least one hour for pay or profit or were temporarily absent from such work. Data presented in this section stem from the EU Labour Force Survey (EU-LFS).
.png)
Compound annual growth rate (CAGR) for the total: 0.5 % per year in the period 2005–2020; 0.9 % per year in the period 2015–2020.
Source: Eurostat (sdg_08_30)
.png)
Source: Eurostat (sdg_08_30)
Long-term unemployment rate

Long-term unemployment is measured for economically active people (which includes both employed and unemployed people) aged 15 to 74 who have been unemployed for 12 months or more. Long-term unemployment increases the risk of falling into poverty and has negative implications for society as a whole. Long-term unemployed people in the EU have about half the chance of finding employment as those who are short-term unemployed [1]. Data presented in this section stem from the EU Labour Force Survey (EU-LFS).
.png)
Compound annual growth rate (CAGR) for the total: – 3.5 % per year in the period 2005–2020; – 12.9 % per year in the period 2015–2020.
Source: Eurostat (sdg_08_40)
.png)
Source: Eurostat (sdg_08_40)
People killed in accidents at work

Fatal accidents at work are those occurring during the course of employment and leading to the death of the victim within one year; commuting accidents occurring between the home and the workplace are excluded. The incidence rate refers to the number of accidents per 100 000 persons in employment. Data presented in this section are collected in the framework of the administrative data collection 'European Statistics on Accidents at Work (ESAW)' [2]. As an exception, fatal accidents data for the Netherlands are derived from survey data, these data are not available from administrative sources.
.png)
Compound annual growth rate (CAGR) for the total: – 1.6 % per year in the period 2013–2018.
Source: Eurostat (sdg_08_60)
.png)
Source: Eurostat (sdg_08_60)
Direct access to
More detailed information on EU SDG indicators for monitoring of progress towards the UN Sustainable Development Goals (SDGs), such as indicator relevance, definitions, methodological notes, background and potential linkages, can be found in the introduction of the publication ’Sustainable development in the European Union — Monitoring report on progress towards the SDGS in an EU context — 2021 edition’.
Notes
- ↑ European Commission (2016), Employment and Social Developments in Europe 2015, Publications Office of the European Union, Luxembourg, p. 13.
- ↑ Eurostat (2013), European Statistics on Accidents at Work (ESAW) - Summary methodology, Publications Office of the European Union, Luxembourg.